Iotausd
Descending Triangle miota\USD - DIf today candle close above slim yellow line, then price will likely move towards bold yellow line. Then hopefully breakout-retest-and blast off to infinity.
Fundamentals of this project are so unbelievable, mIOTA is massively undervalued at this time. There has been a plethora of great news this year, including: partnering with the Linux Foundation, OMG Global Standardized Protocol, Abra, Qubic, Coordicide, Paracosm, Trintiy, and so much more.
IOTAUSD formed bullish Gartley | upto 13% movePriceline of IOTA / US Dollar cryptocurrency has formed a bullish Gartley pattern and entered in potential reversal zone.
This PRZ area should be used as stop loss in case of complete candle stick closes below this zone.
I have used Fibonacci sequence to set the targets:
Buy between: 0.2645 to 0.2548
Sell between: 0.2721 to 0.2904
Regards,
Atif Akbar (moon333)
IOTAUSDT forming bullish Crab | A long opportunity coming aheadPriceline of IOTA / US Dollar cryptocurrency is forming bullish Crab pattern and soon it will be entered in potential reversal zone.
This PRZ area should be used as stop loss point in case of complete candle stick closes below this area.
I have used Fibonacci sequence to set the targets:
Buy between: 0.2619 to 0.2558
Sell between: 0.2667 to 0.2782
Regards,
Atif Akbar (moon333)
IOTAUSD formed bullish BAT pattern | Upto 11% movePriceline of IOTA / US Dollar cryptocurrency has formed a bullish BAT pattern and entered in potential reversal zone.
This PRZ area should be used as stop loss in case of complete candle stick closes below this zone.
I have used Fibonacci sequence to set the targets:
Buy between: 0.2673 to 0.2631
Sell between: 0.2772 to 0.2921
Regards,
Atif Akbar (moon333)
Scary Spooky Vampire Bat FormationBOO!
Did I scare you with my drawing?
I invented this pattern and typically the forthcoming PA is a lot of big green dildos. I am very bullish, and expecting near infinty% returns from this investment. Treat yourself to as much IOTA as you can afford, deposit it to safe cold storage, and wait for the machine economy to take over everything. ;)
Entry Price: <0.30$
TP1: 350$
Goodluck!
IOTA Technical Analysis - IOTAUSD - 37%-326% Profit ExpectedIOTA - IOTAUSD - Technical Analysis - 37%-326% Profit Expected
Get Ready For A Big Move ... 3x - 4x Gains Expected.
Based on AB=CD pattern , Time Ratio & Gann Analysis, It's a potential long position with great returns :)
In a lower time-frame (4hrs) this long position has also been confirmed.
Target Profit Range - 0.24 - 0.64
(37%-326% Profit Expected)
TP - 1 - 0.24
TP - 2 - 0.33
TP - 3 - 0.40
TP - 4 - 0.47
TP - 5 - 0.55
TP - 6 - 0.64
Buying Zone! Long Position
Early Entry Trigger Point - 0.16 - 0.19
Ideal Entry Trigger Point - 0.12 - 0.15
For Bigger Time-Frame
***If you want to get in this trade from this point 0.28 you can still make 18% profit till TP2 is reached. There is a very high probability that price may continue to move upwards before it moves downwards towards my ideal entry point., It is recommended to enter with a smaller lot size if you want to go long right away & manage your stop loss accordingly.
Short-term Trade- 1hr- chart
I see a possible move going upwards and may hit 0.33 or it can even touch 0.37 mark that's why I have marked the points in a chart for a short-term long position too. As it's a short term trade, it is highly recommended to enter with a smaller lot size if you want to go long right away & manage your stop loss accordingly.
Good Luck.!
Disclaimer - This is not financial advice. This is my personal view and analysis of this chart.
If you follow this idea please plan your trade according to your lot size and account equity.
Don't forget to like, comment & follow , If you agree with my analysis :)
IOTAUSD formed bullish BAT | Upto 13% move expectedPriceline of IOTA / US Dollar cryptocurrency has formed a bullish BAT pattern and entered in potential reversal zone.
This PRZ area should be used as stop loss in case of complete candle stick closes below this zone.
I have used Fibonacci sequence to set the targets:
Buy between: 0.2505 to 0.2454
Sell between: 0.2615 to 0.2786
Regards,
Atif Akbar (moon333)
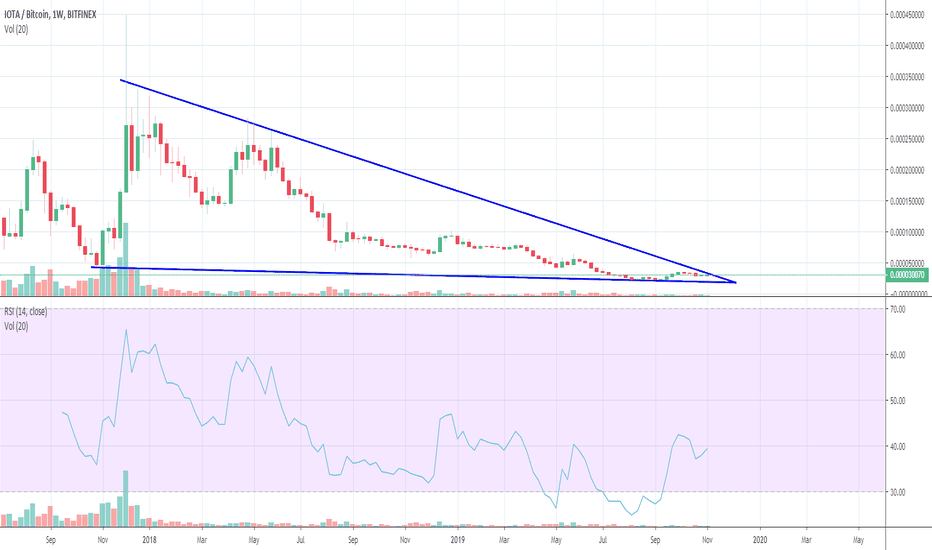
LONG IOTABTCPosted this up already but just in case you didnt see it this is the most bullish chart Ive seen in a while. ZECUSD pair looks great as well but this one takes the cake. The IOTAUSD pair looks really nasty but if BTC is already bottomed and IOTABTC is about to pump then the meat of the move will be in the ALTUSD pairs.
God Speed,
Mr. Manbearpig
IOTAUSD hitting support of pennant | A good long opportunityPriceline of IOTA / US Dollar is moving within a bullish pennant.
Now the price action has hit the support of pennant and bollinger bands and also 100 SMA support.
Volume profile of complete pennant is showing less interest of traders here.
200 SMA has crossed down the priceline to lift the candles up.
MACD turning bullish.
I have defined targets using Fibonacci sequence:
Sell between: 0.2765 to 0.2855
Regards,
Atif Akbar (moon333)
IOTAUSD formed bullish Cypher | A good long opportunityPriceline of IOTA / US Dollar has formed a bullish Cypher pattern and entered in potential reversal zone.
This PRZ area should be used as stop loss.
I have used Fibonacci sequence to set the targets:
Buy between: 0.2695 to 0.2682
Sell between: 0.2705 to 0.2730
Regards,
Atif Akbar (moon333)


