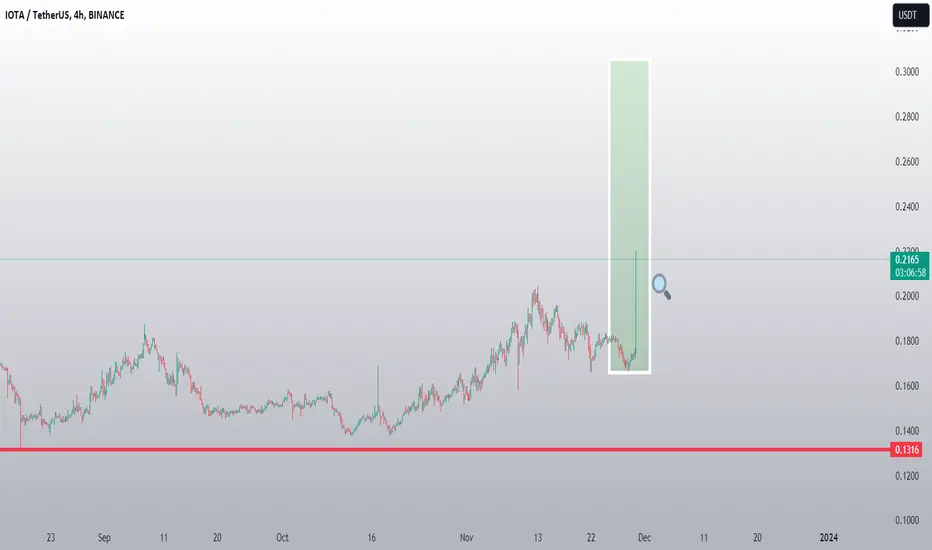
WHAT AFTER THE VOLUME INCREASE IOTAThank you for reading this update.
Depending on our study we see that IOTA has a good chance of volume increase.
This updates depending on day trade, And the market should confirm with time the right market way.
Since the last increase its important to see IOTA having a new confirmation.
If there is new trend ww follow with new update.
#Nottradingadvice
Iotausd
Bitxer's IOTX/USDT: Scalp Smart, Trade Safe! 📈🛡️ IOTX/USDT for potential trading opportunities. Utilizing a graph pattern for both scalping and long-term strategies is a prudent approach. Waiting for a breakout from the supply zone could indicate a favorable entry point for a long position. Similarly, if it heads towards the supply zone, exercising patience might be wiser than risking losses. Bitxer is here to provide guidance and insights. Always prioritize your risk management strategy for successful trading! 📊💡🚀

IOTAUSDT Trend Line Breakout! IOTAUSDT Technical Analysis Update
Buy zone : Below $0.190
Stop loss : $0.170
Take Profit 1 : $0.205
Take Profit 2 : $0.250
Take Profit 3 : $0.370
Always Keep Stop Loss

IOTA --- Will it's 3rd cycle be cursedCurrently enjoying a nice pop!
But where does an old asset like #IOTA go this cycle
IOTA may be doing well just getting above a $1
Some older coins I'm actually bullish on like
#LTC and #XRP as I believe these two will be included in some of crypto index devised by wall st
But coins out of that top 20/30 may that have been around since 2017 may languish
Too much competition for attention

🚀 **IOTA/USDT - Long Position!** 📈🚀 **IOTA/USDT - Long Position!** 📈
Here's your step-by-step guide to this exciting trading opportunity:
🎯 **Entry Points**:
- Step 1: Secure your entry at 0.1412.
- Step 2: If the trend is in your favor, consider entering at 0.1445.
- Step 3: Further opportunities at 0.1469.
- Step 4: The ultimate target is 0.1522 - the sky's the limit! 🚀
🛡️ **Safety First**: To ensure your financial safety, set a stop loss at 0.1371. This acts as a safety net in case the market takes an unexpected turn.
🚁 **Prepare for Liftoff**: Now, it's time to go long on IOTA/USDT. As you progress through the entry points and your position starts to gain momentum, keep your sights on those targets. With patience and strategy, we're ready to soar together into the world of profit. 🌠🚁
Happy trading, and may your journey be a prosperous one! 📊💰

IOTAUSD Strong sell on 1day MA100 rejection.IOTAUSD got rejected on the 1day MA100 today.
This made the latest Lower High inside the 10 month Falling Wedge, which keeps the trend bearish.
Sell now and target 0.13500 (Support A).
The 1day RSI got rejected on its own Falling Resistance.
Follow us, like the idea and leave a comment below!!

IOTAUSD ❕ risingIOTA breaks up 200EMA (1H TF)
RSI is moving in the buying zone.
I think that the chart will continue to grow after overcoming the resistance.

IOTA - 4H selling movements persistIOTAUSDT is likely to decline further and reach its previous low. This presents a great opportunity to sell with a suitable stop-loss in place.

IOTA / IOTAUSDTGOOD LUCK>>>
• Warning •
Any deal I share does not mean that I am forcing you to enter into it, you enter in with your full risk, because I'll not gain any profits with you in the end.
The risk management of the position must comply with the stop loss.
(I am not sharing financial or investment advice, you should do your own research for your money.)

#IOTA/USDT falling wedge#IOTA/USDT falling wedge
According to the chart, the falling wedge or ending diagonal pattern is formed at the end of an upward trend, which promises the possibility of starting an upward movement. This upward movement can be both a long-term uptrend, and it can be a correction in the middle of a downtrend.
Based on this pattern and the placement of the price at the bottom of the channel, we can expect to see the price grow up to one of the following targets.
TP1: 0.19$
TP2: 0.27$
TP3: 0.35$
TP4: 0.55$
Price now: 0.1516
STOP LOSS: 0.1180

IOTAUSD ❕ declineIOTA has fixed under 200EMA (30m TF)
Indicators are still unable to form a pivot point.
I believe that the asset will continue to decline.

IOTAUSD ❕ ascending wedgeIOTA is moving in an ascending wedge.
Price, RSI chart and trading volume dynamics have formed a divergence (4H TF)
I believe that the asset will start correction after fixing under the resistance level.

IOTA Spring-loaded for a 'Hook' Rebound: Bottom-Bounce 🚀IOTA Gears Up for a 'Hook' Move off the Bottom 🎣📈
IOTA/USDT 3-day Chart: Primed for Action 💥
--> Unlocking Potential = Breaking 16 Cents Resistance <--
A Strong Project, ISO 20022 Compliant 🌐 #Crypto #IOTA
IOTA is a unique cryptocurrency that employs a revolutionary technology called the Tangle, a directed acyclic graph (DAG), instead of a traditional blockchain. This enables feeless microtransactions and scalable network growth. IOTA aims to power the Internet of Things (IoT) by facilitating secure data and value transfers between machines. It stands out for its focus on scalability, security, and efficiency, making it a promising solution for IoT applications and beyond. IOTA's innovative approach has garnered attention from industries seeking to leverage its decentralized architecture for various real-world use cases.

The 0.1765-0.1968 section is the first diverging sectionHello?
Traders, welcome.
If you "Follow", you can always get new information quickly.
Please also click "Boost".
Have a good day.
-------------------------------------
(IOTAUSDT chart)
(1D chart)
Could the current be the last low point of this time?
This can only be known in the past.
Therefore, rather than worrying about such things, it is necessary to focus on determining the timing of short-term buying by checking whether there is support or resistance at any point or section.
In that sense, the 0.1765 point is an important support and resistance point.
Therefore, the key is whether the price can sustain the price increase above the 0.1765-0.1968 range.
To do so, it is important to be able to hold the price up until it rises above 0.1592 and the MS-Signal indicator turns into a bullish sign.
When this happens, it's time to start short-term trading.
Depending on whether this short-term trade rises above the 0.1765-0.1968 range or not, you need to decide whether to get a cash profit or leave the number of coins (tokens) corresponding to the profit to have the power to continue trading.
It takes a lot of time to turn into a full-fledged uptrend, so it's tedious and exhausting to keep increasing your holdings until then.
However, if you increase the number of coins (tokens) you have for profit, you will eventually be able to get a big profit.
Whether it's worth taking IOTA into mid- to long-term trading that way is up to you.
FYI, the current coin market is still far from the real world.
Therefore, the real world, that is, whether or not there is business value, should not be used to determine the value of a coin.
Whether or not the current coin is worth investing in is based on the number of users, that is, whether or not there is community power.
-----------------------------------------------
(IOTAKRW chart)
(1D chart)
It needs to rise above 329 to turn into an uptrend.
To do so, it needs to show a rise above 217 to hold the price.
Based on the current trend, whether it can rise above the 217-283 zone will determine whether a trend reversal will begin or whether the cascade will continue.
Therefore, in order to start trading IOTA, when it shows support around 217, I think it's when the MS-Signal indicator turns into a rising sign and shows support and rising.
-------------------------------------------------- -------------------------------------------
** All descriptions are for reference only and do not guarantee profit or loss in investment.
** The trading volume indicator is displayed as a candle body based on 10EMA.
Display method (in order of boldest)
More than 3x 10EMA trading volume > 2.5x > 2.0x > 1.25x > trading volume below 10EMA
** Even if you know other people's know-how, it takes a considerable period of time to make it your own.
** This is a chart created with my know-how.
---------------------------------

IOTAUSD ❕ support areaTrading volumes decreased on the price correction and the chart reached the support area.
The asset has fixed above the 50EMA (4H TF)
The 1H TF shows that the price chart and RSI are forming a convergence.
RSI is holding above 50 pips.
I believe that the asset will rise after fixing above the current area.

IOTA and the 1150 Risk To rewards potential Opportunity Hi Everyone;
today we have one of the best risk to reward Investment opportunity
it is more than 1150 times the risk and the chart is look very promising.
I expect breaking the previous bear market key point will clear the way to the final target

IOTA Main Targets for Bull RunBINANCE:IOTAUSDT
Iota main conservative targets for bull run
Possible Targets and explanation idea
➡️Yearly chart. Most negative scenario its a sweep liquidity March 2020 lover 0.0534$
➡️Based on my ADZ indicator we got huge weekly divergency - Bullish
➡️Trade inside 27 zone on weekly fib - accumulation stage/ bottom
➡️Have a chance to test 0.13 again or 0.10 before bounce but not an necessarily
➡️Take profit line now around 0 level 0.67 cents
➡️ Main middle term target is sweep liquidity at 0.76 lvl fib around 2.25
Hope you enjoyed the content I created, You can support with your likes and comments this idea so more people can watch!
✅Disclaimer: Please be aware of the risks involved in trading. This idea was made for educational purposes only not for financial Investment Purposes.
---
• Look at my ideas about interesting altcoins in the related section down below ↓
• For more ideas please hit "Like" and "Follow"!

IOTA ANALYSIS (1D)Hi, dear traders. how are you ? Today we have a viewpoint to BUY/LONG the IOTA symbol.
For risk management, please don't forget stop loss and capital management
When we reach the first target, save some profit and then change the stop to entry
Comment if you have any questions
Thank You

IOTAUSD ❕ reversalRSI moves in bearish zone (4H TF)
Price has fixed under the 50EMA (1H TF).
I believe the asset will decline after fixing under the support level.

IOTA Analysis 28/02/2021seems golden zone is standing and the retracement is done, we can long it i believe now . it will ultimately go up, just the matter of time
3 TPs specified
1 TP is very easy to achieve
if 2 TP triggered with in the same impulse wave then we can be very bullish on the Coin and not take profit and Holding the Position for the 3 TP

IOTAUSD MIOTA Sell TF H4 TP = 0.1565On the 4-hour chart the trend started on June 27 (linear regression channel).
There is a high probability of profit. A possible take profit level is 0.1565
But do not forget about SL = 0.1970
Using a trailing stop is also a good idea!
Please leave your feedback, your opinion. I am very interested. Thank you!
Good luck!
Regards, WeBelieveInTrading

IOTAUSDT-the price is set to go even lowerHello everyone. Today we will look at IOTAUSDT. On the daily timeframe, the situation is not very good, since the trend line covers the price from above, which has been dictating the trend to the coin for six months. Even on smaller timeframes, the chart shows a local level of 0.177 is being squeezed. Therefore, we should expect a hike down to 0.14.

IOTA: Bullish Butterfly RSI Bullish Divergence (Final Fib Level)IOTA is currently sitting at the 1.272 PCZ of a Bullish Butterfly and this 1.272 extension happens to be the last positive Fibonacci Extension on the linear scale, meaning that this is probably the least risky area possible to buy IOTA and perhaps aim for much higher levels, even as high as 1–2 dollars.
Given how tight the entry and price action are, I think as long as it holds above 15 cents, we could see it go for some major Bullish targets.
