IOTAUSDT Double bottom or lowerI don't expect many people to agree with me on this but I do think we are going for double bottom or worse. Ultimately, it will depend on BTC.
Iotausd

Trading plan IOTUSD 2.14.2019After the candlestick fixation of the model "flag" abroad, buy with a target of 0.032.

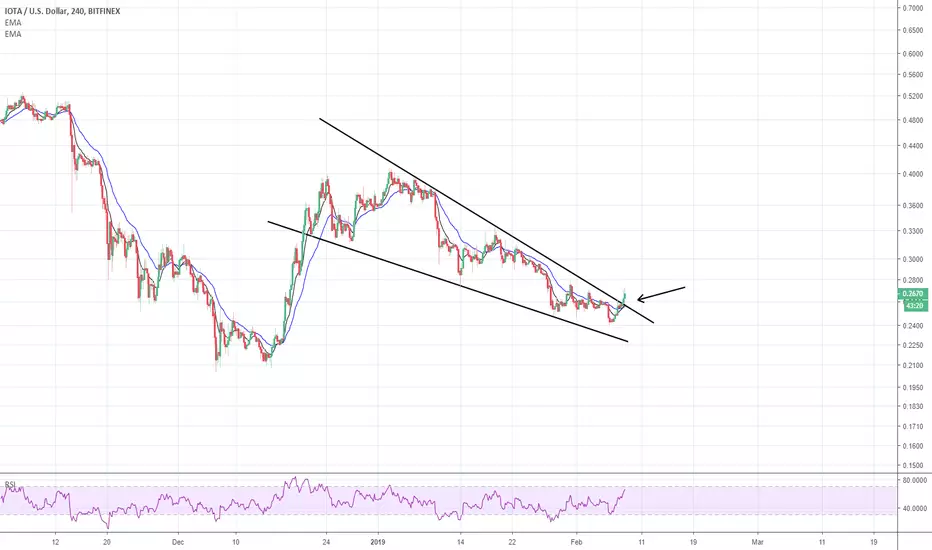
IOTA ideaFor those who trade on Bitfinex, IOTUSD looks not bad with a possible pop up to ~$0.40, take a look. Buying around $0.27 - $0.26 with a stop below $0.24 (aggressive) or $0.22 (more conservative), keep your risk small, guys.

Iota - either this or die.How long will iota be thus cheap?
Enabling the true Internet-of-Things through the Machine Economy.
The number of connected devices that will be in use is estimated to reach 75 billion by 2025. From tiny sensors on roads and bridges to wearable electronics, mobile phones, and more, every day the world is becoming more and more interconnected. The amount of data being produced and consumed by all these devices is already astronomical. By the end of 2016, the run rate of IP traffic was 1.2 zettabytes per year - or enough data to fill over 9 billion of the highest storage capacity iPhone's available at the time. Over the next five years, global IP traffic is expected to increase five-fold whereby 2021, monthly IP traffic will reach a staggering 31 Gigabytes per capita.
But there is a significant problem. During the same period, broadband speeds are expected only to double, and the electromagnetic spectrum is a fundamental limit for wireless communication. The global data pipelines are becoming congested. It will not be possible for all these devices to continuously connect to centralized cloud silos for all the data they will produce, nor will it be possible for analytic engines in these clouds to respond back to the actuators to act on the data in real time. This is where 'Fog' and 'Mist' computing, storage, bandwidth, electricity enters the picture. One has to distribute these resources all across the landscape, which immediately brings up the question of how to do this in practice with all the red tape in place when there are 10s, 100s or even 1000s of stakeholders involved in this new Machine Economy. This conundrum was the cause of the inception of IOTA. Through zero fee transactions, these devices can share these technological resources amongst one another in real time locally in a distributed network, thus avoiding the centralized points of failure, unclogging the resource infrastructure and abide by the laws of physics.


IOTA BreakoutIOTA broke out of this falling wedge pattern this morning, I am expecting more upside to come!
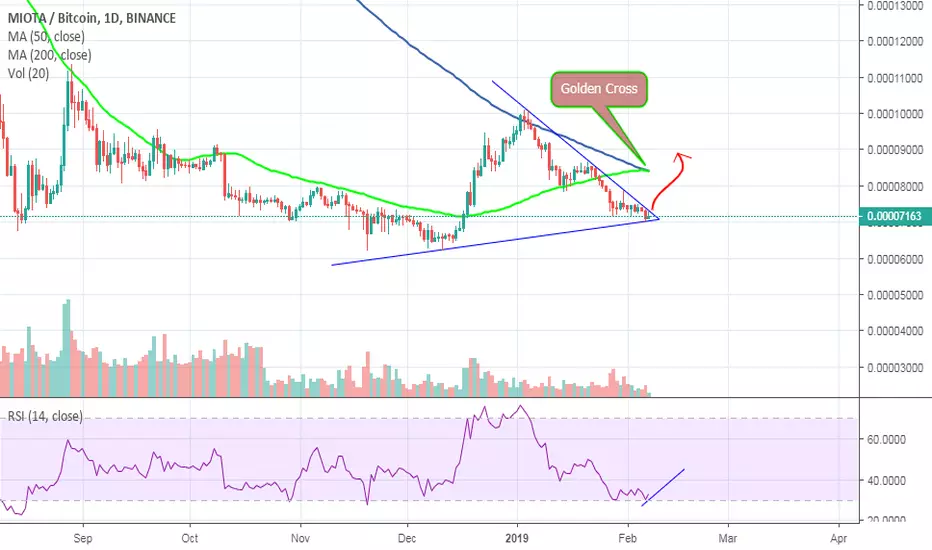
IOTA Chart Analysis Hello everyone hope you are doing good
In this Chart we can see some bullish moment in IOTA
RSI :- Oversold
also we have golden cross
price is bottomed already
hope it will work and price will be up soon
IOTA on a BULLISH divergence!Just a thought, seeing as Iota broke out of a two month resistance :)
gr
O


IOTAUSD - 1D Chart Analysis
The end of the year has represented a good period for Iota, with it's price increasing from 0.2506$ on the 17th of December to 0.3726$ on the 10th of January, registering a total growth of 48.63%.
Although the odds were looking favorable, the coin was pressured afterwards by the drop of the market capitalization, with the investors being concerned more about the stock market earnings season.
In other words, once the bearish trend on a 1D chart was settled on the 10th of January, we could see a period in which the price evolution was slow and inconsistent, followed by 6 consecutive days of losses (including today) caused mainly by the very low trading volumes.
And even if the RSI and the Stochastic are close to their "oversold" levels, the MACD is still below the Signal, meaning that it's possible that the price to slow down for a couple of days and then to drop again.
Considering also that in the following days we'll have companies like Apple, Pfizer, Verizon and other big names coming up with their financial results, it's possible for the total market capitalization to continue it's negative rally and also for the price of Iota to go towards 0.2050$.
The save up may come from the FED if it will take a surprising decision on Wednesday, but the chances are fairly small.

IOTA/USD IOTA/USD is trading inside a range
IOTA has been failing to breakout of $0.4037 for four week
the bears pushed prices back but lower levels are attracting buying as the bulls try to stage a recovery.
If the coin rises from the current levels, the bulls will again attempt to breakout from $0.4037.
If successful, a rally to $0.6, followed by a move to the next overhead resistance of $0.8152, is probable.
However, if the bulls fail to force a turnaround at the current levels, a drop to $0.2051 is likely.
If this support breaks, a retest of the critical support of $0.1427 will be on the cards.
The downtrend will resume if this level gives way.
(Not a trading advice.)


Megalodon Pro Automated Trader - Iota - Short Term Bull Megalodon Pro Automated Trader is giving short term buy signals(orange) on hourly time frame.
----------------------------------------------------------------------------
We believe that enlightening others is an incredible way to make this world a better place. That's why we created the tools you need to stop worrying about your investments and focus on what really matters in your life.
What is Megalodon ?
Megalodon uses Artificial Intelligence that combines 574 back-tested indicators and 2674 back-tested setups, simultaneously.
Megalodon works with any kind of asset , market state and time frame .
What is the win rate?
Megalodon is extremely accurate and offers insane profits as long as the fundamental analysis is done right .
Backtesting results can be found on our social media or down below .
How to use Megalodon Pro Automated Trader?
Simply, orange rectangles are buy signals and purple rectangles are sell signals .
Green clouds show buy signals and red clouds show sell signals.
Yellow line shows the difference between buy and sell counts.
How to set alarms on Megalodon Pro Automated Trader?
Click on Alert, select Megalodon Pro Automated Trader and click on Buy-Signal or Sell-Signal. More details can be found on our social media.
You may also watch our Megalodon Investing Tutorials on Youtube for more information.
How to purchase?
Megalodon is totally FREE .
You may upgrade to Megalodon Pro for the most important features , including automizing your trading on any asset profitably, setting up alarms to get notified , joining to our VIP telegram channel to learn and our VIP telegram group to interact with the community. Simply go to our website on our TradingView page for learning more and joining us for free.
Some of the backtesting results are:
BTC/USD for longer time frame trading in the bear market for the last year.
APPLE for longer time frame trading in the bull market for the last 10 years.
EURO/USD for day trading in the neutral market for the last month.
BTC/USD for day trading in the bull market for the last 15 days.
APPLE for day trading in the neutral market for the last 2 days and 6 hours.

January possibilities for IOTA - swing to 0.50IOTA has reached to a key level. It is basically the first time since mid march we have held the price above 55 EMA on a daily chart, which at the moment acts as a nice/strong support line. In order to have a continuing bullish movement, we have to see if IOTA can get a nice bounce upwards from the 55 EMA (from 0.35). That would confirm the golden cross-over and the fact that it is not a bull trap. If we succeed with this scenario, IOTA should have a bullish movement up to 0.50 where a major resistance lies (the channel confirms it, as well as previous lows from october and august) There we should see some correction. Still it is a potential 35-38% (even 40%) gain in the January period for swing traders, as long as the requirements are met.
Stay safe!
This is not financial advice. Just a fellow trader sharing his thoughts.

Cup & handle pattern on IOTA chart points upwardsIOTA may have posted a C&H pattern, that could push the price up. So that's something we'll keep an eye on.

IOTAIOTA has been bearish for the past 24-hours. In this period, it has dropped from a high of $0.397 to a low of $0.370. It has made a slight pullback, but still has failed to clear the day’s high of $0.397.
This shows that bears are still in control.

IOTAIOTA climbed back after correcting higher from the recent lows slightly below $0.32. IOTA has tested the resistance at $0.38 several times since the drop during the Christmas period and now it seems to successfully break it. A break above this level now is opening up the road for higher corrections above $0.4.

IOTA double top reversal!?With BTC being still very bearish we might see IOTA going for another bottom via double top reversal. What do you guys think?

IOTUSD (3D): which retracement is possible at iota?normally we could expect a fibu retracement up to 0.5, then that would be a very good buying option. isn' it?
Let's see what happens. Happy trading. :-)

IOTA: Short Term Trade Setup !!Buy after Breakout Succesfully if Breakout Fail then don't trade in IOTA.
You Can Also set Own Risk reward.
Let see what Will be Next Move.
Warning- I m Not a Financial Advisor this idea Only For Educational Purpose Only.
Thank You !!

Next Short term IOTA targetBearish divergence on 4h chart. Volume decreasing. to hit the support line around 31 cents.

IOTA on the riseMany fundamentally strong altcoins have been gaining in double digits since this bullish pump started 3 days ago.
IOTA (MIOTA) happens to be one of the altcoins with the strongest fundamentals, but still hugely underevaluated, despite the partnerships of the project with the leading companies in different industries.
There are chances to see the coin reaching its previous highs in 2019 and maybe even going beyond.
