Iotausdt

IOTA ANALYSIS 😱IOTA starting the ascending trend and now it is the best coin for hold in this market condition , read about IOTA i think wonderful for you .
IOTA have a resistance in 1.5 and it can breakout soon and go up to next resistance in 1.8 and 2 , So for short term you can get 50% profit in spot and in long term about 100% ...!
Buy and hold IOTA , it can fly because it was range in this place when others pumps .
Have a good times guys :)

IOTA is in its most important zone of recent months.we will see a historic breakout for IOTA !
If Bitcoin has a higher correction, the orange scenario will probably come true

IOTAUSDT Analysis (LongTerm)Hello friends.
Please support my work by clicking the LIKE button(If you liked).Thank you!
Everything on the chart.
open pos: market
target: 2 - 2.4 - 2.9
after first target reached move ur stop to breakeven
stop: ~0.95(depending of ur risk). ALWAYS follow ur RM .
risk/reward 1 to 5
Good luck everyone!
Follow me on TRADINGView, if you don't want to miss my next analysis or signals.
It's not financial advice.
Dont Forget, always make your own research before to trade my ideas!
Will be very APPRECIATE FOR UR DONAT/coins :)
Open to your questions or suggestions(Looking for investors!).

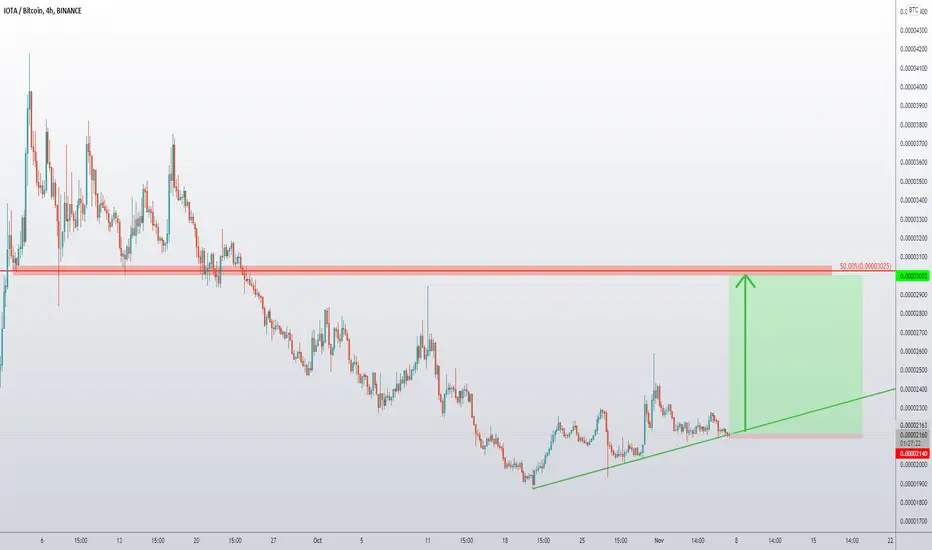
IOTAUSDR - Entry timingBINANCE:IOTAUSDT
4H trend chart
-
IOTA has been consolidating and converging.
Now, it is trying to take out the upper downtrend line, but we shall be aware of fake-out in 4H chart.
If price can break out the downtrend line around here, trading strategy as below.
-
Profit Targets:
a) 1.62----Blue horizontal ray
a) 1.7664---Fib(1)
b) 1.9686~2.0504----Fib(1.272~1.382)
Stop losses:
a) 1.366-----Red horizontal ray
-
If you like this analysis, smash the "like button" and leave a comment below to share your thoughts
or let me know what crypto you want to see!
Trading is a reflection of yourself. Learn more daily and be ready for every opportunity.
Have a nice trading!

IOTAUSDT daily analysisIOTA has been in the accumulation zone for a while and is now ready for a nice bull run.
I believe that it can reach a little higher than its maximum of the last few months, reaching $1.85
Target 1: $1.54
Target 2: $1.70
Target 3: $1.85


IOTA compression is coming to an end 🚀We are probably watching a historic breakout for IOTA !
IOTA can hit it's first target within a few candles.
Like if you Liked :)

IOTA/BTC is just getting started - next coin to be pumpedI love the buy setup for IOTA against the USDT and against the BTC. This goes to show, that the massive uptrend is about to start. Although if the price will produce a new lower low, this setup will be invalidated.
IOTA/USDT Ready for $5 ( 240% ) from here.?#IOTA/USDT TA Update:-
$IOTA currently trading at $1.34
If #IOTA breaks $1.60 then we can sew $IOTA Target $5 (240% )
Entry..?
I am buying some $IOTA here and if break down Support 1 then next Wntry will be $0.8-$0.9
Targets:- $2/$2.5/$4/$5
Stop Loss:- Will update

IOTA/USDT QUICK SCALP TRADE!Hello everyone, if you like the idea, do not forget to support with a like and follow.
IOTA looks good here for quick scalping. It already broke out from the falling wedge and retest is also done. So I'm buying some here and adding more in the dips.
Entry range:- $1.356-$1.366
Target1:- $1.392
Target2:- $1.424
Target3:- $1.462
Target4:- $1.498
SL:- $1.329
Leverage:- 5x
If you like this idea then do support it with like and follow.
Also, share your views in the comment section.
This isn't financial advice. DYOR before investing.
Thank You!

#IOTAUSDT A long position looks good.The price is in its own rising channel at the bottom. so it's good for a long position.
The MACD indicator is on the top of zero, so the price is ready to start up-trend.
Purple line is fibonacci extension Target.🟣
Red lines are support and resistance level.🔴
if you liked it, share it with your friends.
enjoy it.


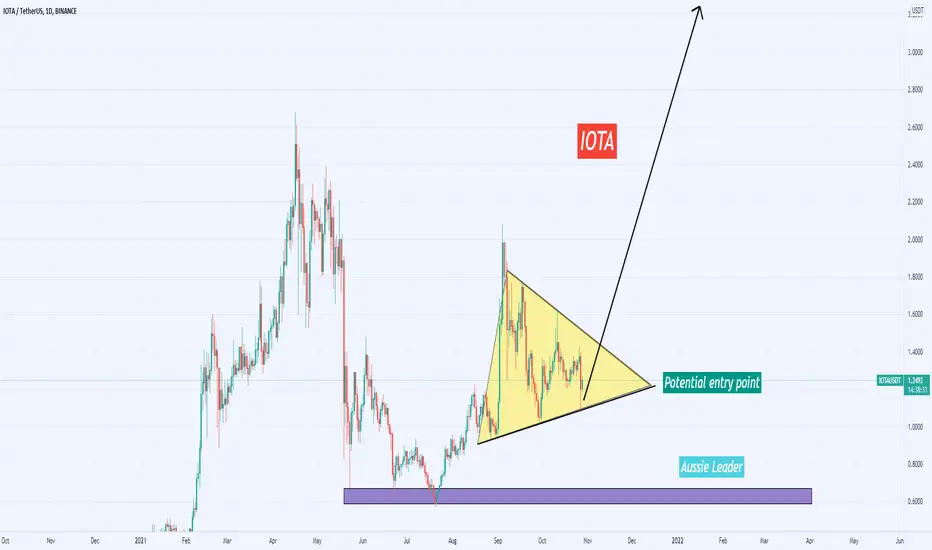
🟡IOTA has formed an ascending Triangle...Hi every One
IOTA / TETHERUS
IOTA has formed an ascending Triangle which has not done a Break out Yet! the Price can Increase as much as the Measured Price movement (AB=CD). there is also a Crab pattern visible on the chart as well ! This Crab pattern is also reliable since the EX Ret=1.618. Now It's time to Reach 2.20$ because The CD line of Crab pattern Ends There! we just need to wait for a Break out to happen.
🔵Summery:
-IOTA is in an ascending Triangle
-(AB=CD)
-Crab pattern is reliable Too (Ex Ret=1.618)
-possible Target at 2.20$!
💎Traders, if you liked this idea or have your opinion on it, write in the comments, We will be glad.
Things can change...
The markets are always changing and even with all these signals, the market changes tend to be strong and fast!!
Thank you for seeing idea .
Have a nice day and Good luck

IOTA/USDT LONG TERM ANALYSISIOTA registered a downward trend after seeing ATH value. However, when we look at the formations that may occur and the general situation of the market, it is predicted that it will move upwards. This situation is presented to you by examining the triangle formation, cup-handle formation and RSI-EMA integrated indicator.

IOTA is next to shoot by over 40%IOTA clearly is showing strong bullish domination, because the price bounced off the support and broke above the downtrend trendline. It is likely that from today-tomorrow there will be a strong and fast rally, potentially taking the price up to 88.6% Fibs. Such a move equals 43.43% growth!

IOTAUSDt trade have potential entry positionIOTAUSDt trade can boost towards 3X target. At this moment, it is showing good entry point to get in. There is strong support around purple bar. Trade will be in the bull trend until it remains above purple bar.
my we have a cub and handle in 7 days timeframewow....after months .... we have a handle for a big cup!...lets to make money....

IOTAUSDT | Long/BuyThe chart show us that correction ABC wave 2 is over and then continues to make impulsive wave 3 which is the longest wave. But if the chart going down to bellow 1.2047 that mean the wave 2 still continues. use 1.2045 level as stop loss.

IOTA USDT Below the red line can be considered as the stop loss zone.
Above the green zone can be considered as entry level.
The depth of the head has not been exceeded yet
We can think of it as Double Head and Shoulders. We can also assume the appearance of a descending wedge that includes them all.
If the formation does not mislead us, you can set the TP targets for yourself. I preferred to put a close stop loss. Maybe it will give more buying opportunities. But you may want to set your own strategy. I just wanted to reveal the chart and patterns.
Note: This is not investment advice.

IOTA MIOTA ready to fly 2.0 - IOTABTC IOTAUSDT IOTAUSDC IOTAUSDIOTA MIOTA Ready to fly 2.0 , must follow Daily Channel , keep SL if breakout daily channel


IOTA 1Diota is looking bullish. ema providing good support MACD bullish. iota can near breakout it can give good gains. NFA
