Iotausdt

IOTAUSDTIOTA
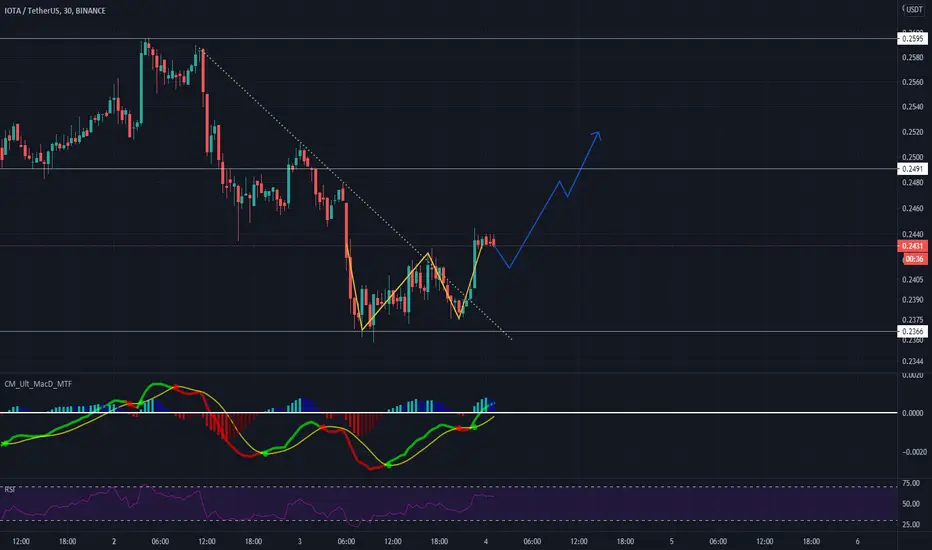
Buying around 0.277 - 0.258
Targets around 0.317 - 0.34
Stop, fixing below 0.247
✅ f you like what I do, put 👍 and subscribe
Waiting for your comment, what do you think about this?

IOTA MIOTA Breakout - IOTABTC IOTAUSDT IOTAUSDC IOTAUSDIOTA MIOTA Breakout - IOTABTC IOTAUSDT IOTAUSDC IOTAUSD

IOTAUSDT: Possible Long (09.11.2020)On D1, the RSI reached the oversold level, after which the price formed an initial upward impulse.
On H1, the RSI also reached the oversold level, indicating the end of the local correction for the first upside impulse. Also, the price found support at the Fibonacci level of 38.2% (mirror level of 61.8%).
We recommend buying IOTA in order to hold the position above $ 0.35.

$IOTA - Clean Wyckoff. Will $BTC ruin the party?Wyckoff Accumulation Pattern. If we head up, and reclaim a 4hr level, game on!
Digital EURO just announced, and IOTA is the most popular altcoin in Germany. Curious.
I'm in, Stops set. Let's go!


IOTA Scalp Short Trade #BinanceFutures Hello Dear Traders,
SHORT IOTA
ENTRY : 0.2850
TARGET: 0.2700
STOPLOSS: 0.2940
Please share your opinion and leave a comment and / or give it a like.
This trading idea has been presented to you by ROHITWORKSS

IOTAUSDTThe market is printing an ascending triangle pattern. Breakout above pattern resistance could be a bullish signal ⬆️.

IOTA vs USDT ---LONG--- 21.10.20Trying swing trade in the frame of ABC correction.
We have possibility IOTA will break the leading 'five' (As BTC did) so will be good idea keep some part of position...

IOTA Price: +70% profit before March 2021?I am not a big fan of IOTA. However, it looks like the coin will make some progress once the market is booming.
Consider putting money into BTC, ETH, XTZ, or BAND first. Then jump into IOTA, the "slowest" horse.

IOTA/BTC (Test Major Support?)💎Technical Analysis Summary💎
BINANCE: IOTABTC
-IOTA is trading on a downtrend channel
-It is approaching the key support area at the 2100s sat
-If we see a reversal or channel breakout
-That's a good entry point with proper stop loss location
-The upside potential is up to 2900s sat or higher
``````````````````````````````````````````````
Trading Involves High Risk
Not Financial Advice
Please Exercise Risk Management
``````````````````````````````````````````````
If You Like My Daily Published Ideas
A little Help By Supporting My Channel
Through Leaving A Thumbs Up, Comment & Follow
Happy Trading! --> Thank You! :)
``````````````````````````````````````````````


IOTAUSDT AnalysisBoth EngineeringRobo and I are bearish about IOTA at the moment.
IF you are holding IOTA, you should likely sell right away.
If you are interested in buying:
- Waiting for EngineeringRobo buy signals
- Watching the MA200 closely, and having open/close confirmation above the MA200 line
- Buy at support level 0.147
After you buy, watch closely for EngineeringRobo sell signals! If you want to use EngineeringRobo, DM me!


IOTA/BTC (Strong Bounce @ Golden Fib?)BINANCE: IOTABTC
-Strong bounce at major support area around 2500 sat
-This zone is a confluence of golden Fib level and 200D MA
-If the daily candle closes back above the trendline support
-There is a chance IOTA to test the 3100 sat potential new resistance
-Still very high risk, Bitcoin should stabilize for Altcoins to recover faster
-Please exercise proper risk management in this time of sell-off
**If you like my daily Published Ideas
**Please don't forget to leave a thumbs up & comment
**Thank you! :)

IOTA vs USDT ---SHORT---26.08.20#IOTAUSDT
Type: SHORT
Sell at: 0.37 - 0.36
Size: 3%
Target:
1) 0.30
2) 0.28
3) 0.25
SL: above 0.41

IOTA (MIOTA) - September 2Hello?
Dear traders, nice to meet you.
"Like" is a huge force for me.
By "following" you can always get new information quickly.
Thank you for always supporting me.
-------------------------------------------------- -----
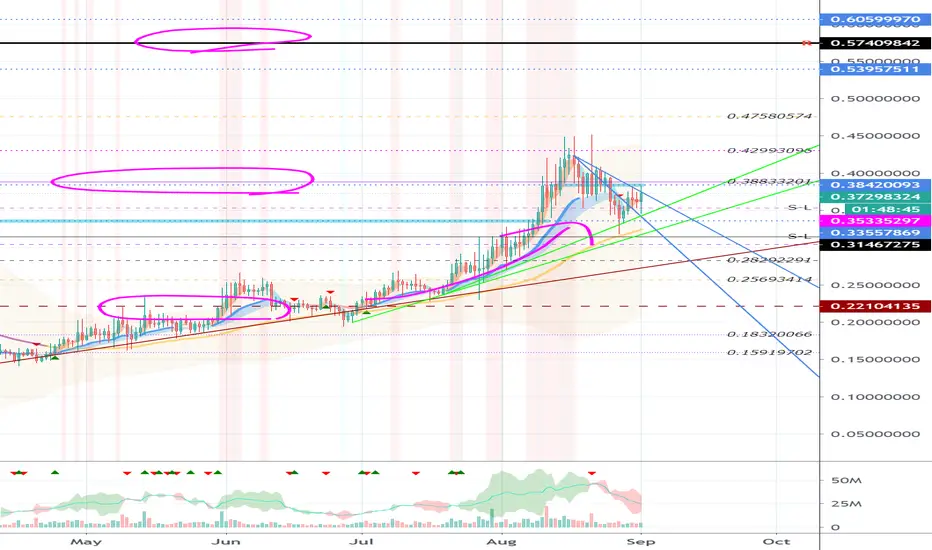
We must see if we can ascend above the 0.38833201 point.
You should also check if you can get off the downtrend line.
It remains to be seen which of the two uptrend lines will rise.
To get out of the low range, we have to see if we can ascend above 0.57409842.
--------------------------------------------------
The volatility period I mentioned yesterday seems to have changed due to the gap in USDT dominance.
Volatility was expected around September 4 (September 3-5) as seen in the XBTUSD chart, but this also appears to have changed.
However, I think it is necessary to carefully check the BTC price flow.
-------------------------------------------------- -------------------------------------------
** Check support, resistance, and abbreviation points.
** Support or resistance is based on the closing price of the 1D chart.
** All explanations are for reference only and do not guarantee profit or loss on investment.
Explanation of abbreviations displayed on the chart
R: A point or section of resistance that requires a response to preserve profits
S-L: Stop-Loss point or section
S: A point or segment that can be bought for generating profit as a support point or segment
(Short-term Stop Loss can be said to be a point where profits and losses can be preserved or additionally entered through installment trading. You must trade from a short-term investment perspective.)
IOTA (MIOTA) - August 26Hello?
Dear traders, nice to meet you.
"Like" is a huge force for me.
By "following" you can always get new information quickly.
Thank you for always supporting me.
-------------------------------------------------- -----
We must see if we can ascend above the 0.38833201 point.
You also need to make sure you can get support at point 0.35335297.
If it falls at the point of 0.35335297, I think it is necessary to trade in installments to preserve profit and loss.
-------------------------------------------------- -------------------------------------------
** Check support, resistance, and abbreviation points.
** Support or resistance is based on the closing price of the 1D chart.
** All explanations are for reference only and do not guarantee profit or loss on investment.
Explanation of abbreviations displayed on the chart
R: A point or section of resistance that requires a response to preserve profits
S-L: Stop-Loss point or section
S: A point or segment that can be bought for generating profit as a support point or segment
(Short-term Stop Loss can be said to be a point where profits and losses can be preserved or additionally entered through installment trading. You must trade from a short-term investment perspective.)

IOTAUSDT AnalysisPeople who bought IOTA by listening EngineeringRobo's BUY2 signal in the first week of July, enjoy your 59.91% PROFIT that you made less than 2 month!
There's also green cloud present as a buy signal.
If you are holding IOTA, do not hurry to sell since there are no sell signals present. You can sell when there's a sell signal from EngineeringRobo or you can sell when the candle open close below the support level (0.26) for 1D. Also, if you want, you can take profit at the resistance level (0.49).
As of now, if you want to buy IOTA, since there are 2 buy signals present & the risk-reward ratio is higher than 1, you can buy right now.
After you buy, please watch out for EngineeringRobo's SELL signals to not lose your profit or your money!


