IOTAUSD formed bullish Cypher | A good long opportunityPriceline of IOTA / US Dollar has formed a bullish Cypher pattern and entered in potential reversal zone.
This PRZ area should be used as stop loss.
I have used Fibonacci sequence to set the targets:
Buy between: 0.2695 to 0.2682
Sell between: 0.2705 to 0.2730
Regards,
Atif Akbar (moon333)
Iotausdt

IOTAUSD formed bullish BAT | A good long opportunityPriceline of IOTA / Tether US , US Dollar cryptocurrency has formed a bullish BAT pattern and entered in potential reversal zone to hit the sell targets soon insha Allah.
This PRZ area should be used as stop loss in case of complete candle stick closes below this zone.
Volume profile is showing less interest of traders at the PRZ level.
MACD is strong bearish and Stochastic is in bear cross so for secure trade we should wait for MACD to turn weak bearish or for stochastic to give bull cross then buy from the potential reversal zone.
I have used Fibonacci sequence to set the targets:
Buy between: 0.2739 to 0.2700
Sell between: 0.2751 to 0.2801
Regards,
Atif Akbar (moon333)

IOTAUSDT forming bullish Shark | A buying opportunity aheadPriceline of MIOTA / Tether US is forming bullish Shark pattern and soon it will be entered in potential reversal zone insha Allah.
This PRZ area should be used as stop loss in case of complete candle stick closes below this zone.
Volume profile is showing less interest of traders at PRZ level but MACD is strong bearish and Stochastic is in bear cross so for secure trade we can wait for MACD to turn weak bearish or for stochastic to give bull cross then buy.
I have used Fibonacci sequence to set the targets:
Buy between: 0.2657 to 0.2607
Sell between: 0.2707 to 0.2814

IOTA - Bullish Neckline Breakout, 25% Gain IncomingIOTA has completed an inverse head and shoulders pattern on its daily chart and is on its way upward. Bullish daily MACD and RSI, I'll be looking around the .00004-42 level as my target. Price is finding some resistance, so we may have a minor pullback before moving higher.

IOTAUSD FORMED A BULLISH SHARK | A GOOD LONG OPPORTUNITYPriceline of IOTA / US Dollar cryptocurrency has formed a bullish Shark pattern and entered in potential reversal zone.
This PRZ area should be used as stop loss point in case of complete candle stick closes below this area.
I have used Fibonacci sequence to set the targets:
Buy between: 0.2694 to 0.2667
Sell between: 0.2726 to 0.2788
Regards,
Atif Akbar (moon333)

$IOTA : waiting for a breakout or for a pullbackWaiting for :
-1) Pullback to range and support line (orange line)
-2) Breaking Out the Downtrend Line (yellow)
Not a Financial Advice

IOTAUSD is forming bullish BAT | Another good long opportunityOn short term 1 hr chart after forming a bullish BAT pattern priceline of XRP / US Dollar is forming another bullish BAT pattern , sofar all legs are driven as required for BAT therefore I am expecting the last leg will be retraced between 0.786 to 0.886 fibonacci and soon it will be entered in potential reversal zone insha Allah.
This PRZ area should be used as stop loss point in case of complete candle stick closes below this zone.
I have used Fibonacci sequence to set the targets:
Buy between: 0.2545 to 0.2478
Sell between: 0.2562 to 0.2651
Regards,
Atif Akbar (moon333)

IOTAUSDT has formed bullish Shark | Utpo 38% possibilityAfter forming a bullish Shark the priceline of IOTA/ Tether US has formed another bullish Shark pattern and entered in potential reversal zone to hit the sell targets insha Allah.
This PRZ area should be used as stop loss point in case of complete candle stick closes below this zone.
Sofar the price action has just hit the spike in PRZ area but MACD and stochastic are strong bearish therefore I am expecting that the price action will give another chance to catch it from potential reversal zone.
Volume profile is showing less interest of traders here, but Stochastic did not give bull cross and MACD is strong bearish so for secure trade we can wait for MACD to turn weak bearish or for stochastic to give bull cross then buy.
I have used Fibonacci sequence to set the targets:
Buy between: 0.2368 to 0.2152
Sell between: 0.2555 to 0.2980
Regards,
Atif Akbar (moon333)

IOTAUSDExpect a pullback to the area of 0.28 usd with further consolidation of the price and a shot up to the zone of 0.38 usd

IOTAUSD formed a bullish Shark pattern|Upto 123% potential tradeAfter completion of gartley pattern the priceline of IOTA / US Dollar cryptocurrency has formed a bullish Shark pattern and entered in potential reversal zone to hit the sell targets soon insha Allah.
This PRZ area can be used as stop loss in case a complete candle stick closes below this area
Volume profile of complete pattern is showing less interest of traders at this area.
MACD is turning bullish
Stochastic is oversold but did not give bull cross.
I have used Fibonacci sequence to set the targets:
Buy between: 0.2612 to 0.2052
Sell between: 0.3288 to 0.4595
Enjoy your profits and regards,
Atif Akbar (moon333)

IOTAUSDT formed bullish gartley | a good long oppottunityPriceline of IOTA / US Dollar is forming differing harmonic pattern continuously after forming 2 sharks now it has completed the formation of gartley pattern and entered in potential reversal zone.
I have defined the targets using Fibonacci sequence:
Buy between: 0.2433 to 0.2385
Sell between: 0.2471 to 0.2562
Regards,
Atif Akbar (moon333)

IOTA USD formed bullish BAT | Upto 81% potential trading ideaPriceline of IOTA USD cryptocurrency has formed a bullish BAT and entered in potential reversal zone even giving a spike beyond the PRZ area and touching the lower band of bollinger bands 1st time since after April 2019.
Stochastic entered in oversold 1st time since after Feb 2019.
I am expecting the next candle stick will be closed sideways or within the PRZ area rather than closing below the PRZ so we can wait for next candle stick whether it will breakdown the PRZ support or will move up back into this zone.
I have used Fibonacci sequence for targets definition.
Buy between: 0.3036 to 0.2716
Sell between: 0.3797 to 0.4939
Regards,
Atif Akbar (moon333)


$IOTA - Time to accumulate.We're either on the brink of an Alt Season with BTC.D capping out at the 200MA weekly, or we're about to start creating a trading range. (or just another bearish retest before dropping lower - trade what is, not what you want it to be.)
Trading Range Entries/Exits:
Lowest Red Range = TP1
Highest Red Range = TP2
Lowest Green Range = Accumulate in/above.
Stop loss below current lowest low by 3%.
Trade current trend:
Acquire: 2280 - 2300
Targets:
2350 > 2388 > 2470 > 2510 > 2572
Stop loss: 2235


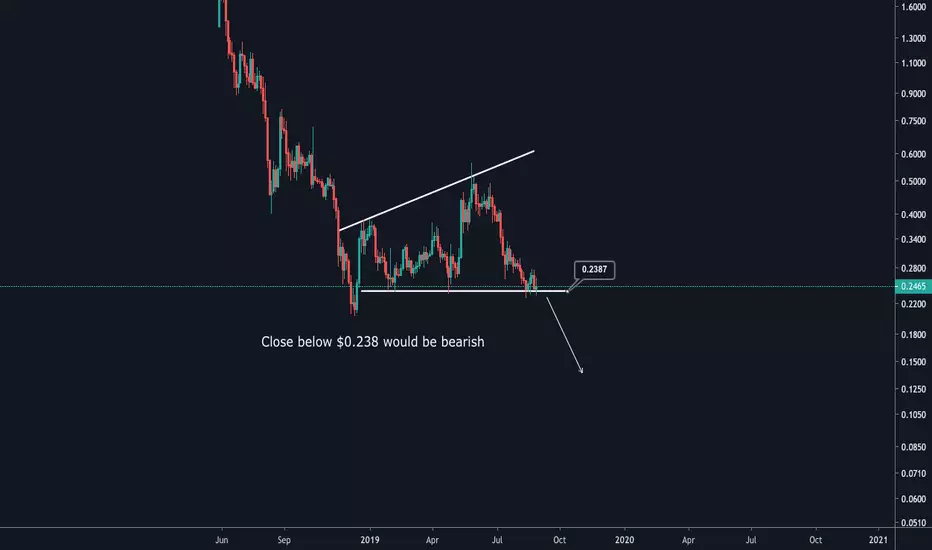
IOTUSD has completed the bullish setup | Upto 1052% profitThe IOTUSD was moving within a descending triangle and left the triangle without breakout or breakdown.
Since july 2017 the price action has found a strong support of $0.2051 and this support is not broken sofar.
The bollinger bands is extreme squeeze which is an indication of a massive move up or down soon.
MACD gave weak bull signals since sep 2018 and now it is strong bullish since aptil 2019.
After the death cross of jun 2018 the 10SMA is making golden cross with 20SMA and both moving averages has crossed down the priceline as well to lift the price action up insha Allah.
The sell targets are:
1st target: $2.26
2nd target: $2.90
3rd target: $3.72
Final targets;$ 4.68
Regards,
Atif Akbar (moon333)


IOTA Will Go UP 30,28% !IOTA/USDT Analysis
Are you ready to make money guys ? ;-)
Don't forget the position sizing !
NB : I share informations in a neutral way, I don't offer any investment advice on specific currencies, or initial offers, and does not encourage anyone to enter what may appear to be investment advice, and then completely disclaims any liability for any investment decision made by the reader.

IOSTUSDT Update Excatly hit Buy zoneI hope you all are watching IOSTUSDT
my previous chart Click Me
It's in green zone you can Buy IOSTUSDT here
BTC is sideways for now so ALTS will Pump.
buy zone is in the chart
target is 0.50$
#ATLS #BITCOIN #ALTSEASON #BITCOIN

Binance, IOTAUSDT, Estimate ZonesBuy On:
Bearish: 0.3106 - 0.3258 - 03365,
Demand: 0.3754-0.3948,
Reversal: 0.4035-0.4232,
Sell On: 0.4893-0.5050

IOTAUSDT Trade Setup don't miss This TimeIOTAUSDT
many large cap coin pumped with btc stable and after binance maintainance
first buy zone : 0.36$ -0.37$ with stop loss $ 0.35% must
second buy zone : 0.33$ -0.34$ with stop loss $ 0.31% must in very worst scenario (manipulation).
Target Both : $.50 usd
Time : 15 - 25 days
Follow for more Updates

(IOTA/USDT) does iota have enough gas to make a wave 3 the chart says it all more of an observation pre-call. if we can hit a wave 3 RSI is extremely high but, we could have some gas left in the tank wait and see happy trading.
