IOTAUSDT Total books: $5,401,176.74 (+1.18%)
Global Bids: $2,386,933.45 (-3.87%)
Global Asks: $3,014,243.29 (+5.19%)
Iotausdt

IOTA - Under The Empty VoidAfter the pump caused by the news of IOTA's partnership with Jaguar Land Rover, it had since then fully retraced and fallen back down. This is highly bearish as it shows a lack of follow through and continuation from the bulls. IOTA/BTC pairing is currently showing a very decent risk to reward for bears as a breach of the recent low, which is also the all time low, will cause intense fear and a bunch of stop-loss cascade. There is no support left for IOTA, it's just a matter of when the support breaks. I believe this is a great gamble given the high r/r ratio here for shorts.

$IOTA Bull Pennant and TargetBull Pennant on the $IOTA 4hr chart with $USDT pair.
Target is the length of the flagpole from the breakout, to heavy resistance above.
Target: 0.36 - 0.37
#JaguarLandRover

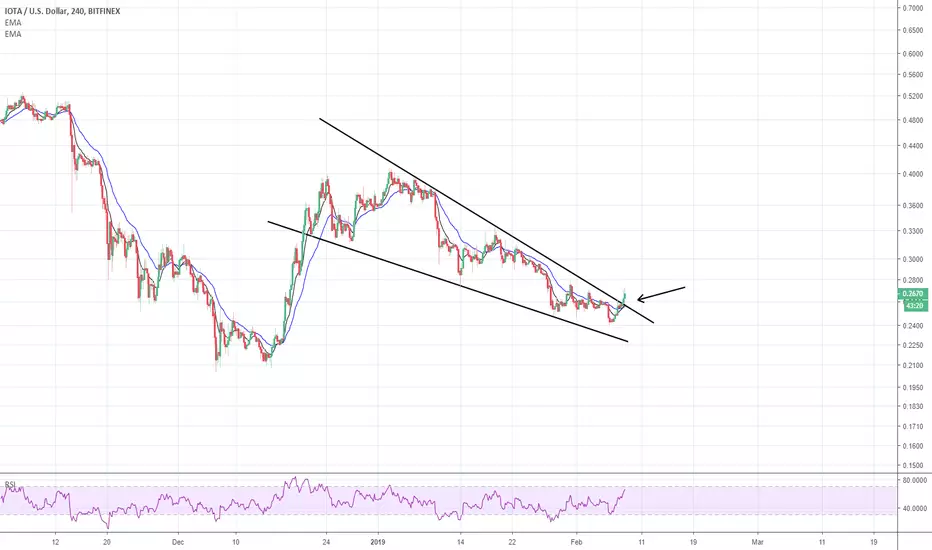
Iota,forgotten hero.Iota is slowly grinding to touch the daily 200 ema.It has been consolidating for a long time and is ready to burst.Once it breakes 0.42 it is free to move upwards.
But the rsi is also in shallow waters so be carefull- It might drop further.
Resistance 0.4~0.42$
Buy now with a SL at 0.28$

IOTA TA (Daily chart) [02 April 2019]EW
- Primary : in wave 3
- Intermediate : wave 3 ending (if not one more wave up)
Buy at retracement to 0.382-0.618 fib level
- $0.295 - $0.320
Target 1.618 fib extension, previous resistance and support
- $0.407

IOTA/USD - 1H Buy the retest of breakout IOTA broke out of a large corrective structure, currently correcting that move and making the final C wave in this correction.
Look for buys on the retest for upside.


IOTA - Hopium, Hopium, and Hopium...IOTA is looking slightly bullish on the daily timeframe as it is about to break out of the triangle. Not to mention, bulls did an amazing job defending the daily MACD cross right at the zero mark.
On the weekly timeframe, we can see the RSI making a potential inverse head and shoulders pattern. Similar to every inverse head and shoulders pattern, we must wait for the break of neckline resistance as confirmation.
Using a variety of synthetic currency pairs, we can compare the strength/weakness between IOTA and other cryptocurrencies. In this example, we will use synthetic pair IOTUSD/NEOUSD which simplifies into IOT/NEO.
There's a very visible bearish divergence in MACD, RSI, and Stochastic. There's a possibility that money from algo traders that are trading synthetic currency pairs may go into IOTA due to its temporary weakness against other cryptocurrencies. But keep in mind, this is simply a method to compare the strength/weakness between two highly correlated asset. USD value of IOTA does not necessarily have to go up in order for IOT/NEO to go down.
Using IOT/ETH pairing, we could see that we're approaching a long term support trendline with a double bottom starting to form. This further supports my point in IOT/NEO: IOTA should theoretically gain strength compared to other cryptocurrencies in the coming days or weeks.
Just like every single double bottom, a retest of the neckline is necessary. The neckline support must hold or else it would indicate that IOTA is still too weak.
Feel free to share your long-term bearish ideas, it's always good to know both sides.


IOTA LongI see a bull run soon. Is a very similar consultation as with bitcoin. A triangle is forming that points upwards. Let's see :)

IOTA/USDT forms the Triangle PatternIn the time frame D1, IOTA/USDT goes sideway and forms the Triangle Pattern, characteristic of complex waves according to Elliott wave
Targets at the connections forming the upper support line of the triangle
Buy at $0.2990 - $0.3010
Target 1: $0.3300
Target 2: $0.3900
Stoploss: $0.4400
Risk / Rewark Ratio Tp1 = 2.26
Risk / Rewark Ratio Tp2 = 6.78
Risk / Rewark Ratio Tp2 = 10.41
** If you like our content follow our profile (www.tradingview.com) to get more daily ideas. **
Comments and likes are greatly appreciated.

IOTAUSDT small uptrend channel 5% profitYou just need to follow the channel to get your entries and exits.

IOTAUSD - 1D Chart AnalysisAs with Ethereum, the price of Iota has followed the same pattern with 3 different occasions :
1. The price increase which was registered on the 15th of December has been announced by the MACD's crossover on the 10th, the RSI's level of 48 registered with one day before and confirmed by the Stochastic with it's "fast" line coming above the "slow" one on the 16th.
As a result we could see a price increase which lasted 26 days (out of which 23 were of bullish trend) and a total growth of 0.1616$ or almost 75%.
2. On the 10th of January, when the price went below the 20 days Moving Average and when the bearish trend has officially started, the RSI had a neutral position at 44, signaling that there were small chances to see an aggressive movement after the big drop in the same day.
On the other hand, the ones which have announced the trend change were the Stochastic, which has registered a crossover on the 4th of January and the MACD which went below the Signal on the 9th.
As a result, we could see how the price has dropped and we can consider this period more like one in which the price has slowed down, as long as the daily average movement was constantly low for this sector.
3. The last was the price increase which we could see on Friday, the 8th of February.
In this scenario, the change in the price direction has been announced first by the RSI, which had the level of 30 and by the Stochastic's crossover registered on the 6th. This movement has been confirmed on the second day by the MACD as well, with it's Signal positioning on the bottom.
Today, these 3 indicators are in contradiction, as it follows :
* The RSI has a neutral position, at the level of 46, meaning that there is no "impulse" coming soon;
* The Stochastic is about to register a crossover, meaning that a possible price decrease may start anytime soon
* The MACD is still above the Signal, meaning that the bullish trend which has just started is not over yet.
As we can see, the technical indicators are showing different directions, more like on the 16th of December, but if the trading volumes will remain at least constant, it is possible to see the price of Iota setting a new height around the level of 0.31$ for the upcoming days.

IOTAUSDT Double bottom or lowerI don't expect many people to agree with me on this but I do think we are going for double bottom or worse. Ultimately, it will depend on BTC.

Trading plan IOTUSD 2.14.2019After the candlestick fixation of the model "flag" abroad, buy with a target of 0.032.

IOTA BreakoutIOTA broke out of this falling wedge pattern this morning, I am expecting more upside to come!
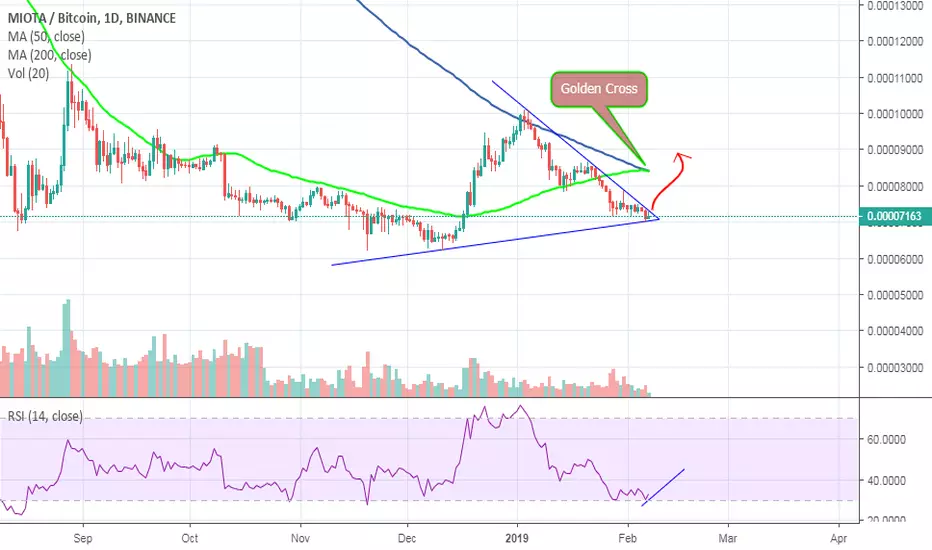
IOTA Chart Analysis Hello everyone hope you are doing good
In this Chart we can see some bullish moment in IOTA
RSI :- Oversold
also we have golden cross
price is bottomed already
hope it will work and price will be up soon
IOTAUSD - 1D Chart Analysis
The end of the year has represented a good period for Iota, with it's price increasing from 0.2506$ on the 17th of December to 0.3726$ on the 10th of January, registering a total growth of 48.63%.
Although the odds were looking favorable, the coin was pressured afterwards by the drop of the market capitalization, with the investors being concerned more about the stock market earnings season.
In other words, once the bearish trend on a 1D chart was settled on the 10th of January, we could see a period in which the price evolution was slow and inconsistent, followed by 6 consecutive days of losses (including today) caused mainly by the very low trading volumes.
And even if the RSI and the Stochastic are close to their "oversold" levels, the MACD is still below the Signal, meaning that it's possible that the price to slow down for a couple of days and then to drop again.
Considering also that in the following days we'll have companies like Apple, Pfizer, Verizon and other big names coming up with their financial results, it's possible for the total market capitalization to continue it's negative rally and also for the price of Iota to go towards 0.2050$.
The save up may come from the FED if it will take a surprising decision on Wednesday, but the chances are fairly small.

IOTA seems in a dire but yet can be in an optimistic uptrendand love this tweet too: www.zerohedge.com

IOTUSD (3D): which retracement is possible at iota?normally we could expect a fibu retracement up to 0.5, then that would be a very good buying option. isn' it?
Let's see what happens. Happy trading. :-)

IOTA: Short Term Trade Setup !!Buy after Breakout Succesfully if Breakout Fail then don't trade in IOTA.
You Can Also set Own Risk reward.
Let see what Will be Next Move.
Warning- I m Not a Financial Advisor this idea Only For Educational Purpose Only.
Thank You !!
