Monthly support!IOTA has seen little buying power over the past week, which has caused the currency to break its monthly support in the $0.226-$0.260 range. Now this area has become a serious resistance. Also, the support that was considered in the range of 0.195 to 0.180 dollars has been associated with a positive reaction. Considering the low volume of transactions, we cannot expect an upward trend yet.
The price of this currency can have a range trend for some time between the specified levels. Also, the range is completely clear in the 4-hour time frame of this trend. Therefore, the price should return above the $0.26 level for the trend to be bullish again. The nearest minor resistance is in the range of $0.237-$0.247, and hitting this range could be accompanied by a reaction. As you can see, the bearish trend is going on inside a bearish channel, and to get bullish, it is necessary to break the channel's midline and the mentioned resistances.
Iotausdt

$IOTA Trendline Broken in 1D TFI think $IOTA is ready to move up since the trendline in 1D TF is confirmed to be broken, current support at $0.23 - $0.24 is expected to be revisited before the higher move up.

MIOTA shortMIOTA broke trough the support level. Asset broke trough the ascending trendline. Bearish movement to support level at 0.245 is possible.

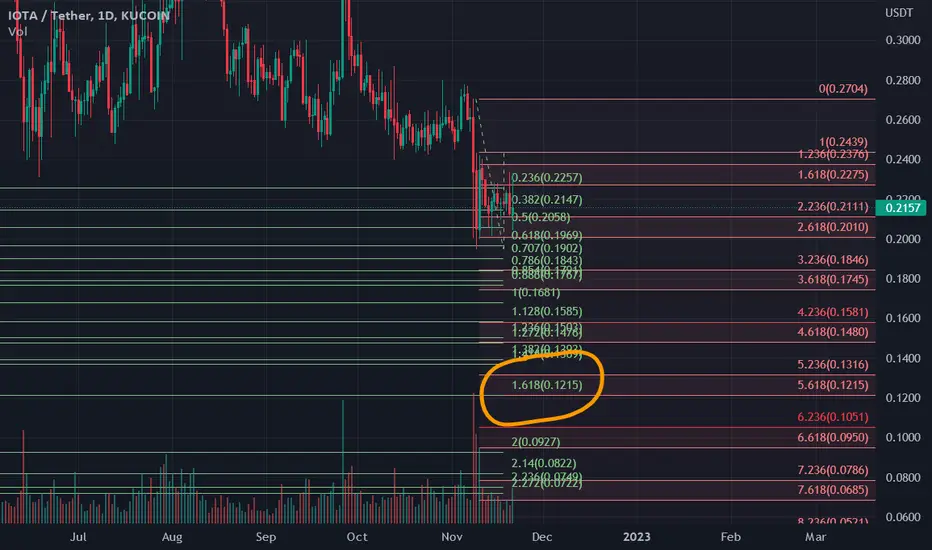
IOTA ANALYSIS#IOTA UPDATE.
#IOTA has lost the trend line support on macro level but on micro level IOTA has broken above the falling wedge but in order to move upwards IOTA needs to clear the "area of confluence" which is acting as the strong resistance

IOTAUSDTHello Crypto Lovers,
Mars Signals team wishes you high profits.
This is a one-day-time frame analysis for IOTAUSDT
Here we have R2 as a resistance area which represents that the price was not able to rise at several points. R1 used to be a support area and S1 used to be another resistance line. Therefore, we have the price fluctuating bellow R1 area and we expect it to fall to S1 (as it used to do in its past behavior) and we should wait for some rising signs in order to have an increase for the price toward R2. In case the price is not supported at S1, more fall is there for it.
Warning: This is just a suggestion and we do not guarantee profits. We advise you to analyze the chart before opening any positions.
Wish you luck

IOTA CAN MAKE A CORRECTIONThe entry point is red box. I think that after seeing this range, this symbol will undergo a sharp correction

IOTAUSDT breakout with target 0.2670Look for the breakout 0.2740 BUY STOP MARKET entry and hold the long 0.2670

OTAUSDT |Does this look like a reversal?Hello trader Today I prepared a new idea for you. Like and subscribe to the channel there is a lot of useful information✅
Friends, I want to say a little about the IOTA coin, I think this coin in the long term can look good in your investment portfolio.
As long as we see a small reversal on the weekly chart, the price starts to move out of the monthly flat trend a little, there is a chance that this will be a global reversal!
The idea is only suitable for spot trading

Iota Analysis ;IOTA/USDT Update 📈📉HEY, what's up today ?!
Since 26 Mar 2021,that I posted the last analysis for Iota , It has been declining till now ,
where that I exactly told you guys ;iota is compressing in a kind of symmetrical triangle
pattern,also there are some EMA cross under signals,so there is a possibility of falling ! =====>>>. ( More than 70% 1x short )💰🤑
So today as you see on the Weekly timeframe for IOTA/USDT again , after a massive drop recently reached the demand zone , in this week it was able to record a pretty good candle on the local support zone , and already had a positive MOM divergence ,now it can start an uptrend ,it can reach the higher resistance levels and likewise to fill higher VG (Volume gap ) or test higher key zones OR even test VWAP line , but likely will get rejected at the higher resistance zones . ! but otherwise if losses the current support zone it can continue its consolidation phase through DEMAND zone for longer time !
✌️ Good luck with your trading and investing and remember: Trade smart…OR JUST DON’T TRADE!
--------------------------------------------------------------------------------------------------------------------
👉This analysis is my personal opinion ,not a financial advice ,so do your own research.
💜 if you're fan of my analyses please follow me , give a big thumbs 👍 OR drop a comment 🗯

Safe zone to Buy IOTAUSDTHello guys 😃
Before we start to discuss, I would be glad if you share your opinion on this post's comment section and hit the like button if you enjoyed it!
everything is clear, you can see the support zone and target zones
I hope we make it like that.
I hope you enjoyed my analysis, You can support me with your likes and comments! (always open to hearing points from the others)
Attention: this isn't financial advice I'm just trying to share my vision and remember we must always see what's up with BTC after that go buy altcoins. never forget investment principles and do your research before investing.

IOTAUSDT Analysis (LOCAL VISION)Hello friends.
Please support my work by clicking the LIKE button👍(If you liked). Also i will appreciate for ur activity. Thank you!
Everything on the chart.
Entry: market and lower
Target: 0.36 - 0.4 - 0.44 and maybe even ~0.49
after first target reached move ur stop to breakeven
Stop: ~0.26 (depending of ur risk). ALWAYS follow ur RM .
Risk/Reward: 1 to 5
risk is justified
Good luck everyone!
Follow me on TRADINGView, if you don't want to miss my next analysis or signals.
It's not financial advice.
Dont Forget, always make your own research before to trade my ideas!
Open to any questions and suggestions.


IOTA - Trap slams shut🪤Reasons to take short:
⭐️ BTC bearish
⭐️ Level is 8 days long
⭐️ Trendline is clean
⭐️ Trapped bulls
⭐️ In the end of formation
⭐️ Price is squeezing to local level
⭐️ 3rd touch
⭐️ 40 ATR
⭐️ Under VWAP
Will enter when price squeezes to the trendline on 5m timeframe, the base will form and the tape will get faster.
If you don't understand the previous sentence, just use swing stop-loss 3-5%
Fix profit by parts:
1% - 1/3
2% - 1/3, stoploss to breakeven
What's left, hold to the maximum
What do you think of this idea? What is your opinion? Share it in the comments📄🖌
If you like the idea, please give it a like. This is the best "Thank you!" for the author 😊
P.S. Always do your own analysis before a trade. Put a stop loss. Fix profit in parts. Withdraw profits in fiat and reward yourself and your loved ones

IOTAUSDT BEARISHIOTA formed a double top pattern on the daily timeframe the neckline is broken and retested successfully
now we look for short opportunities and our target would be the lines in red


IOTA formed big bullish Gartley for upto 851% rallyHi dear friends, hope you are well and welcome to the new update on IOTA (MIOTA) coin.
On a monthly time frame, IOTA has formed a huge bullish Gartley pattern.
Note: Above idea is for educational purpose only. It is advised to diversify and strictly follow the stop loss, and don't get stuck with trade

IOTAUSDT Analysis (LOCAL VISION)Hello friends.
Please support my work by clicking the LIKE button👍(If you liked). Also i will appreciate for ur activity. Thank you!
Everything on the chart.
Entry: market and lower
Target zone: 0.45 - 0.5$
after first target reached move ur stop to breakeven
Stop: ~0.27 (depending of ur risk). ALWAYS follow ur RM .
Risk/Reward: 1 to 3
risk is justified
Good luck everyone!
Follow me on TRADINGView, if you don't want to miss my next analysis or signals.
It's not financial advice.
Dont Forget, always make your own research before to trade my ideas!
Open to any questions and suggestions.

IOTA shortIOTA bounced off the descending trendline. Asset bounced off the resistance level. Bearish movement to support level at 0.3085 is expected to happen.

MIOTA (IOTA) Buy ZoneMIOTA (IOTA) Buy Zone
--------------------
BIAS
Mid-Term : Bullish
Risk : High
On 4 hours timeframe we can see out that the MIOTA formed out the bullish pattern and retest long-term mini zone is at the its potential reversal zone level .
--------------------
$IOTA/USDT LONG SETUP
Leverage : x3 - x5
Entry Price : 0.4925 - 0.479
TP 1 : 0.51
TP 2 : 0.525
TP 3 : 0.5444
TP 4 : 0.5577
TP 5 : 0.5789
TP 6 : 0.597
TP 7 : 0.625
TP 8 : 0.6596
Stop Loss : 0.45
*Maximum 3% of Portfolio.
*Unload 12.5% at each TP. Whenever TP 2 hits, Move stop loss to entry.
--------------------

iota looking good hereiota looking like its found support here
accumalating iota while we are down here
could see a nice move up soon

IOTA USDT Just a bit more...I like the fact that de demand zone works really well with the geometry and after the next swing low I'm expecting to change the structure and create a strong swing low there.
