✳️IoTeX/BTC (20-10) #IOTX $IOTX #IOTXBTC50-55sts is the start point of the last rally of IOTX and now we can see a quick pump on it. So this zone is quite good for us to buy in.
Targets should be 65sts and 80sts, these levels are very important and these levels refused IOTX in October, so it will get some selling pressure in these levels.
The lower support is 45-46sts that we will trust in.
IOTXBTC

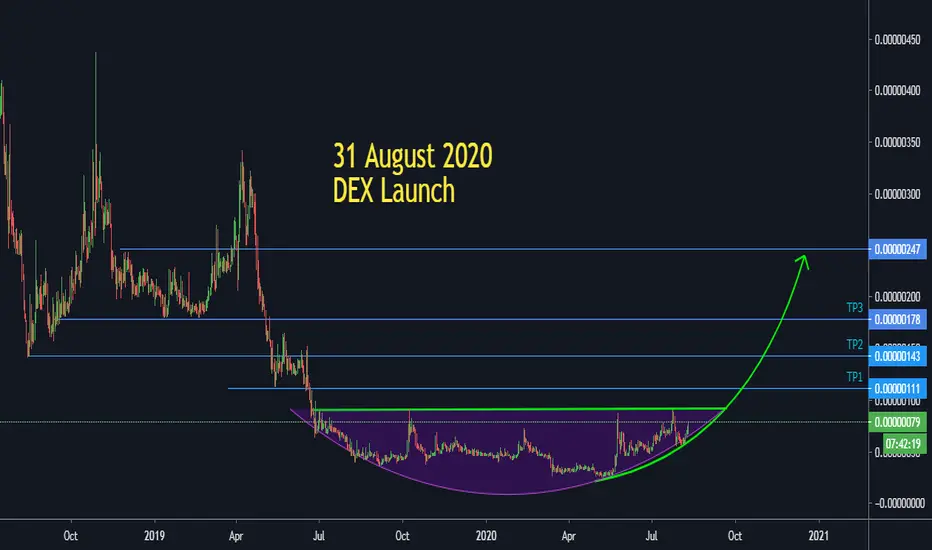
IOTX/BTC (Weekly Key Level Support)💎Technical Analysis Summary💎
BINANCE: IOTXBTC
-IOTX is now trading at key level of support on the weekly chart
-There is sign of Bullish reation on this key area
-So technically, it is not yet a good buy signal
-Once the candle weekly candle closes
-Zoom in on the 1 day chart and wait for any reversal signs
-With this, you can reduce the risk and have a perfect entry point
A big Thanks for donating 💰 via Tradingview coins this week to billstenzel 🙏🎉
``````````````````````````````````````````````
Trading Involves High Risk ⚠️
Not Financial Advice 💸
Please Exercise Risk Management 💱
``````````````````````````````````````````````
Thank You All!🙏😊💖For Supporting My Channel 📺
Through Leaving A Thumbs Up, Comment & Follow 💬
Happy Trading!😊💕💖
``````````````````````````````````````````````

IOTXBTCIt's on the lowest support level which mean perfect BUY opportunity. Altho I wouldn't suggest to trade it on leverage but you could go on margin with careful stop-loss setting.
Cheers!!

IOTXBTCThis coin has been in accumulation period for so long and now it seems ready to go ballistic!
The bigger patterns shows a hemisphere which the candles like to french kiss every once in a while.
You could potentially look for a buy in two steps: the black and then the red continuous , stop loss at daily candle close below the green line.
This TA is for mid- to long term positions, I'll put another analysis for short term scalp trades.
CHEERS.
Disclaimer: Always do your research before any trade! These are only my perspective!!!

IoTex (IOTX) Bullish Beak! [UPDATE]I am really happy to see IoTex (IOTXBTC) deciding to break bullish since I bought another bag just recently... It is always fun to see prices move shortly after buying.
Here is the same chart drawing shared on the 2nd of July.
Pretty clear, very simple... All the targets are clearly marked.
IOTXBTC Chart Analysis/Signals
We have prices moving above all the MAs/EMAs on low volume...
Since the cycle is bullish, the low volume can be taken as a continuation signal, meaning that we can see additional growth.
Closing daily above 74 satoshis (0.00000074), would signal additional strength and tells us that our next target is getting close.
Let's see how it goes, we are aiming for a higher high on this new wave.
This is not financial advice.
This chart analysis is not meant for you to trade.
Remember to do your own research and have your own plan/strategy before you trade.
Namaste.
---
Previous chart | July 2
IoTeX (IOTX) Prints Strong Consolidation

Here I buy IoTeX and IOTX will go upHere I buy IoTeX and IoTeX will go up. The price is testing the major resistance, so now I load my bags and the bullish breakout will start. And IoTeX will go up. See you up there

$IOTX, Crossing over ~90 sats level w/ potential R/S flip $IOTX
Crossing over ~90 sats level w/ potential R/S flip on the 12H...
Also DEX coming on the following days that could drive some traction..
Aim for an entry at support level w/ a proper SL just in case...
#IOTX


IOTX Long Potential in Short TermSWING TRADING STRATEGY
IOTX is in the good bullish channel, it just the beginning of bullish but i will share you about swing trading strategy using 1 Day Timeframe in this analysis
The target is mapped using violet lines
Target 1 : 86
Target 2 : 103
Don't forget the stop loss below 70

IOTX/BTC (Key Support @ 50 sat?)IOTX/BTC
-After hitting the 91 sat range, the price has now fallen over -38% its value
-If I'm looking for Buy swing point entry, Key areas are very important
-The level needs to be watching is the 50 sat range, why?
-Because is a confluence of multiple factors
-We have the previous support and resistance level
-200D MA as dynamic support and also the golden Fib ratio .618
-This will be a high probability Buy setup
-Provided the market (Bitcoin) condition will be in your favor
-Trade wisely, and please always have a concrete plan before execution


$IOTX, Flipped ~64sats level into support...$IOTX
Flipped ~64sats level into support and its trying to gain traction again aiming for ~90/110/140 sats as targets
UCTS remaining bullish at HTFs after some accumulation over this level..
Aim for entry as low as possible and keep some alerts to see how it evolves!
#IOTX

IOTXUSDT⚠️✅⚠️ Breakout Incoming, pay attention!💬 IoTeX (IOTX) looks like it is gearing up to break resistance. Let's analyze this bad boy of blockchain and Chainlink partnerships to see if the bulls can break on through or if the bears will end the glory here.
Hit that 👍 button to show support for the content!
Help the community grow by giving us a follow 🐣
-----
Support:
S1: The first support level is the S1 orderblock. Anything more than a quick wick down to here breaks our current bullish structure of higher lows. So even though there is support here, it should be viewed cautiously.
S2: The S2 S/R flip is a logical place to find support. The momentum of the current move would be lost here, but that doesn't mean this support can't or won't hold.
S3: If needed there is also the S3 orderblock range. Anything below this changes our overall bullish outlook on IOTX.
Resistance:
R1: The R1 orderblock at the previous swing high is our first point of resistance. We'll be looking for this to act as support once broken.
R2: The R2 high from the initial move up back in May is the last point of resistance. What the bulls will want to see is a move up to R2, support found at R1, and then a push higher through the Multi-timeframe resistance noted below.
Daily Multi-Timeframe:
There is a major price pivot point that is currently acting as resistance. It is the potential to break this and for the USDT pair to make new highs that has us excited. Let's go bulls!
BTC 4h Multi-Timeframe:
You can see that the current daily USDT range is also significant on the 4h for the BTC pair. While there is a rather large range here to consider, this chart illustrates what we are looking for. We want to see an ABC move above this resistance, with a retest of it, before moving higher.
-----
Summary:
This play is all about breaking resistance with the current momentum, so a retest of lower ranges is pretty far outside the scope of what we are looking for. We want to see a run now, do you think we'll get it?
Resources:
cryptobriefing.com
✨ Drop a comment asking for an update, we do NEW setups every day! ✨

IOTX looking BEARISH1. MACD histogram showing the bearish divergence.
2.Also the the candle are touching the weekly resistance level. They are going to retrace from there and going to test the daily support at 69. and it breaks 69 we may test 58 daily zone.
3.IOTX has to find a strong support in order to continue the upward trend.
4. Candles have reached the upper layer of Bollinger band, it also indicates the bearish or retracement from here.
5. Volume has also been exhausted which is an indication for bearish movement.

IOTXBTC - Extremely bullish 50%+IOTXBTC
Trade opportunity we've been waiting a month for
Entry: 72 sats
Target: 120 sats
Would net 50% Profit

IOTX trading idea. Hello, traders.
We are forming an ascending triangle on smaller time-frames on IOTX, but we are close to an important resistance level.
The ideal is that it breaks the resistance and pullback this new support. That's where we should buy more safely with a definite stop point.
But this asset is very bullish, let's keep an eye on it!
Best regards.
Sandro and Gustavo.
Push the like button and follow us on TradingView.

IOTXBTC | Above 300D EMA [112%]BINANCE:IOTXBTC breaking above the 300D EMA, and also a symmetrical flag break out are the signs that the currency is likely to go higher. According to the previous levels, the coin is likely to give a 112% returns.
Thank you for reading, hope you have a good day!!!


IoTeX (IOTX) Prints Strong ConsolidationIoTex (IOTXBTC) is looking good.
After the recent bullish breakout, which took place in late May, we have a retrace with no strength.
No strength on the retrace is good for the bulls.
We are having strong consolidation and prices trading above EMA10 and all the major EMAs that are shown on this chart... What this means is that IOTXBTC can easily move up .
The RSI is ultra-strong and the MACD is showing a bullish cross... IOTXCBTC can easily resume its uptrend and continue to grow.
Conditions for change
If prices move below MA200 (0.00000044), this analysis is invalidated and a new one is needed.
Thanks a lot for your support.
Namaste.

IOTX DAY TRADE BREAKOUTIOTX has Breakout From a nice Triangle.. i am expecting a breakout move from it..targeting 75 SATS

IOTXBTC | Descending Triangle | Apex | Trade Setup Todays chart – IOTXBTC – testing resistance of the descending triangle formation as it nears the apex.
Points to consider:
- support and resistances converging (apex)
- Trend bearish (consecutive lower highs)
- Bullish Price action (testing resistance)
- Support confluence
- RSI above 50
- Low volume
IOTX has formed a mature descending triangle (typically considered a bearish formation) however price action is showing strength with multiple breakout attempts as it nears the apex.
Structural support and the 200 EMA being in confluence puts a strong emphasis on the level being a strong support zone.
RSI trading above 50 showing strength in the market supporting the bullish bias.
The volume is clearly declining, an indication that an influx is imminent coinciding with the probable breakout
Overall, in my opinion, IOTX needs to break and retest structural resistance with volume follow through for a valid long trade to structural resistance.
What are your thoughts? Let me know in the comments below!
Be sure to leave a like and follow me for daily chart updates.
As always, focus on you - and the money will too!
