IOUSDT Reversal SignalBINANCE:IOUSDT has broken out of a falling wedge on the 4H chart, signaling a potential trend reversal.
The price is trading above both the 50 EMA and 100 EMA, indicating growing bullish momentum.
A successful retest of the breakout zone could lead to a sharp move toward the $0.85–$1.10 level.
Resistance 1: $0.88
Resistance 2: $1.10
Stop Loss: $0.655
Iousdtperp

IOUSDT: Inverse Head & Shoulders Breakout – The Reversal is RealBINANCE:IOUSDT has just completed a textbook Inverse Head and Shoulders pattern, one of the most reliable reversal setups in technical analysis. After a prolonged downtrend that left the asset oversold and undervalued, the market has begun to shift. We’ve now seen a clean breakout above the neckline and a healthy retracement back to it. A classic confirmation signal that often precedes strong bullish moves.
This shift is further supported by the emergence of higher highs and higher lows on the smaller timeframes, suggesting that bullish momentum is building. With the downtrend now exhausted, BINANCE:IOUSDT looks poised to begin a new uptrend that could offer solid upside potential for early entrants.
As always, risk management is key. While the pattern setup is strong, it’s crucial to place stop losses just below the right shoulder or neckline to protect against unexpected volatility. The market doesn’t offer guarantees, but this setup offers high-probability conditions worth paying attention to.
BINANCE:IOUSDT Currently trading at $0.98
Buy level : Above $0.95
Stop loss : Below $0.76
Target : $2.65
Max leverage 3x
Always keep stop loss
Follow Our Tradingview Account for More Technical Analysis Updates, | Like, Share and Comment Your thoughts

$IO Bullish Structure Intact – Watching for $1.20+SEED_ALEXDRAYM_SHORTINTEREST2:IO broke the neckline and converted it into a support
This clean inverse setup came together beautifully. Price is currently sitting above $0.98 and poised to start the next up leg.
If we do get a healthy pullback to the neckline, that's the area to monitor for strong continuation to $1.20+.
The structure is super bullish.
Eyes on it 👀

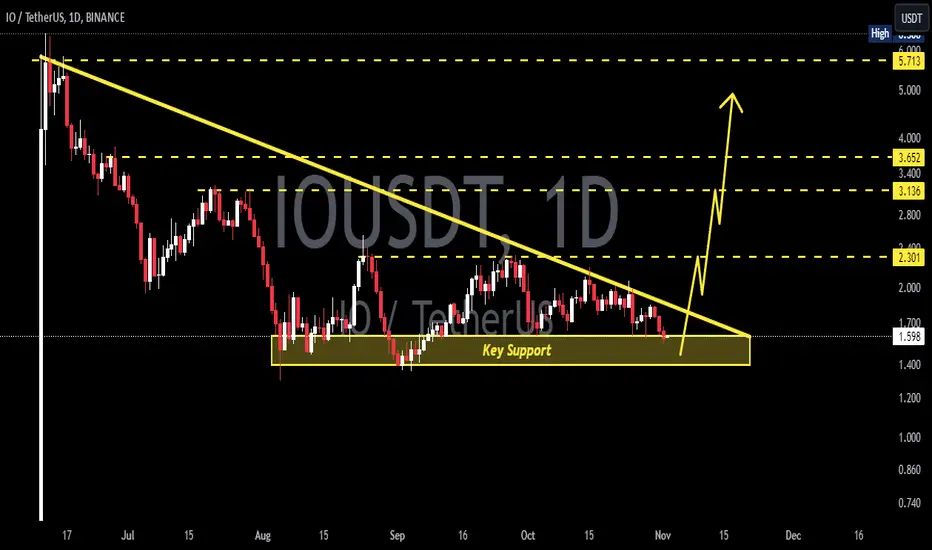
IOUSDT 1D Analysis IO ~ 1D Analysis
#IO Buy after successfully breaking this resistance line with a short term target of at least 15%+ from here.

#IOUSDT remains under strong selling pressure📉 SHORT BYBIT:IOUSDT.P from $1.235
🛡 Stop Loss: $1.258
⏱ 1H Timeframe
✅ Overview:
➡️ BYBIT:IOUSDT.P continues its downward movement, trading near the $1.235 level, which acts as a potential breakdown zone.
➡️ The highest liquidity area (POC) is at $1.41, significantly above the current price, indicating strong seller dominance.
➡️ The price has broken a key support level, confirming the bearish trend.
➡️ If the price consolidates below $1.235, further declines to target levels are expected.
⚡ Plan:
➡️ Enter short below $1.235 upon confirmation of bearish momentum.
➡️ Risk management through Stop-Loss at $1.258 to protect against sudden reversals.
🎯 TP Targets:
💎 TP1: $1.210
🔥 TP2: $1.185
🚀 BYBIT:IOUSDT.P remains under strong selling pressure, and a breakdown below $1.235 could accelerate the downward move.

IOUSDT 1WIO Update ~ 1W
#IO So far it still maintains its bullish structure. Price is currently retesting this support block,. Buy in stages with a minimum target of 20%+
IOUSDTO ~ 1D
#IO So far this support block continues to keep the price from falling lower. If you still have Conviction on this coin. You can buy on this support block with a short term target of at least 15%+
IOUSDTIO ~ 1D
#IO If you have Conviction on this coin, you can make purchases in stages from here. it is only a matter of time until this resistance line is successfully broken.

IOUSDTIO ~ 1D
#IO If you have Conviction on this Coin. You can make purchases gradually after successfully breaking through this resistance line.

IOUSDT - A Prime Opportunity for Long Term Gains.After a significant correction, IOUSDT is making efforts to reclaim its previous major support level. This is often a positive sign, indicating that the market may be stabilizing and setting the stage for a potential upward move.
IOUSDT is part of a significant GPU project, which adds to its appeal and long-term potential.For those looking to invest, this could be an opportunity to buy IOUSDT and hold it for the long term. Given the project’s potential and current market conditions, long-term holding may yield substantial returns
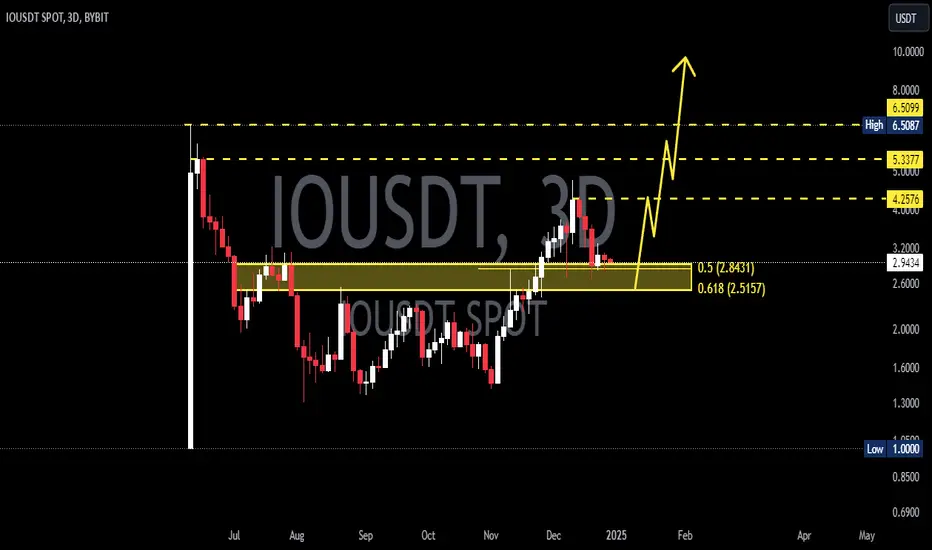
IOUSDT (1D Chart) Technical analysis
IOUSDT (1D Chart) Currently trading at $3.4
Buy level: Above $3.5 (Buy after breakout)
Stop loss: Below $3
TP1: $3.8
TP2: $4.3
TP3: $5.5
TP4: $6.5
Max Leverage 3x
Always keep Stop loss
Follow Our Tradingview Account for More Technical Analysis Updates, | Like, Share and Comment Your thoughts
