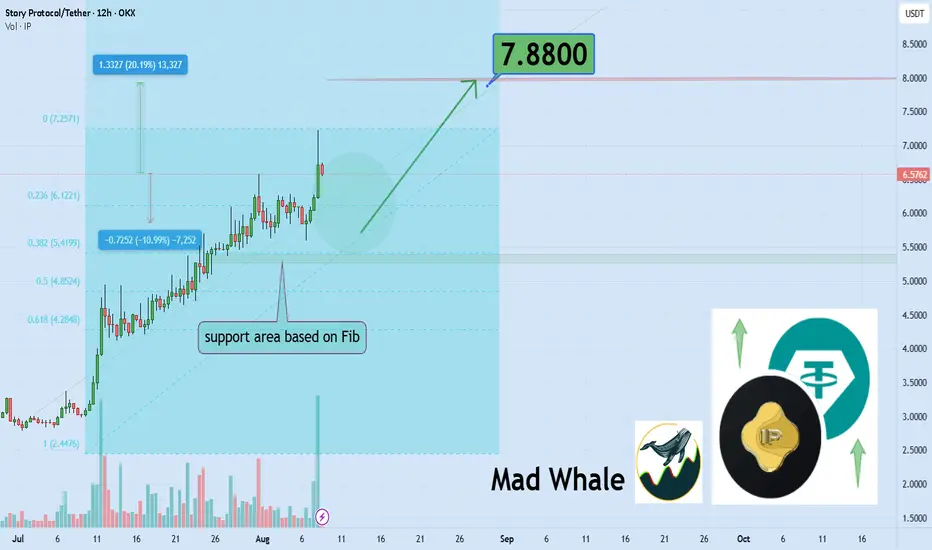
Story Protocol Holds Strong, Targeting Explosive 20% Rally to $7Hello✌️
Let’s analyze Story Protocol’s price action both technically and fundamentally 📈.
🔍Fundamental analysis:
Story is working on tokenizing real-world data for AI, teaming up with big projects to tap into the $80T IP market. But on-chain activity is still low, so hype could fade if adoption is slow.🤖
📊Technical analysis:
OKX:IPUSDT has held its ground and respected key Fibonacci supports during the latest market pullback 📉. Backed by strong fundamentals and steady bullish momentum, I anticipate a 20% move toward the 7.88 target 🚀.
✨We put love into every post!
Your support inspires us 💛 Drop a comment we’d love to hear from you! Thanks, Mad Whale
IPUSDT
Breaking: Story Coin ($IP) Tanked 14% Today The price of Story coin ( NYSE:IP ) has recently dipped 14% for the past 24 hours but recent price action indicates build up momentum to reclaim loss grounds.
Story coin ( NYSE:IP ) a Layer 1 (L1) blockchain designed to serve as the foundation for intellectual property (IP) on the internet. It enables creators to register, license, and monetize their IP assets seamlessly. By leveraging blockchain technology, Story provides a transparent and efficient framework for IP attribution, licensing, and commercialization.
Technical Outlook
As of the time of writing, NYSE:IP is up 1.27%. the asset is trying to bounced off of the support point with momentum building as hinted by the RSI at 47, NYSE:IP is getting ready for a breakout to the 38.2% fib level.
Story Price Live Data
The live Story price today is $3.88 USD with a 24-hour trading volume of $118,805,575 USD. Story is down 7.65% in the last 24 hours. The current CoinMarketCap ranking is #62, with a live market cap of $1,040,840,390 USD. It has a circulating supply of 268,456,342 IP coins and the max. supply is not available.

IP ANALYSIS🔮 #IP Analysis 💰💰
🌟🚀 As we can see that #IP is trading in a symmetrical triangle and there was a breakdown of the pattern. Last time there was a bullish move from the same support level. We can expect again a bullish momentum from its major support level🚀🚀
🔖 Current Price: $4.190
⏳ Target Price: $5.500
#IP #Cryptocurrency #DYOR

IP/USDT: BREAKOUT ALERT!!🚀 Hey Traders! IP Breakout Alert – 80% Move on the Horizon? 👀🔥
If you’re pumped for this setup, smash that 👍 and hit Follow for premium trade ideas that actually deliver! 💹🔥
🔥 IP/USDT – Massive Breakout in Play! 🚀
IP is breaking out from a triangle on the 4H timeframe and looks primed for a 70-80% upside move. This setup has huge potential, making it a must-watch trade. 💥
💰 Trade Setup:
📍 Entry: $6.10 – $6.35
🎯 Targets: $6.96 / $7.84 / $8.92 / $11.2 📈
🛑 Stop-Loss: $5.78
⚡ Leverage: Use low lev (Max 5x)
🔎 Strategy:
✅ Enter with low leverage now
✅ Add more on dips and ride the breakout momentum 🚀
💬 What’s Your Take?
Are you bullish on IP’s breakout potential? Share your targets, analysis, and predictions in the comments! Let’s crush it and lock in those gains! 💰🔥🚀

IP – Coiled Triangle with a $10 STORY to Tell?COINBASE:IPUSD / COINBASE:IPUSDC
We’ve got a clean symmetrical triangle forming post-initial listing volatility, and price is nearing the apex. Volume’s dropping off, just like you'd expect in the final stages of compression—classic pre-breakout behavior.
What caught my eye here is how this triangle lines up with a Fibonacci extension target up near $10. Yeah, sounds bold, but zoom out on a log chart and it actually looks pretty reasonable. The measured move from the initial impulse, paired with the triangle breakout structure, gives a clear path to that 1.618 extension level. Throw in the fact that the volume profile starts thinning out above $6, and there’s potential for a swift move if it catches a bid.
Triangle Compression and Breakout Setup
We’re in the late innings of this triangle consolidation. Lower highs, higher lows, volume fading—textbook stuff. If price can get through the $6 zone with conviction, the structure says we could see an aggressive breakout. If not, we’re probably looking at one more fakeout or shakeout before direction resolves.
Fibonacci Extension and Log Chart Math
Using Fib extensions on a log scale paints a pretty compelling picture. $10 sits right at the 161.8% extension off the initial run, and log charts smooth out the scale enough to show how that level isn’t just hopium—it’s structured speculation. The triangle adds context: this isn’t about chasing highs, it’s about waiting for the breakout confirmation from a pattern that’s been compressing for weeks.
Volume Profile and Context
VPVR shows strong acceptance around $5 and fading resistance above. If bulls can flip that region into support, the path to higher prices opens up fast. A breakout from this triangle above $6.25 or so, ideally on volume, could be the signal that this thing is ready to move.
Curious if anyone else is watching this chart. We’ve got a clear triangle, confluence with Fib levels, and log-scale structure supporting a much higher target. Could be a breakout worth watching—or just another consolidation that needs more time to cook.
Not financial advice. Just tracking setups, patterns, and potential. Let’s see if the STORY plays out.

IP Looks Bullish (4H)Note: This chart carries its own specific risks. Proper risk management, leverage control, and stop-loss are essential.
It appears that IP is in a bullish dual structure and currently in the second ABC pattern. More precisely, it is in Wave B of this ABC, which is forming a triangle. Currently, we are at Wave E, the final part of the triangle.
If the demand zone holds, the price may move toward the targets.
The closure of a daily candle below the invalidation level will invalidate this analysis.
For risk management, please don't forget stop loss and capital management
Comment if you have any questions
Thank You

Story IP price analysisDespite the terrible Feb of 2025 for the crypto market in general, there is a ray of hope for the coins that have just been launched.
#IP - #KAITO - #PI, what connects these coins? After the listing, the price makes a slight correction and starts to grow steadily, rather than falling below the -70-80% floor, as it has been the case with almost all new coins in the last 6-12 months.
As for the OKX:IPUSDT price, a correction to $5-5.10 is completely acceptable now, it is not necessary and impossible to go lower to continue growth.
Just hypothetically, how much would you be willing to sell your #Story #IP coins for?
$9, $11, $15, or maybe $20 or even $29?
_____________________
Did you like our analysis? Leave a comment, like, and follow to get more

#IPUSDT – Long Setup, Testing Resistance ZoneLONG BYBIT:IPUSDT.P from $7.0000
🛡 Stop Loss: $6.6900
⏱ 1H Timeframe
✅ Market Analysis:
📍 The BYBIT:IPUSDT.P price is showing strong upward momentum, breaking key resistance levels.
📍 The asset has held above the $6.8982 level, which may confirm a continuation of the uptrend.
📍 POC (Point of Control) at $4.8742 – the highest volume area, previously serving as a consolidation point.
🎯 TP Targets:
💎 TP 1: $7.3100
🔥 TP 2: $7.6200
⚡ TP 3: $7.8600
📢 Holding above $6.8982 could confirm trend strength.
📢 A dip toward $6.6900 (stop loss) could be a fakeout – monitoring price action is crucial.
📢 The $7.3100 level is the first TP, where a retracement may occur before further upside.
📢 If the price breaks $7.6200, the move toward $7.8600 becomes more likely.
🚀 BYBIT:IPUSDT.P is showing strength – monitoring the $7.0000 breakout and securing profits as the price moves up.

Ready to Skyrocket? Story/USDT at Key Level!The chart shows a strong uptrend, respecting an ascending trendline with three confirmed touches (1, 2, and 3). The price is currently testing a minor resistance zone, which has previously acted as a rejection point.
At this moment, the price is near the trendline for a potential fourth retest (marked as "4?"). If the trendline holds, it could act as a springboard for another upward move, potentially breaking the minor resistance and continuing the bullish trend.

Bitcoin and altcoin overview (February 20-21)Yesterday with Bitcoin we broke through the $96,000 level and reached the zone of maximum volume concentration during the sideways market. The buying volume is rather weak, and there isn’t an obvious dominance of either side yet.
At the moment, it is most likely that we will test the upper boundary of the maximum volume zone at $98,000 and then correct again. Globally, we still expect a full resumption of buying.
An alternative scenario is a strong volume breakout above $98,000—in this case, we consider going long during local corrections.
Sell zone:
$107,000–$109,000 (volume anomalies).
Buy zones:
~$95,000 (sell absorption),
$89,000–$86,300 (accumulated volumes).
Interesting altcoins:
For IPUSDT, we are considering a continuation of the long from the zone $2.8–$2.61 if there is a reaction.
For AMBUSDT , a serious potential for a reversal has formed, with a huge number of volume anomalies being released, above which we are currently consolidating. If the zone $0.16–$0.15 is tested and reacts, we open a long. An alternative scenario would be opening a long on a false breakout of the local minimum.
