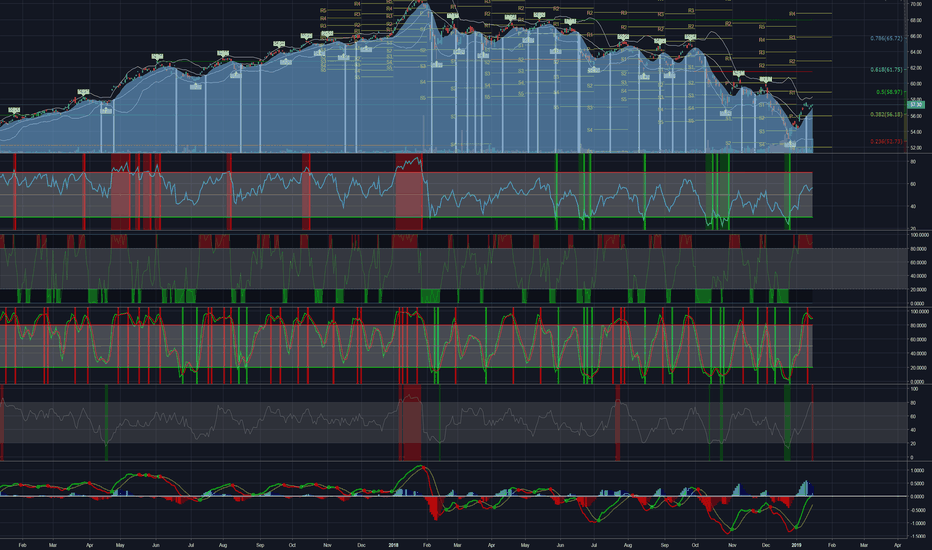
Ishares
MSCI emerging markets Similar past, veryYou do not have to be a genius to see the huge similitures of the past charts of the emerging markets msci of exactly 10 years ago¡ , specifically in 2008, where you can clearly see an upturn in investment in these markets msci very, very strong up, reaching a summit to explosion and crach donw , it can practically be seen as a carbon copy 10 years later the same pattern almost yes,
well You may not remember it , but exactly 10 years ago it was the resection in North America.
Well coincidences, possibly.
but without a doubt the Charts are very similar to those of the past.
float listFLOT Ishares Floating Rate Bond Etf 0.16% 0.32% 50.89 50.38 0.00% 50.84 Buy Strong Buy 50.85 768.111K
DRIP Direxion Daily S&p Oil Services Bear 3x Shares 43.89% -9.72% 54.75 10.28 -0.99% 17.92 Buy Strong Buy 19.08 779.961K
CHKP Check Point Software Tech Ltd 6.54% 32.90% 104.64 74.34 0.30% 103.05 Buy Strong Buy 103.41 1.036M
EL Lauder Estee Cos Inc 9.05% -1.87% 97.48 75.30 -0.91% 85.37 Sell Buy 85.18 1.502M
EWU Ishares Msci United Kingdom Etf 4.05% 6.58% 33.13 27.60 0.03% 32.44 Sell Buy 32.37 1.577M
ERY Direxion Daily Energy Bear 3x Shares 23.63% -3.99% 21.50 8.59 0.08% 11.84 Buy Strong Buy 12.41 1.809M
SPLV Powershares S&p 500 Low Volatility Portfolio 5.01% 7.46% 44.01 39.61 0.05% 43.52 Buy Strong Buy 43.61 1.873M
KCG Kcg Hldgs Inc 44.37% 29.00% 19.78 11.74 -0.15% 18.29 Buy Strong Buy 19.75 2.66M
CYTK Cytokinetics Inc 27.83% 46.49% 14.35 7.18 4.78% 12.76 Buy Strong Buy 14.25 6.551M
P


