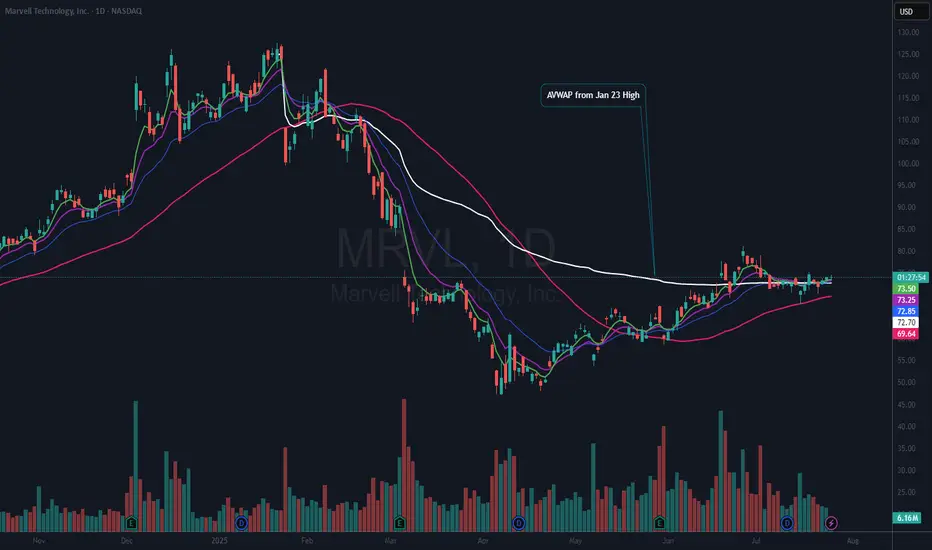
$MRVL Nice Risk Reward HereNASDAQ:MRVL is still basing so this could be quite an early trade. However, I did put on a ½ size position yesterday as it rose above the 21 EMA (blue). I like that it is over the AVWAP from the Jan 23rd all-time high (ATH). That means that by price and volume the majority of stockholders are at or near breakeven since that ATH. Which also tells me that there are not many sellers left and that the stock has a chance of entering a stage 2 uptrend.
My current stop will be based on a solid close below the 50 DMA (red). I want to add to my position “if” we can get a good follow-thru day above $75.26.
If you like this idea, please make it your own and follow “your” trading rules. Remember, it is your money at risk.
IWM
$SNOW Bull Flag?NYSE:SNOW has been and still may be one of the leaders in this market. It is forming a Bull Flag and within that flag is a nice wedging formation.
I am bullish with this name, so I have an alert set on the upper downtrend line. Should it break that, I will look for a good risk reward entry to open a position. It is possible if the market pulls back, that NYSE:SNOW could continue down to test the 50 DMA (red). All TBD.
If you like this idea, please make it your own and follow your trading plan. Remember, it is your money at risk.
In addition, Nvidia NASDAQ:NVDA and Snowflake NYSE:SNOW were among the investors that backed artificial intelligence company Reka's $110 million funding round, Reka said Tuesday.
Reka said the investment will accelerate its technical development efforts and will also scale its multimodal platforms.
The investment boosts the startup's valuation to more than $1 billion from the previous $300 million in a 2023 funding round, Bloomberg reported Tuesday.

Bitcoin, SPX, Ethereum, Tesla: Whats Next? BTC appears to be showing distribution signs.
I do believe BTC local top is in, but alt coins like Ethereum can still push a bit higher.
Ethereum short around 3900-4000 looks promising
Tesla fell sharply on the back of cash flow burn and expenditures.
Investors are also fearful of sales decline and loss of EV credits.
SPX hit major long term resistance today. Coupling this with a depressed Vix we are likely setting up for a pullback in the market.
Small caps saw distribution today on the back of rising yields. A failed breakout observed on IWM chart.

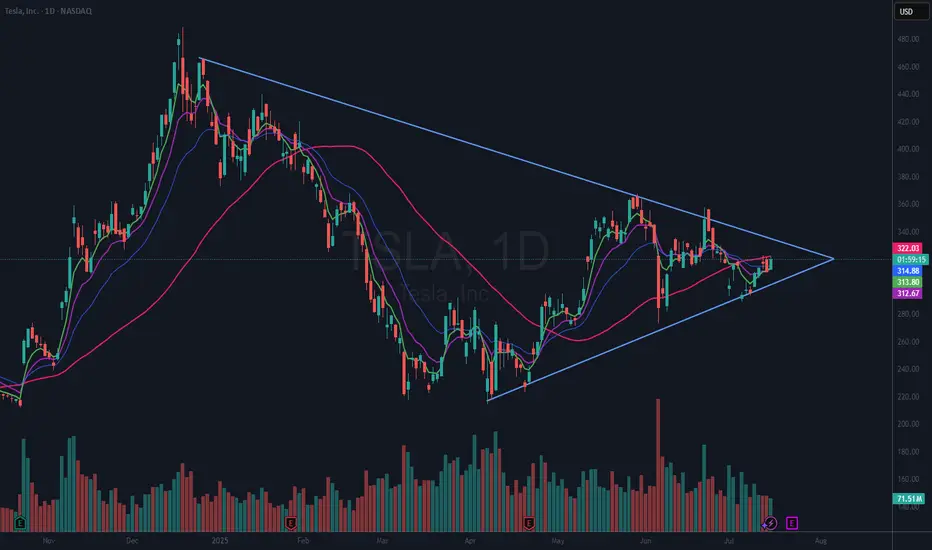
$TSLA Giant Wedging Pattern (VCP)NASDAQ:TSLA is in a giant 7 month wedging pattern. It can be seen as a VCP (Volatility Contraction Pattern) as well. These types of patterns can break either way. However, in this case we have a rising 50 DMA (red). That suggests to me that this will break to the upside.
I already have a small position in TSLA and I will look to add if or when it breaks above the 50 DMA and again if or when it breaks above the upper downtrend line. If it breaks the lower line, I am out.
Be aware that Tesla reports earnings in 7 days, Wednesday, July 23rd, after the bell.
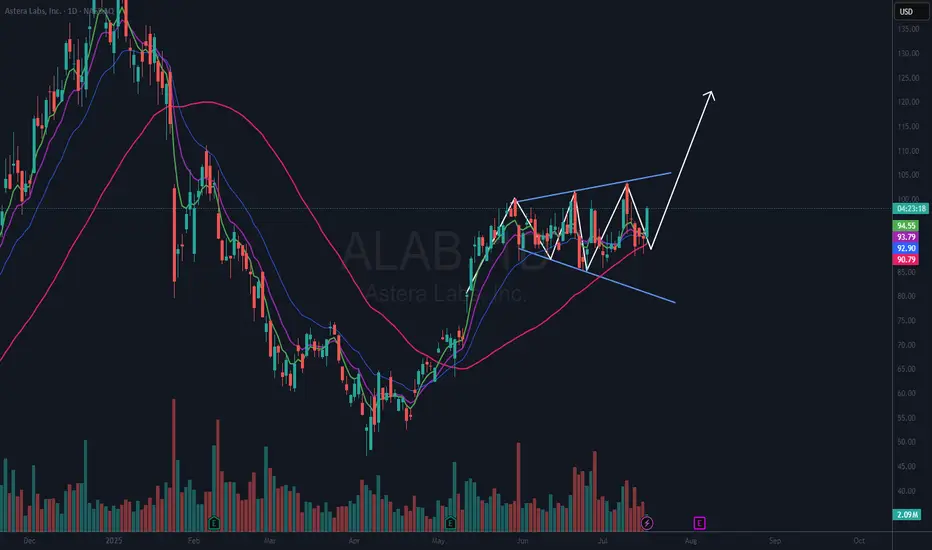
$ALAB Forming a Megaphone PatternNASDAQ:ALAB has seen a lot of volatility as of late. I took a position in it and was stopped out for a loss due to that volatility.
I may be too fixated on this name, but I want to get involved as I think it has a chance to run to previous highs. I thought it had formed a cup with handle pattern, and I got involved on Wed. June 18th only to get stopped on Monday, Jun 23rd. I have been watching it since.
Now it appears it is forming a megaphone pattern. These patterns usually resolve in the direction of the last trend. In this case that trend was up. I like too that the 50 DMA (red) is in an uptrend. I have an alert set on the upper trendline resistance area. Should that trigger, I will look for a good risk reward entry.
If you like this idea, please make it your own and follow your trading plan. Remember, it is your money at risk.
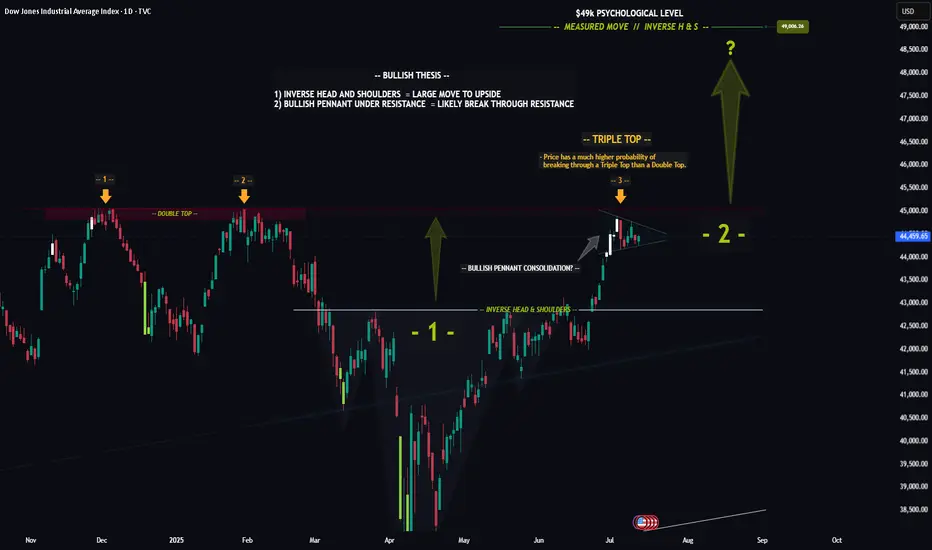
DOW (DJI) -- Preparing For The Next Big Move?Hello Traders!
The chart of the DOW is really quite incredible... Recently price formed a textbook Inverse Head & Shoulders pattern, which led to a nice nearly to the all time high. Furthermore price looks to be consolidating in a Bullish Pennant just below the all time high resistance level.
The reason the Pennant below resistance is so significant is because this signals that investors are likely preparing to drive price higher to new highs. Think about it like a fighter resting before the next big fight.
Triple Top: In addition to the pennant price has now hit this resistance level for the 3rd time. The more times price hits a level typically the weaker it gets. After the 3rd hit the chance of a breakout increases dramatically.
In Summary: The "Triple Top" in conjunction with the "Bullish Pennant" means that there is undoubtedly a very high probability that price will breakout and make new all time highs.
This post is primarily meant to be educational vs a trade idea. Its charts like this that invigorate my technical analysis side and I hope it does for you as well.
Best of luck on your trading journey!
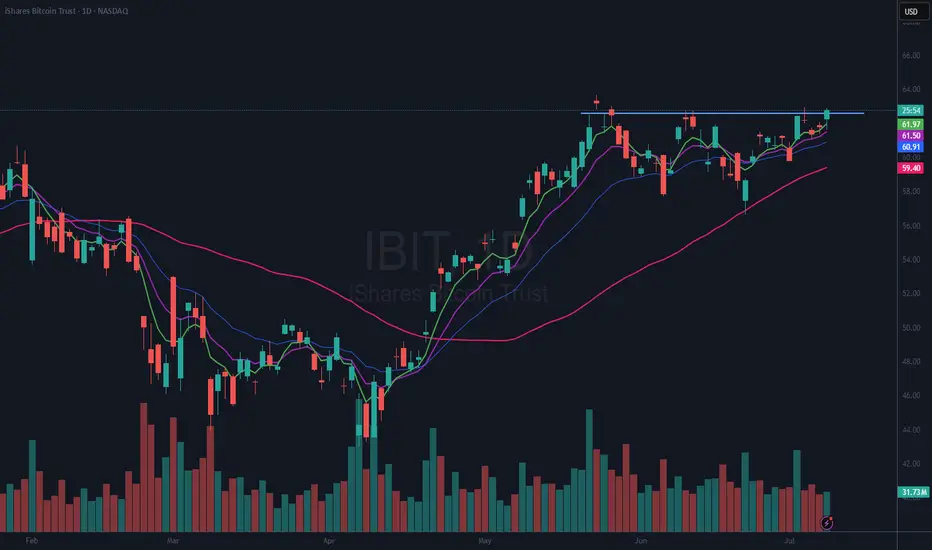
$IBIT a BITCOIN ETF Is Breaking Out of a Flat BaseNASDAQ:IBIT I have been looking at this for quite awhile now. I drew in an “area” of resistance, and it has hit that twice in the last few days. I bought a position on Jul 3rd and was stopped out. It just broke again so I have opened yet another position and will use a stop on a close below the 21 EMA (blue).
If you like this idea, please make it your own and trade it only using your own trading plan. Remember, it is YOUR money at risk.
$HUBS Basing / Ready for Next Move Higher?I traded this stock last year and made good $$$. I think it may be time for it to make another run. I had set an alert to see if it would get up and over the 21 EMA. That triggered today. Based on that, I have opened a ¼ size position, not much, but enough to make me keep my eyes on it. I also have a stop just below today’s low. This is another A.I. play and it is also a bit of a dumpster dive. It seems to me to have broken its downtrend and in a Stage 1 base. It has also put in a higher low from the April 2025 lows. I do not expect this will just rocket higher and it may turn out to be dead money. But it is one you may want to keep an eye on.
If you like this idea, please make it your own and follow your trading plan. Remember, it is YOUR money at risk.
HubSpot's NYSE:HUBS new Breeze AI platform continues to turn heads, since its launch last September, just ahead of Salesforce's NYSE:CRM Agentforce.
The idea is simple enough: let Breeze handle the grunt work in your Marketing, Sales, and Service Hubs by generating leads, automating campaigns, personalizing outreach and even fielding basic support questions in real time. Sounds neat, right?

$IWM 4 hour cup and handleLooks like a cup and handle pattern formed with a retest of the neck line.
A break above $215.53 would confirm bullish momentum back in. A break and hold below the neckline would invalidate the pattern.
Happy hunting!

$ORCL Beats Earnings – Flat Base Breakout?There is a lot to like about NYSE:ORCL both on the chart and fundamentals. Not only did they beat earnings and now get an upgrade (see below), but the stock has also now formed a flat base after earnings. What that means to me is that buyers have pushed the stock up and there are not enough sellers to bring it back down.
I have an alert set at 215.01. If that triggers, I plan to open a full-sized position with a stop just under the most recent low (202.54). That is a 6% risk. Although, if it does not perform well right off the bat, I may close it on whatever day I open if it falls below the day low. All TBD.
If you like this idea, please make it your own and follow your trading plan. Remember, it is your money at risk.
Oracle rises as Stifel upgrades to 'buy'
** Stifel upgrades stock to "buy" from "hold", citing strong momentum in its Cloud business and disciplined cost management
** Increases PT to $250 from $180, implying an 18.91% upside to stock's last close
** "We believe Oracle is well positioned to accelerate total Application Cloud growth to the low teens range in FY26" - brokerage
Oracle Beat Expectations
Wednesday, June 11, 2025 at 4:05 PM ET
Oracle (ORCL) reported earnings of $1.69 per share on revenue of $15.90 billion for the fiscal fourth quarter ended May 2025. The consensus earnings estimate was $1.64 per share on revenue of $15.54 billion. The Earnings Whisper number was $1.66 per share. The company beat expectations by 1.81% while revenue grew 11.31% on a year-over-year basis.

$IWM is set for a Blow-Off Top - 34% UpsdieAMEX:IWM is about to have a blow-off top moment!
Catch up mode engaged...
- Breakout of downward trend
- Volume shelf launch
- Rate cuts inbound
- Suppressed for 4 years
PTs: $244/ 259/ 276 (MM)

$AAPL In ConsolidationNASDAQ:AAPL is consolidating here in a wedging pattern. I do not know which way this will resolve. But, since I rarely if ever short, I am looking on the long side of a trade. The thing I like about a consolidation pattern like this is, you know when you are wrong very quickly. My plan is to take a ¼ size long position if / when it moves above the 50 DMA (red) with a stop just below the most recent low (which would also correspond to dropping below the lower wedging trendline.
Then if it can break out over the upper downtrend line, I will look to build out my position. I thought this would be a good one to put on your watchlist. If you like the idea, please make it your own so that it fits within your trading plan.

The Ghost of 1986-1987 Stock Market Overlay onto $IWMThe 1986-1987 stock market advance was 48% as measured by the S&P500 Index SP:SPX from the low in late 1986 which peaked in August 1987 and crashed into October 19th's spectacular 20% decline in one day.
The advance in the Russell 2000 Index from the low in 2023 to the high in 2024 was 51%, topping the 48% gain in the SP:SPX and the meltdown wasn't as spectacular, but it was similar.
There were similar patterns in fears of trade wars, US dollar declines, new tax laws going into effect back then and tax laws sunsetting this time. Those you can go into by reviewing my other charts I have published over the years here.
I stretched the 1987 pattern to fit the low to the high, so it isn't "exactly" the same time day-to-day for this pattern.
I found it interesting because the chart of AMEX:IWM all by itself had the same "look" to me as the 1987 bull market and crash so I decided to put it together for you all here to see.
I would expect a choppy market from here on as people adjust to the new uncertainties. Sellers of this decline will be shy to reinvest anytime soon and buyers are likely afraid to step up and get aggressive with so much uncertainty.
Sentiment as measured by AAII shows an extremely fearful and reluctant investor class, which is typical to see at major market bottoms.
Wishing everyone peace and prosperity!
Tim West
11:17AM EST April 24, 2025

MAOR HEAD N SHOULDER TOP FORMATION I AM 100 % SHORT NOW The chart posted is that on the NDX 100 .This is my view of what has formed . best of trades WAVETIMER

$FTNT In a Wedging PatternI bought a ½ size position on June 2nd after it had tremendous volume and institutions protected it from slipping below the 50 DMA the day before. It has been nothing but sideways since and I am slightly underwater. My stop is a decisive close under the 50 DMA. I did not feel the Wed June 18th qualified as decisive.
Mark Minervini may call this a VCP (Volatility Contraction Pattern). In any event it is clearly in consolidation mode and could break either way. I will either be selling if it does not recover the 50 DMA or will be adding if / when it closes above the downward sloping upper trendline.
I thought this would be a good one for your watchlist. If you like the idea, please make it your own and follow “your” trading rules. Remember, it is your money at risk.

$TLT Rising Channel or Bear Flag?Is it time to invest in NASDAQ:TLT ? It looks positive to me. With inflation cooling down it looks like bond prices could increase, which means rates are lower. We do have a Fed Meeting coming up so there could be more volatility depending on the “Feds” messaging.
I am taking this long today with a ½ size position. I will place my stop just “below” yesterdays low of $85.46. I am going long because I see a series of higher lows and higher highs. And I have a well-defined risk level of about 1% to know if I am wrong.
If you like this idea, please make it your own. Make sure you follow your trading plan.

COMPLETED 5 of 3 or C RSI bearish Non confirmation The chart is now labeled as COMPLETED . Please also take note of The HUGE difference in QQQ to QQQE and SPY to RSP . Best of trades Wavetimer 115 % short

Are The Markets Running Out Of Steam? SPY just cant seemed to hold above the 600 psychological level.
Are big players unloading into this positive market strength?
Are we due for a larger pullback?
There's a lot of mixed price action and we just cant seem to make a true breakout.
Some names are underperforming and other names are outperforming.
We remain tactically bullish while trimming keys positions into strength.
Being nimble in this market us key as were seeing large intra day swings.
Short term there is some risk of lower price so we have hedged in some individual names while still remaining bullish.

SPY Major Confluence ZoneSPY has a major upside confluence zone around 625
Looking for a test of this area in the coming weeks.
The level is about 5% away.
Let the melt up begin.

SPY New All Time Highs IncomingThe #SPY weekly chart is so bullish but don't take my word for it.
Simply look at the weekly bullish crossover that occurred between the 7 week & the 20 Week MA.
The last time this occurred was in Nov 2023 and the markets ripped 19% before having a major 3 week pullback and then another soaring continuation higher.

Bullish Intraday Patterns Everywhere!SPX had a wonderful intraday hourly chart confirmed breakout. This pattern is bullish and likely will continue higher.
The bulls tomorrow would love to confirm the daily chart breakout and will try to push for that.
SPY/SPX is holding more relative strength than the Q's & IWM which is displaying broad participation.
There are many bullish charts showing accumulation, golden crosses and bullish MA crossovers.
The DXY appears to be wanting to break down to around $97.00 which should yield more upside.
We secured profits today on SPY 594 calls & NVDA 144 calls.
We still remain net long and see the S&P 500 over $6000
Apple, XYZ, AI - are bullish setups were continuing to manage.

SUPER CYCLE TOP SOON IGV WAVE 5 The chart posted is by far the strongest chart within the market and has a clean wave structure from an Elliot Wave view . I have now taken a position for the last wave and will exit and go 100 % short all markets once the 5th wave has reached the targets min 106.7 to ideal target is 111 zone this should be seen based on my work in spiral cycle top is due 2.5 TD days from today with the alt on June 6/9 best of trades WAVETIMER

SPY, SPX, IWM, Natural Gas, NVDA, XYZ, AI - Analysis- Markets sold off into the NVDA rally this morning.
- Small afternoon rally turned indices back green
- Major pre market high levels up ahead likely allow us to push higher in coming days.
- NVDA should retest its premarket high levels.
- Profits secured on AI calls!
- Structurally indices are still bullish and remain above key levels.
- Yields see nasty reversal lower and look to be going down.
- Natural Gas trying to lure investors with a bottoming tail - but i think its false hope.
