IWM: A $240 Target in 2024. Here's Why It's Doable.Flip on financial TV and you will likely hear a plethora of sellside strategists and buyside portfolio managers voice optimism about small-cap US stocks. Consider that the iShares Russell 2000 ETF (IWM) was easily in negative territory on the year back in October. Fast forward just two months and the small-cap ETF is up close to 20% total return in 2023. The quick switch has come about amid the group’s fastest move from a 52-week low to a 52-week high in its history. IWM is now poised to print its third-best two-month rally since its inception more than 20 years ago.
Is there more room to run? I think so. A breakout above the $200 mark, particularly on a weekly, monthly, and yes, even a yearly closing basis, is significant. Recall that IWM found support in the low $160s on a few occasions in the last year and a half after printing an all-time high above $240 in November 2021. Sellers flexed their muscles three separate times in 2022 and 2023 at the $200 mark. This $40 zone appears to be breaking in the bulls’ favor. That suggests a measured move upside target to $240 – close to the all-time high on IWM.
I see some near-term resistance in the $210 to $215 area – the range lows from 2021. Indeed, there is likely a significant amount of ‘dead bodies’ lingering above $210 that may look to supply the market with shares in order to sell at the breakeven mark. Still, the technicals appear positive despite some near-term overbought readings on IWM. Another cautionary signal is that the January through mid-March stretch has featured some volatility at times for the broad market, so the pace of the advance will likely slow. I remain constructive on small caps looking into 2024, though.
IWM

XRT: Ringing the Register on Retail StocksSmall caps have surged to fresh highs dating back to the first quarter of 2022. The Russell 2000 ETF (IWM) has suddenly become a darling among sellside strategists and even buyside macro portfolio managers. Recall it was just two months ago when the group traded around 12 times next year’s earnings estimates. Jump ahead to today, and a 25% rally since October 27 leaves ‘the smalls’ closer to 15 times forward EPS forecasts. Is that a bargain? Maybe not quite as much.
Let’s focus on one key piece of the small-cap story. Retailers. Pull up a chart of the SPDR S&P Retail ETF (XRT), and you will see that the pattern since late 2020 appears remarkably similar to IWM's technical profile. The equal-weight basket of consumer equities peaked above $104 in Q4 2021 before plunging to support about 50% lower. Indeed, the mid- FWB:50S has proven to be support several times in the past 15 months. While XRT holds many large-cap names, its equal-weight construction methodology means it will act like a small or mid-cap ETF.
On the chart, I see clear resistance near the $75 mark. A breakout above that would portend a potential measured move price objective to the low to mid-$90s – just under its all-time high. For now, I am cautious on the fund since it has yet to break through the $75 line in the sand. I noticed, though, that in the fund's 18-year history, January has actually been a positive month, averaging a 2.2% total return with more tempered gains in February. March and April are the two best back-to-back months on the calendar.
Price comes first, however. So, I would like to see XRT jump above the $75 level. For now, ringing the register on retail stocks appears as the prudent play heading into 2024.

$CELH Finding Support?NASDAQ:CELH Has recently had 2 events: Earnings, which beat expectations and had an initial upward push on price then failed. Then it had a 3/1 stock split. One must wonder why the split as the market did not seem to like it.
The pullback, which is a little steep, may be finding support at both the most recent lows and a rising 40 Week MA (white). Of course, I do not know if it will be supported but I have an alert set on the downtrend line. Should it alert me, I will use a lower timeframe to see if there is a good risk reward entry. TBD.
NASDAQ:CELH On a closing basis, just over a 27% drop in price, not too severe and may present a good opportunity. There are several negative things to be aware of on this chart and that is, it is below the 50 DMA and all other shorter-term MA’s. Another is the selling volume has been heavy but declining.
This is one you may want to put on a watchlist as it has been a wall street darling. Maybe again? Of course, several closes below the 40-week MA would tell me that this whole idea is void.
Ideas, not investing / trading advice. Comments always welcome. Thanks for looking.

$MBLY Breaking Out?
I have been in and out of NASDAQ:MBLY several times in the last few months. I posted an idea a few weeks ago (link below). I am back in this one this morning as it breaks above the most recent high. It looks to me that it is getting ready to run. All TBD. My stop is below today’s low. If it does not work, I will be out for a small loss. I will look to add on any consolidation over the breakout area.
Ideas, not investing / trading advice. Comments always welcome. Thanks for looking.

$TSLA Consolidating in a VCP (Volatility Contraction Pattern)I traded NASDAQ:TSLA last week when it broke out of that inner wedge pattern. It went quickly and then pulled back. I made a good profit on a 2-day trade. A link is below for last week’s idea on the trade.
It looks to me that Tesla is finding some support in the low $230’s area. I have an alert set just over today’s high. If it triggers and the market are doing well, I will drop to a lower timeframe it looks for a good risk reward entry. All TBD.
Ideas, not investing / trading advice. Comments always welcome. Thanks for looking.

Fortune Favor's the brave! High risk!TUP broke out today on volume!
AAOI 25% short float and getting its highest monthly close since 2018
IONQ Bullish potential pattern at play

Nasdaq Highest Weekly close The markets marched higher here for an 8th consecutive week.
this is the largest rally since 2017!
The Nasdaq closed the week at its highest ever weekly close.

$DJI regains some ground, $RUT leading, $VIX strugglesAfter the outside day formed by TVC:DJI , it pumped a bit and regained most of what was lost in that 500pt loss.
1Hr chart sows it trading back above the moving avgs (intraday).
TVC:RUT is the only index that has traded ABOVE its recent highs.
TVC:VIX is struggling to close above a small resistance area, 14.
#stocks

US Equities Intrinsic AverageThe yellow resistance zone is expected to be pivotal for the stock markets. Although some indices appear close to ATHs, the presented spread graph suggests the intrinsic value of the US stock market isn't even half of the previous highs.
Same graph with monthly candlesticks:
Fundamentally:
Although rate cuts are expected, historically they mark the beginnings of bear markets
The significant 7 makes up more weight than Canada, France, China, UK, and Japan combined.
With de-dollarisation and world progressively relying less on US doesn't look positive for the 7 giants
Timing the markets can be difficult, but with
the recent deterioration in the labour market
shaky elections in 2024 (likely to be priced in before)
historically strong equities from January to mid-February
--> I speculate a bear takeover in early 2024.
For intrinsic graph sceptics, here is a simple average of the 4 indices:

GOOD NEWS BAD NEWS for SPY DIAThe SVXY peaked right into the target of 104 at 103.65 For wave 5 of 3 of 5 we just saw wave 4 low . we did the exact in most every Aspect in svxy and the sp 500 . this lead to the last draw out battle from july 6 to july 27 final peak. 20 days if we align the two time frames we get a TOP 1/ 11/2024 see chart golden ratio spirals they are near perfect MATCH this would take the svxy to target of 106 and put the VIX at under a 12 handle

IWM Massive reversal! CVNA / UPST / AFRMShort Squeeze stocks finally ended their epic rally!
Could High beta stocks be signaling a turn in the market?

Members Daily Analysis December 2025 Hours of Upside wiped out in 2 hours.
Bearish engulfing candles everywhere.
Yields Falling / Dollar rallying!

December 18: Members Daily AnalysisSPY +0.56% / QQQ +0.43% / IWM +0.04%
Another rally with most sectors selling off! 7 Negatvie 4 Positive
Tech valuation saturation continues.

NVDA WANT TO GO HIGHER When a pattern like head and shoulder fails it goes the other way AKA classic charting
overall market sentiment is also bullish this can go very high easily
DYOR!

$IWM $145 before $400+?I know everyone is getting excited about IWM as it's rallied a lot over the last couple of months, but I think it'll face some pain in the coming weeks before it really starts to outperform.
I am of the mindset that everything has it's cycle and I do think that going into the next bull market, that QQQ and SPY will underperform relative to IWM.
That said, I think IWM will have a 25% correction before the bull market really begins. However after that happens, I think IWM will go to hit new highs and top around $400 sometime in 2025-2026.
Support = $145
Resistance = ~$400

$TAN Up 17% in 2 Days!Who says you cannot make big returns on ETF's?
AMEX:TAN the Solar Sector ETF Is on fire. It looks like rotation back into the beaten-up sector. Names Like NASDAQ:FSLR and NASDAQ:ENPH up even more. Rather than take the risk on an individual name I have opened a ¼ sized position in this ETF. I will be looking to bring this up to a full-sized position on any consolidation.
This ETF has institutional accumulation volume going back over a month. It has regained all MAs except for the 40 Week MA in white. All shorter-term MA’s, including the 50 Day Moving Averages are turning up. My stop is set below yesterday’s low and the horizontal line of support / resistance.
Ideas not investing / trading advice. Comments always welcome. Thanks for looking.

Opening (IRA): IWM April 19th 165 Short Put... for a 2.10 credit.
Comments: Starting to erect rungs in the second quarter (April, May, June). QQQ doesn't have an April yet, and I already have a SPY rung on out in that contract, so just doing the small caps here. Targeting the <16 delta strike paying around 1% of the strike price in credit.
I'll naturally look to add in shorter duration should we get a bump in IV, but may have to dabble outside the broad market (IWM, QQQ, SPY) box to get paid something decent in shorter duration.

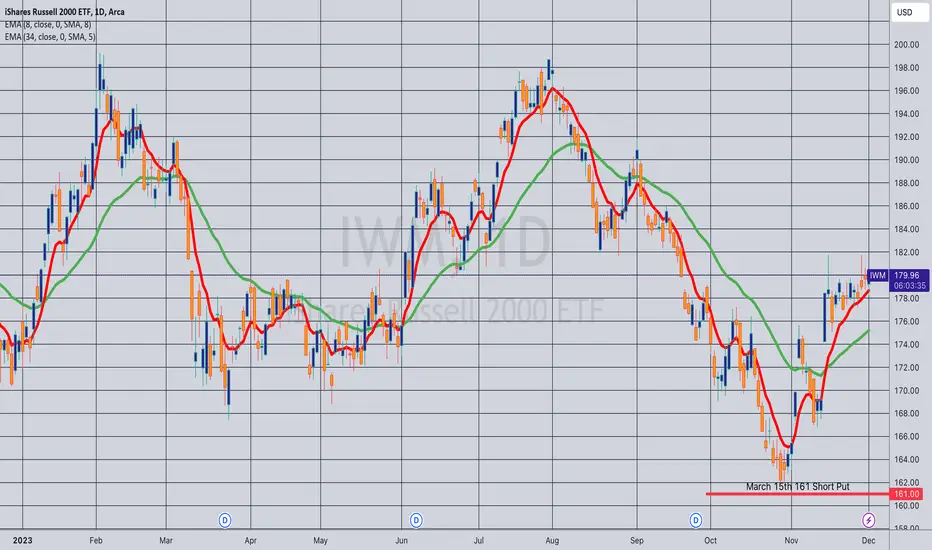
Opening (IRA): IWM March 15th 161 Short Put... for a 1.66 credit.
Comments: Targeting the shortest duration <16 delta strike paying around 1% of the strike price in credit to emulate dollar cost averaging into the broad market. I'll naturally look to add rungs in shorter duration if we get a sell-off/pop in IV.
IWM & SPX face Ripping rally!The IWM & S&P500 is completely gone vertical; off the lowering of yields.
Its like the fed Pivoted today, but really they didnt.
Is this a Fomo rally or is the market fundamentals now turned Bullish?
Bull Steepener vs Bear Steepener?

$OSK Breaking Out of Flag Formation?NYSE:OSK Here is another play on electrified specialty vehicles. Check out their website www.oshkoshcorp.com Pretty cool stuff.
I have been watching this one for a good entry since earnings on Oct 23rd. I missed the pullback breakout on Nov 13th, but it has pulled back again and looks to be breaking back above that pullback. I have started ¼ sized position and I will place my stop just below today’s low of day. I do not expect this to be barn burner but a 10% to 20% gain over the next 2 months seems reasonable. I think it can get back to the double top highs from September. All TBD.
Ideas, not investing / trading advice. Comments always welcome. Thanks for looking.

$U Breaking Above 50 DMANYSE:U has been a bit of a troubled stock. However, they did beat on earnings, and they have announced 265 job cuts and office closures to boost profit.
I am taking a chance here on a "turnaround play." I opened a ¼ size position just a bit ago. I’ll place my stop just under the low of the day (that’s about a 9% stop, bigger than I like but it has moved that much today, hence the smaller position size).
I like the volume on earnings day along with follow-up volume the next day. It is on track today to be about 150% of the last 10 days average volume so buyers are showing up. Although it is now above its 50 DMA it has yet to cross the 40-week MA (white) and just above that in light green is the 18-month AVWAP. Those could be strong areas of resistance, TBD.
Ideas, not investing / trading advice. Comments always welcome. Thanks for looking.

$ONON Holding The Uptrend?I have been long NYSE:ONON for about 2 weeks and have averaged in with a cost basis of 29.20 so I am currently underwater, but it has not hit my stop. If it stays above my stop, I will continue with the trade. I have a ¾ sized position and will look to add to a full position once I am at least $1 over my average price.
I am posting this idea today because I have reevaluated the position with the idea that I might close it. But as I do so, I still like what I see. The only negative on the chart is it is below a declining 40-week MA. However, on the positive side It is clearly in an uptrend (I almost got shaken out yesterday). It is above the now rising 50 DMA and is above the IPO AVWAP which means that by volume and price most buyers are in the money. There is still an overhead supply that could keep the progress slow for a while.
Were I a new buyer here I would look at yesterday’s candle as being a reversal and today’s candle as confirmation.
Ideas, not investing / trading advice. Comments always welcome. Thanks for looking.

$CLBT With Huge Cup with Handle Breakout.NASDAQ:CLBT Beat on earnings with an 800% surprise and earnings growth of 1,000% as reported on November 14th. Cellebrite sells software to the Police, and all government entities. They state that: Cellebrite's mission is to enable its customers to protect and save lives, accelerate justice, and preserve privacy in communities around the world.
Now to the chart, I have charted this on the weekly timeframe, so the latest candle is only 2 days old. 4 weeks ago, NASDAQ:CLBT broke out of the handle formation. It is now consolidating that breakout. The formal breakout that many use would be the height of the cup before the handle was formed. The breakout price for that is $8.29. Which is very close in price to the 18-month AVWAP. As of this moment it’s trading at $8.45. I have an alert set right at 8.60. Should that trigger, I will look to go long with a stop just under this week’s low of 8.09. That seems to be a good risk reward ratio to me. I do not set price targets, but I think it is possible to go back near all-time highs of around $11.50. Should that happen that is a 33% move! I can handle that.
Ideas, not investing / trading advice. Comments always welcome. Thanks for looking.
