$DJI $NDX $SPX $RUT all pumping but giving back, what now?DJ:DJI is having hard time here, again.
The RSI is much lower, negative divergence, steam running out?
NASDAQ:NDX is higher but also losing steam, RSI lower.
SP:SPX AMEX:RSP & AMEX:IWM all put higher highs but they're also giving back.
All the #indices have low volume. Kind of normal for this time of year.
TVC:VIX is lower.......
Sell on news?
Lots of GAINS over past few months.
Hmmm, let's see what transpires by end of day.
#stocks
IWM

$VIPS Retesting Breakout?Looks like NYSE:VIPS had been basing for about 5 months before breaking out of resistance on June 6 on slightly better than average volume. Since that breakout and peak on June 15th, it has been pulling back to the breakout area. I like these retest entries. Depending on the market today and the performance of NYSE:VIPS , I will be looking to enter a trade on the long side. All TBD. See notes on chart.
Ideas, not investing / trading advice. Constructive comments always welcome. Thanks for looking.

Equal Weight $SPY, $RSP, performing BETTEREqual weight AMEX:SPY is outperforming the regular CBOE:SPX #Index again
AMEX:RSP
We mentioned not long ago that the big names that ran were struggling a little recently.
Money Rotation?
TVC:RUT could do a lil better. Not participating as much.
But it's nice to see AMEX:RSP doing better than normal #SPY.
TVC:VIX heading lower gain
#CPI Tomorrow

$DJI $NDX $SPX $RUT Long & Short term viewsBringing indices up again, Let's look at the SHORT TERM first.
(Unfortunately can only show 1 chart, see profile for more info)
DJ:DJI longer term still showing an ascending triangle, current pattern is sideways channel, there's some negative divergence.
NASDAQ:NDX maintains the uptrend, HOWEVER - we're seeing SEVERE negative divergence.
SP:SPX also in current sideways channel, and also showing SEVERE negative divergence.
TVC:RUT completes the bunch with a sideways channel and some neg divergence.
----------------------------------------------------
Longer term #indices are interesting. Using weekly.
DJ:DJI showing slight negative divergence, needs to break out FAST
NASDAQ:NDX Extremely overbought, last 3 times; 2 corrections, 1 major drop.
SP:SPX Nothing out of the ordinary, lil overbought, see #NDX notes.
TVC:RUT Severe underperformer and it looks like it wants to catch up to the others.
#stocks

$Z Successful Pullback?NASDAQ:Z I was waiting for a pullback in this name as I missed the initial breakout. It looks to me that it has / is testing that today. I used a 5-minute chart to make an entry after it pulled back and then reversed higher. I have a very tight stop just under today’s low which coincides with both the resistance / support line and the 21 EMA. I posted this idea a few days ago. Link at bottom for those interested.
Ideas, not investing / trading advice. Constructive comments always welcome.

IWM: Something is Rotten in the State of MarketsPrimary Chart: IWM on a weekly timeframe with downtrend line and major support and resistance zones
Note1: IWM is an iShares ETF that represents the Russell 2000 small-cap index in the United States. Though not as widely tracked as SPX, NDX, or DJIA, the Russell 2000 ( TVC:RUT ) is one of the major US indices. It is likely the fourth most watched US index.
Note2: The phrase "something is rotten in the state of Denmark" is a well-known line from Shakespeare's play Hamlet used to describe a situation where something is wrong or even corrupt within a government, institution, or system. No corruption is intended to be implied discussed. The title's allusion to this phrase is meant to suggest only that something is off / wrong in the markets, i.e., that everything is not well despite the strength of the Nasdaq 100 lately and the support seen in SPX.
The Russell 2000 (IWM) is often a leading indicator in US markets. It led to the downside in early November 2021 after a false breakout out of its 2021 topping-pattern's resistance around $234. SPX topped nearly two months later on January 4, 2022. While small-caps are not necessarily always the first to make a move, it is something frequently cited by commentators and analysts.
The primary chart shows how IWM has struggled below the upper blue rectangular zone, a resistance / supply zone going back to highs in March and April 2022. This zone also rejected price at the end of the impressive August 2022 rally that had everyone debating whether the bull-market had returned in earnest. Lastly, on February 2, 2023, IWM was unable to even tag the lower edge of this zone, eking out a high at $199.26. The lower edge of this blue resistance zone as drawn here is at HKEX:200 - HKEX:201 approximately.
The Primary Chart above also shows an important Fibonacci support level at $170. This the 50% retracement of the entire bull market from the 2020 Covid lows to the highs in November 2021. This has also marked important support since late October 2022 (a week or two after the October 2022 lows). Notice the weekly candle wicks protruding below this line but recovering back above it.
The final point about the Primary Chart is the down TL from the all-time high in magenta. This was broken to the upside, which was one of the reasons many market participants and commentators got excited about the bear being complete. That trendline was retested in late March 2023. But despite this positive development, IWM has not acted well. In fact, it has broken decisively below a multi-month upward trendline from October 2022 lows as shown on the Primary Chart as well. This trendline was also important and signifies weakness on the decisive break below it.
On the larger scale, price is trapped between the blue rectangular zones of support and resistance. Until these break, not much progress is likely in either direction. Sideways action is likely for the coming weeks. The one thing that would negate the sideways action view is a clean break back below the down trendline from the all-time high. So keep an eye out for that development.
Next, Supplementary Chart A.1 and A.2 below shows a hypothetical illustration of how price could move sideways for the coming weeks / months before a flush below major support (if one is bearish about equities generally) or a rally above the key resistance zone (if one is bullish about equities generally). SquishTrade gives an edge to the bears in the intermediate to longer-term time frames—as long as price stays below both (1) the uptrend line from October 2022 lows, and (2) the key Fibonacci levels of the most recent decline (shown on the Primary Chart at $183.36 and $187.11).
Supplementary Chart A.1 (measured corrective move upward where the legs of the corrective move might be equal or share a 1.272 Fibonacci relationship)
Supplementary Chart A.2 (choppy sideways action that retests the upward TL from the October 2022 lows that had broken down in March 2023 before heading lower again)
Supplementary Chart B is a zoomed-out version of the major resistance and support level shown on the Primary Chart. This is intended to show the ranging action for months that has taken place despite periods of seemingly impressive strength and sharp weakness.
Supplementary Chart B
The next chart, Supplementary Chart C, illustrates what a trendline might look like if someone were considering this chart afresh, i.e., for the first time without having tracked the prior trendlines during the 2021-2022 bear market. The TL has been re-drawn to account for the recent major highs at the end of the January to February 2023 rally.
Supplementary Chart C
IWM's anchored VWAPs are not encouraging. Here, the only VWAPs considered are the one anchored to the all-time high in November 2021 (blue-purple line) and the 2022 low (orange line). Price made a false breakout above the VWAP from the all-time high and failed back below. That in itself is a negative especially given that this occurred on a larger time frame going back to 2021. Price has also failed below the October 2022 VWAP as well.
Supplementary Chart D
Finally, and most importantly, consider the ratio spread of IWM/SPY in Supplementary Chart E below . This tracks the performance of the Russell 200 relative to the S&P 500. This is why something might be rotten in the state of Denmark (markets). A healthy market should not have an index looking this bad. Let me know what you think in the comments.
Supplementary Chart E
The ratio spread shows that IWM's underperformance just broke below a key support level for that ratio. But bigger support lies below. However, the overall picture looks bleak for IWM with a downtrend line that has lasted for a while, and lower highs for the ratio's value on higher time frames.
________________________________________
Author's Comment: Thank you for reviewing this post and considering its charts and analysis. The author welcomes comments, discussion and debate (respectfully presented) in the comment section. Shared charts are especially helpful to support any opposing or alternative view. This article is intended to present an unbiased, technical view of the security or tradable risk asset discussed.
Please note further that this technical-analysis viewpoint is short-term in nature. This is not a trade recommendation but a technical-analysis overview and commentary with levels to watch for the near term. This technical-analysis viewpoint could change at a moment's notice should price move beyond a level of invalidation. Further, proper risk-management techniques are vital to trading success. And countertrend or mean-reversion trading, e.g., trading a rally in a bear market, is lower probability and is tricky and challenging even for the most experienced traders.
DISCLAIMER: This post contains commentary published solely for educational and informational purposes. This post's content (and any content available through links in this post) and its views do not constitute financial advice or an investment or trading recommendation, and they do not account for readers' personal financial circumstances, or their investing or trading objectives, time frame, and risk tolerance. Readers should perform their own due diligence, and consult a qualified financial adviser or other investment / financial professional before entering any trade, investment or other transaction.

AI boost US mega caps - Nasdaq, Russell 2000 Left in the ColdTech Surge: AI Stocks in the Limelight
The performance of US stocks in the AI sector has been nothing short of remarkable, with over $3 trillion added to its market cap since the final quarter of 2022. The upward trend suggests further potential growth despite a broadly stable or mildly declining US stock market outside the US Megatech sector. The enduring climb of these stocks underscores the market's conviction in AI as a lasting, transformative force rather than a transient phenomenon. The US tech landscape had undergone a significant shift from a bleak outlook six to twelve months ago when technology was deemed insignificant, as currently, AI dominates the scene.
The Tech Surge vs. Small Businesses: The Gap Widens
The current market showcases a divide between big tech and smaller enterprises, with capital flows favoring the former. Coupled with potential deflation, this rift could intensify the struggles of smaller businesses. The thriving AI sector doesn't necessarily imply a positive outlook for smaller companies unrelated to AI in the upcoming 6-12 months. Acknowledging AI's transformative potential across industries like robotics, 3D printing, and crypto is vital. Even though a short-term crisis and job loss are on the horizon, the looming recession could present opportunities for buying cheap assets. In this unique period, reminiscent more of the 1940s and 1990s than the 2000s or the 1970s, a broader perspective, adaptability, and a positive mindset are necessary.
Price action: Is the top near?
Based on the Nasdaq 100 vs. Russell 2000 ratio, it's doubtful that the top is in. As you can see on the main chart, it's possible that a short-term top could be in, as NDX just filled a gap while sweeping several highs in the 14200-14300 area. However, this isn't the 2000s; this tech is more transformative. The world is ready to adopt it, and that's why ChatGPT was the fastest-adopted technology ever. Now the top 10 us tech companies have the best workforce, hardware, data, and customer base for AI; that's why they are leading the way, and they are unlikely to go down any time soon. That's confirmed by the ratio between NDX and RUT, which seems to have formed a massive cup and handle pattern that's about to break out. Maybe the current rally slows down a bit, but it's not impossible to see it accelerate rather than decelerate.
The S&P 500 seems to be at least 1% higher until it hits the next resistance, but my key target has been 4350 for a long time.
Once it hits it, a more substantial correction could come, even though I think it would take the SPX to 4000 at best. As for Russell 2000 looks very weak, and I think it will sweep its double bottom and fill the critical gap lower.
Sentiment remains bearish
For many months, on Tradingview and Twitter, I've been talking about how bearish people are, how inflation is coming down, liquidity is trending higher, and so on... yet nobody wants to hear about it. Everyone wants to talk about the ongoing or upcoming recession, and they consider AI a fad. Even after this move higher, sentiment hasn't changed, and it's getting more bearish, with people trying to short the rally, as they are angry for missing the boat. We can see that in CoT data, we can see on Twitter polls, and I can see it based on what people say on social media.
Potential strategies
In my opinion, it is either best to ride the trend with a small position and a wide-stop loss or wait for the market to hit key resistance, and either potentially short there if sentiment flips bullish or wait for the pullback and then go long.
Although the long Nasdaq short Russell trade could have some juice left in the short term (very bullish long term), I wouldn't rush to put that trade on, as the Russell could play catch up (in the short term), as we see traders/investors diversify as they take profits from their tech stocks. These stocks are cheap and seem more 'hated' than those US mega caps.
Higher interest rates and shrinking liquidity significantly affect small caps, and their situation could deteriorate. It's clear we are either in a recession or about to enter one, and these stocks have the most to lose. Therefore, once these stocks rally, especially if they outperform NDX, consider entering a long Nasdaq - short Russell trade. This trade might not work only if many large countries start banning those companies and their products or if the US starts attacking them for being too large. Until then, the ratio has higher to go.

$APPN Breakout?NASDAQ:APPN Looks like it broke out today on about 20% higher volume than the last 10-day average. It was not a Pocket Pivot as the volume did not exceed the highest down volume in the last 10 days. However, there have been 2 Pocket Pivots Since the Earnings announcement on May 9th. I missed this 9 ½% move today and I think it may be extended. I will be looking for either a consolidation in this area or better, a pullback to the breakout area over the next several days or weeks.
The notations on the chart show we are above an 18-month AVWAP for a few days now and today over an area of resistance for over 10 months. All in all, very bullish IMO. Since earnings it has regained the 40-week MA, the 50 DMA and all shorter-term MAs. This goes on my ready list for any consolidation or pullback because there is not much to hold this issue back other than some shorter-term profit taking.
I hope this helps someone. Ideas, not investing / trading advice. Constructive comments always welcome. Thanks for looking.

$SOUN On Breakout WatchlistNASDAQ:SOUN is an AI stock that has not gotten much love as with other AI themed issues. Maybe one reason the market has been ignoring it is that has yet to make a profit. However, they are in the AI voice response business which cuts across many industries. While I think they have a bright and disruptive type future, it is the market’s opinion that matters.
You can see my notes on the chart. There are two merging resistance areas, the IPO AVWAP and resistance area since March. I have an alert set at $3.40. If it can get above and hold this may have room to run. This is the kind of stock that could easily double or triple in a short period of time. All TBD.
Thanks for looking. I hope this helps someone. Constructive comments always welcome.

$SPY no longer underperforming $RSP or $RUTLooks like the idea of BTD (Buy the Dip) is still in place.
IMO not enough EUPHORIA for "crash" (like many are calling).
AMEX:RSP (equal weight SP:SPX ) was outperforming AMEX:SPY but that is no longer the case as of yesterday.
TVC:RUT AMEX:IWM also lagging but the chances are that it will likely catch up in time.
#stocks

Opening (IRA): IWM September 15th 153 Short Put... for a 1.60 credit.
Comments: Selling premium in the shortest duration where the <16 delta strike is paying around 1% of the strike price in credit to emulate dollar cost averaging into the broad market.

$IWM – Bull Flag Breaking Out?Hooray for small caps! It is looking to me like AMEX:IWM (Russell 2000 small cap ETF) is ready to participate in the newest market rally. This is great news as it shows the market is broadening with more participation. I do not have a position yet, but I am looking to start one if this keeps showing strength. I may even use the 3x levered AMEX:TNA as a booster. (Cannot hold levered ETFs too long as they are geared for day trades). Ideas, not investing / trading advice.
You can see I have outlined the Bull Flag as well as important moving averages. On the lower part of the chart, you can see the Volume has picked up, the MACD is rising and the indicator at the bottom shows market new highs new lows (new highs are green days).
I hope this helps someone. Thanks for looking. Constructive comments always welcome.

GME: Falling Wedge Breakout to All-Time Highs is NearGME recently bounced from the lows on the lower timeframe thanks to a Bullish Gartley and a massive amount of MACD Bullish Divergence and it has since come back down to fill the gap the rise created; now that GME has filled that gap it is going for a second leg up and the RSI is entering the Bullish Control Zone, and soon it will be Bullishly breaking out a macro falling wedge pattern which if it breaks, I think could take it up to the levels of at least $120-$135

Russell 2000 Order Flow: Bullish Pattern ActivatedHey traders,
In today’s analysis, it’s hard to ignore IWM following the 🚀explosive🚀 8%+ move up.
Let’s unpack the action as of late via the OFA script :
To do so, I am NOT going to apply any subjective type of analysis such as crawing trendlines, counting waves based on what way the wind blows, or any other form of guessing…
Instead, we let the formation of fractal structures (an objective measure of moves) create the pathway from which we can all make decisions.
Fortunately, there is no need to engage in laborious manual work. Why? The OFA script has all of us covered. So, with that in mind, what can we observe in the IWM market?
What recurring pattern do you notice? Clue - Pay attention to the visual CIRCLE feature in the last leg.
These patterns entail, “dynamic fractal-based order flow cycles where a decreasing involvement in one direction (depicted by cycle/wave/line counts) is followed by a predictable move in the opposite direction with greater commitment seeking out the next equilibrium area, in most instances, with potential profits as a by-product thereafter…”
If you are into disseminating order flow, nothing I’ve seen beats the objectivity in analysis one can carry out via the formation of structures derived off fractal structures.
So, how are you going to profit from the latest pattern printed? I know how I will...
Remember the two key main features of the OFA script:
Magnitude: A major clue that will help determine the health of a trend is the type of progress by the dominant side in control of the trend. We need to ask the following question: Are the new legs in the active buy-sell side campaign as identified by the script increasing or decreasing in magnitude?
Velocity: When it comes to the distance the price moves, the magnitude is only ½ the equation. The other ½ has to do with the velocity of the move or the speed. Was the new leg created after a fast and impulsive move? Or did price make a new low or high with the movement being sluggish, compressive and taking too long to form? A good rule of thumb is to count the number of candles it took to achieve a new leg.
DISCLAIMER: This post contains commentary published solely for educational and informational purposes. This post's content (and any content available through links in this post) and its views do not constitute financial advice or an investment or trading recommendation, and they do not account for readers' personal financial circumstances, or their investing or trading objectives, time frame, and risk tolerance. Readers should perform their own due diligence, and consult a qualified financial adviser or other investment / financial professional before entering any trade, investment or other transaction.

$U One for the WatchlistUnity Software made big news (or was it) with the announcement that their software would be part of Apple Vision Pro. This may or may not be a big deal. Apple my not have hit the mark on VR with a headset that costs near $4000… not exactly for the mass market, IMO. That said NYSE:U has been steadily increasing revenue and finally made a .01 cent profit last quarter (Hey, it’s profit).
I have drawn in a blue line that seems to be an area of resistance since Sept 2022. There is also a green line on the chart which is an 18-month AVWAP. Coincidentally, they seem to be merging right now. That to me is important because “if” price can get and stay over both areas most of the resistance will be gone and it might be free to rise in value. All TBD. The other good news is that it is above the 40-week MA (white and all other shorter-term MAs). And finally, this is a nice long base, the longer the base the higher the move, or so it is said.
I have this on my watchlist with an alert set at 42.50 so that it brings my eyes back to this and I do not need to watch it every day. Ideas, not investing / trading advice.
Thanks for looking. Constructive comments always welcome.

$RSP & $RUT show money is in rotationAMEX:RSP looks okay to me (Equal weight SP:SPX )
TVC:RUT / AMEX:IWM also looks okay
Question:
What is the common theme?
HEAVY VOLUME!!!
Buys are heavier than normal for those 2 indices and NASDAQ:NDX / NASDAQ:QQQ has selling that's lil heavier than normal
Looks like rotation IMO
Our calls were on the money again...
#stocks

RTY UpdateRSI rolled over but MFI is still overbought. Oddly ES and NQ MFI are oversold.
Looking to be another mixed bag day, possible counter rotation out of small caps.

$SHOP Ready to Buy?NYSE:SHOP – I have been looking at Shopify since earnings and it looks to me that it is ready to buy, in fact I started a ¼ size already this morning. See chart for my notations. This may be actionable “if” it fits your trading style. It has been basing for about 14 months now. A traditional break-out would be a close over May 23rds high of 65.54. I am early and already a little underwater, but my stop will be a close under the earnings AVWAP (lime green line). Ideas, not investing / trading advice.
Thanks for looking. Constructive comments always welcome.

IWM is going much much higher based on latest accumulation countThis idea is based on Wyckoff's accumulation schematic. The current accumulation count yields a much higher IWM target. All info is on the chart. Good luck.


$RUT $IWM & $RSP looking better = Breadth picking upTVC:RUT went above the SUPPORT line again before it closed
AMEX:IWM (Russell 2k) looking BETTER and better
AMEX:RSP (equal weight #SPX) also looking GOOD, look @ BUY VOLUME! It's performing better than SP:SPX
While we were wrong for couple days, we were RIGHT in the analysis that breadth was going to get better
#stocks

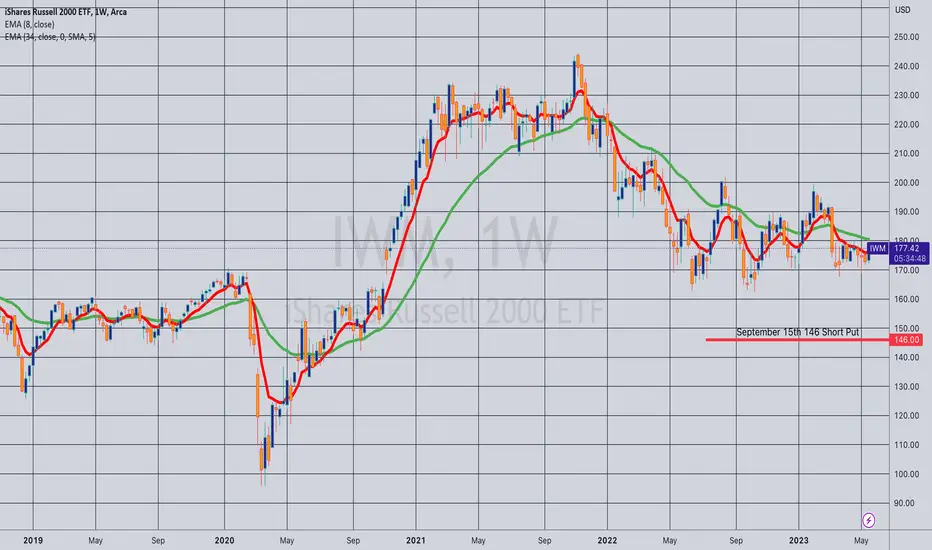
Opening (IRA): IWM September 15th 146 Short Put... for a 1.46 credit.
Comments: Re-establishing a September rung after scratching out a higher strike trade yesterday, targeting the <16 delta strike paying around 1% of the strike price in credit to emulate dollar cost averaging into the broad market.
The shortest duration trades in which the <16 delta strike is paying around 1% in credit:
IWM: August (at the 154 strike, paying 1.58)
QQQ: August (at the 296 strike, paying 2.99)
SPY: September (at the 367 strike, paying 3.70).
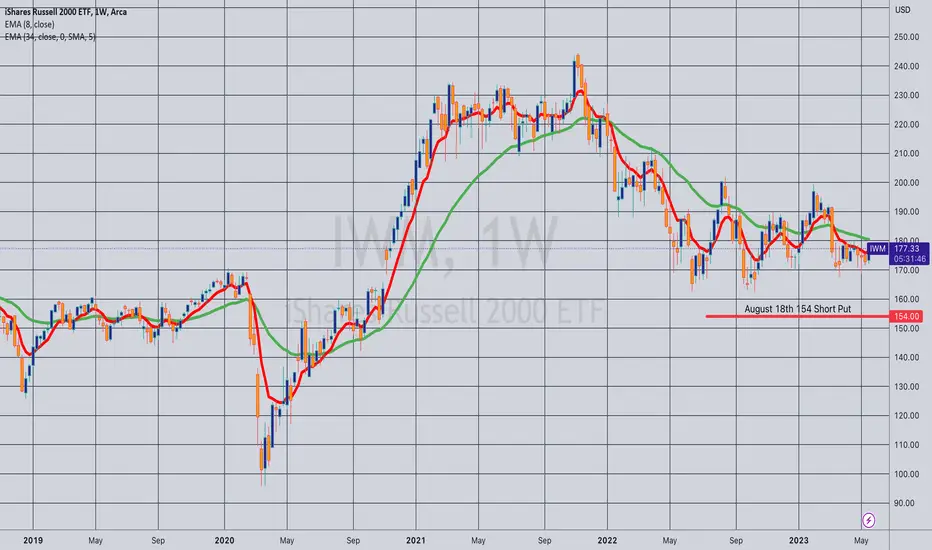
Opening (IRA): IWM August 18th 154 Short Put... for a 1.60 credit.
Comments: Targeting the <16 delta strike in the shortest duration paying around 1% of the strike price in credit to emulate dollar cost averaging into the broad market. Would like higher IV to sell shorter duration in, but you can't have everything.