$ARKK Still Working on Stage 1 BaseAMEX:ARKK – Maybe the best ETF to measure “Risk-On” in the market. I have been in and out of AMEX:ARKK a few times over the last 6 months. I thought it was going to start its stage 2 uptrend back in February. That was a false break-out. It is now back over its 40 Week MA, above all shorter-term Mas and has broken above an area of resistance (flat blue line). I really think this ETF has a strong possibility to rocket 50%, to 100% or more soon. In other words, I “want” to be bullish. BUT, after careful analysis, it looks like there could be some major supply until it gets over the 18-month AVWAP. I have an alert set at $45.00 which is still under AVWAP. But I want early notice and AVWAP should continue to drop in price over time. See notations on the chart for more details.
Bottomline for me, it’s a trade that needs to wait. And like I said, I want it to work. Only time will tell. Ideas, not investing / trading advice.
Thanks for looking. Constructive comments welcome
I did another post on this a few weeks back. I have the link to that at the bottom.
IWM

$IWM Pierced 50% Fibonacci levelAMEX:IWM has a lot of bank stocks in the #russel2000 and is up over 2% today. Pierced the 50% Fibonacci level today. This tells me the #Federalreserve will pause tomorrow. #jeromepowell

RTY UpdateCryptos and small caps pulled back, Europe and China were red this morning. ES and NQ are still overbought though with no pullback.
Could very well be a melt up, still short on shitcoin through BITO puts. Nothing else, don't feel much like trading this week. Made decent money last week despite closing early on Friday, seems every time I make money I give it back to the market, lol. Might be easier to wait until MFI indicator goes oversold again and snag the next pump.
Bearish on crypto because it looks like Asia and Europe are throwing in the towel, garbage trades 24 hours and the Asians own a lot of crypto. 3hr indicators are oversold though, not sure I'd recommend opening a new short position.

$RUT broke resistance & struggling to stay above, Yield top?TVC:RUT broke resistance & is trading back under again
The only consistent up mover is the NASDAQ:NDX
6Month is at its HIGHEST levels this year
1Yr Struggling here but hit highs
2 & 10Yr nowhere near highs TVC:TNX
All #yields look as if they're going to roll over soon
Historically, #stocks follow this downside on yields
Is this time different?

$IWM beginning of an uptrendAMEX:IWM beginning of an uptrend. #russel2000 Closed above the horizontal line and above the 20 and 50 weekly moving averages. Now it needs bullish consolidation and a retest of the horizontal line before it can break through the 200 weekly moving average.

$IWM, #RUTAMEX:IWM , the Russell 2000, experienced a significant move on Friday, June 2nd, accompanied by high trading volume. On the daily chart, it successfully broke out of its structure, indicating the next potential levels at $185-190. If it manages to surpass this range, it could potentially reach $200 and even $220. It is worth noting that there are several bullish setups observed in mid-cap stocks.

The Russel is testing a weekly downtrend linePay close attention to the weekly trend line and the 200 days MA line
Going down?
Or are we heading toward a massive rally?
Time to make some decisions!

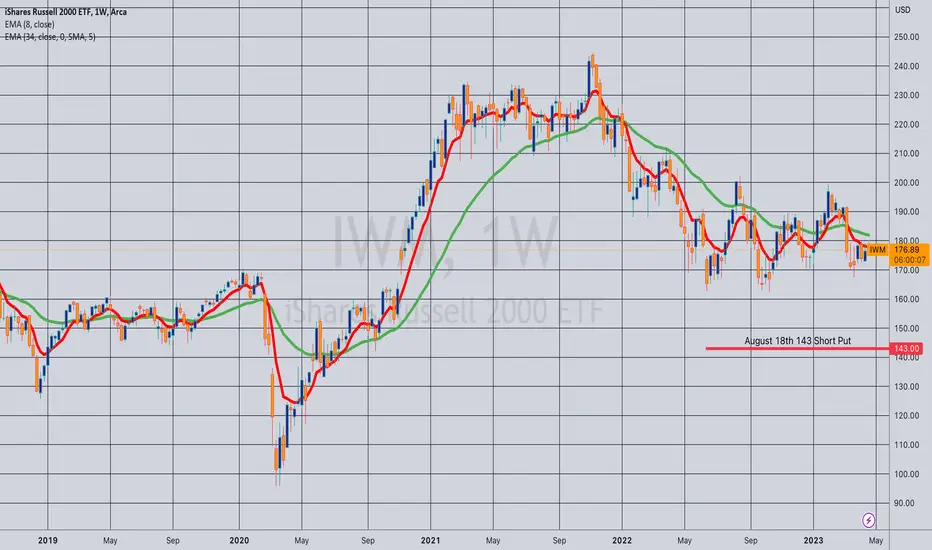
Opening (IRA): IWM August 18th 143 Short Put... for a 1.46 credit.
Comments: Starting to build out my short put ladder into the third quarter, targeting the <16 delta strike paying around 1% of the strike price in credit to emulate dollar cost averaging into small caps.
Bearish BAMM on the 3x Bearish Return IWM Bearish ETFThe 3x Bearish Return ETF for the IWM is currently showing Hidden Bearish Divergence on the weekly at the 55-week EMA, and it looks like if this Hidden Bearish Divergence plays out we will see the ETF fall below the B point and begin to accelerate its Bearish Wave Structure which would complete between the 1.272 and 1.618 Fibonacci extensions.
This would mean that the IWM (The Russel 2000) itself would be rising.
As a result of what I see here on the chart, I may consider buying puts on this ETF, Buying IWM Calls, or just overall getting more exposure to small caps and just taking this as an overall Macro Bullish Indicator.

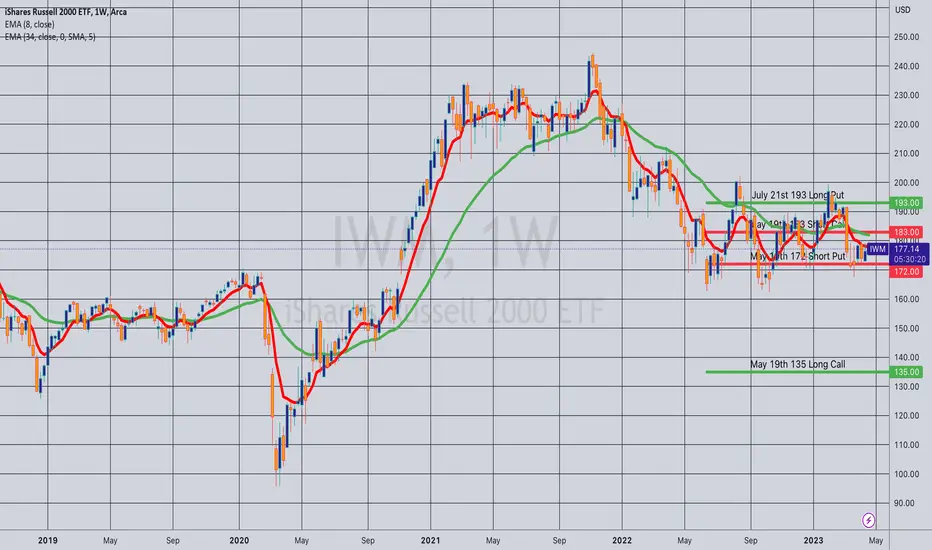
Opening (Margin): IWM May 19th/July 21st Double Diagonal... for a 56.60 debit.
Comments: Since my previous double diagonal in IWM was such a hoot (See Post Below), re-upping here. Buying the back month 90 delta strikes (both call and put) and selling the front expiry 30 deltas, with the result being a delta neutral setup on fill.
As before, I tend to manage each side individually, so keep track of both my global cost basis, as well as side cost basis and break evens. These start out as:
Long Put Diagonal Aspect (May 19th 172 short put/July 21st 193 long put):
14.17 cost basis/178.83 break even/21 wide
Long Call Diagonal Aspect (May 19th 183 short call/July 21st 135 long call)
42.43 cost basis/177.43 break even/48 wide.
As before, I'll look to roll out the short put aspects to the shortest duration 30 delta when the short option reaches 50% max that is at or above my cost basis (in the case of the short call), at or below my cost basis (in the case of the short put), liberally taking profit on sides should that happen.
RTY UpdateMFI hit oversold. NQ RSI is almost overbought on this huge pump. Remember ES is in the whipsaw zone again.
I'm probably not trading today or tomorrow. Reducing the number of trades I make since the market is going sideways, and I'm not really making much money.... I'll put up a post, but it's still tracking that big blue arrow, lol.
Since I'm expecting sideways whipsaw, no daily update unless indicators hit oversold or overbought.

RTY UpdateES and NQ are oversold but small caps arn;t yet, and it looks like we won;t see a bounce until it does.
Not chasing the drop at this point, so just waiting for tomorrow, lol

RTY UpdateHit overbought on RSI and MFI, but I think it's a pump and dump. Expecting a gap up tomorrow, maybe dump on Fed minutes?
Keep in mind RTY can go way overbought or oversold, least reliable of the index indicators. TLT already looks like it's hit bottom, so I don't see a tank coming either way.

RTY UpdateMFI no longer oversold, RSI almost overbought. If it gaps up again tomorrow, probably a pump and dump.
Market usually whipsaws when Asia/US/Europe decide to go different directions. Next rally probably won;t happen until Europe goes oversold on the short term indicators. We'll see.

Opening (IRA): IWM July 21st 150 Short Put... for a 1.48 credit.
Comments: Targeting the <16 delta strike in the shortest duration paying around 1% of the strike price in credit to emulate dollar cost averaging into the broad market. IVR/IV isn't fabulous here at 1/22.7%, but will look to add in shorter duration and/or at better strikes in higher IV should we get it at some point.

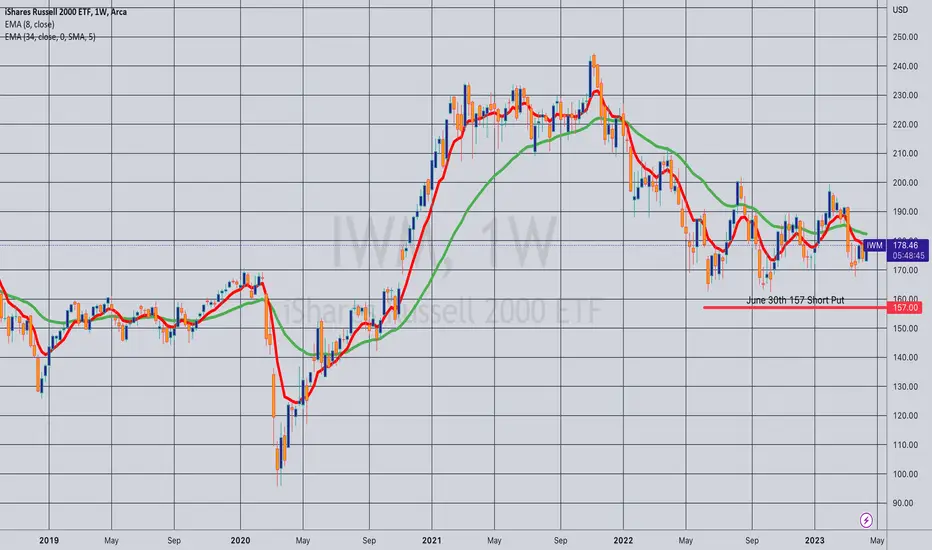
Opening (IRA): IWM June 30th 157 Short Put... for a 1.61 credit.
Comments: Targeting the shortest duration <16 delta strike paying around 1% of the strike price in credit to emulate dollar cost averaging into small caps.
This, admittedly, isn't an ideal premium-selling environment here, with 30-day at the very low end of the 52-week range, but will look to add at intervals and in shorter duration if that starts to pay again.
Rolling (IRA): IWM April 21st 176 to Sept 15th 161 Short Put... for a 1.71 credit.
Comments: Another "trouble maker" that I'm kicking the can on. Total credits received of 1.79 (See Post Below) plus the 1.71 here for a total of 3.50.

Opening (IRA): IWM June 30th 154 Short Put... for a 1.55 credit.
Comments: The weakness I would've like to had earlier ... . Targeting the <16 delta strike in the shortest duration paying around 1% of the strike price in credit to emulate dollar cost averaging into the broad market.

RTY UpdateRetail numbers missed bigly, garbage retail stocks all down big today.
Made some money off BUD puts, though I actually expected the numbers to be good, lol.
Small caps down 1.4%, at this point I'm not chasing the drop today. However, it looks like RTY is headed to oversold again, so I'll look at it again this afternoon, maybe throw another $2k bet against some garbage. I need to be careful though, any time I make decent money, I throw it away on a stupid gamble, lol.
Maybe I should just take a break, I'm up close to $10k the last 4 trading days....

RTY UpdateNice whipsaw going, MFI went oversold premarket.
Guess they're gonna pump garbage again, flipping my BUD puts on open.

MT technical Breakdown on watchIf retail earnings come in negative this stock could see further weakness.
A head & shoulders pattern has triggered which means we have to be aware of continued weakness to the downside.
A close above the neckline negates the pattern but being below key moving averages does not display signs of strength.

RTY UpdateWell, small caps look bullish....
Retail numbers are supposed to be good, numbers come out before market open tomorrow. Probably should have gone long on XRT on the dip.
I assume BUD will gap up with retail tomorrow, gonna short it when it does.

RTY UpdateAs usual, small caps are the weakest, MFI already hit oversold. ES and NQ are getting close, but won;t happen until Monday.
Not sure about gap direction Monday or if RSI also need to hit oversold. Either way, the market will signal a buy on Monday.... as usual I'll wait and hope for a gap down to make the decision easier.
