#IWM Russel 2000 looking technically bullishSome real meaningful progression for the bull case in US small cap stocks.
50 dma > 200dma
Price has cleared the critical resistance level between 187-188.
Price has some short term resistance at the 38.2% fib retracement here, but it looks like we should progress to the next resistance level at the 50% fib retracement at 200.
Chart is showing a clear formation of higher swing lows and higher highs.
Hard to be bearish this chart.
Opportunity here to buy the breakout with a relatively small stop as a close below 187.50 might put the bullish case on hold.
IWM

Bunch of copy paste quotes on Fed Meeting, $DJI $NDX GREAT DAY!Apologize for the LATE post on this
We posted this elsewhere, documented, and bringing it here
----
Yesterday
So, #fed tomorrow.......
We get 25, likely rally and fade next day or few days later
We get 50, likely sell off decently & then rally
This could reverse in one day or take week or more
#FederalReserve meeting
#stocks #crypto #inflation
Done for today :) Good day overall
----
Early Today, after announcement-
Was at least expecting a pop first before the fall
Interesting day today
Maybe we get the fall and then the rally...
However how we end the day, the next day tends to be a reverse of some sort
$DJI $NDX $SPX
----
After-
For a second we though we were going to get put (sold a bunch of put options when $DJI was off 340 points and $NDX was closer to day lows) a ton of #stock ROFL
Limits being filled, not being greedy
#crypto green
US #Dollar $DXY hitting lows (did say HISTORICALLY doesn't hold)
-
We've been cautious #BULL for a bit & we need 2b weary of EUPHORIA
We're watching for that, IMPORTANT!
$VIX @ bottom trend (we'll know VERY SOON what's up)
#yield falling $TNX, 2yr not as much, hmmm
#stocks huge turnaround
#crypto as well
What about volume? Soon
----
$NDX & $DJI BUY volume is still there but it's lowering
#DJI looking GOOD atm
$NDX NO slouch testing downtrend soon
#markets ARE IRRATIONAL
Look at volume, patterns & trend!!!
----
Recent
Awesome #stock day today! Good for the week!
Raised cash again for trading
Have some longs still
$DOW $META (taking some off here), $KHC $INTC $ATVI & some others BUT aggressive TRADING still 1/3 in bonds, expire soon, & cash for tomorrow & other days
Done for day &👀direction
---
Look at $RUT $IWM
RISK is ON ON ON
Has been on
Volume is ok
#stocks have been looking ok
$DJI breaking symmetrical = continuation pattern
Staying cautious BULL!
More haters of rally = GOOD!
Keep eye on EUPHORIA!

YOU need to see this now - THE DANGER LINEThis is a wave trend indicator on the S&P 500 index that is based on relative strength with straightforward oversold or overbought conditions. Relative strength is a measure of momentum where both speed (time) and magnitude (change) is measured and plotted with simple or weighted moving averages.
What you are seeing above is a snapshot of a RSI/wave trend of the S&P 500 index based on monthly candles. Understand that it takes the measure of a month of time just to get a single plot of data and this particular snapshot represents over two decades. But right before your eyes are very clear trends. The data is just pure and simple math and math does not lie. Ignore the news. Follow price, volume, momentum.. just follow the data.
I will try not to state my opinion too much.. and just follow the data. What I see on the chart is concerning. If this decline continues over the next month or two, momentum is going to accelerate and volatility go up while the market basically crashes... i.e. if the DANGER LINE is breached. I found it odd that volatility (VIX) has been quite docile considering the amount of downside we've seen in the indices this year. That is concerning. It is entirely possible that the September thru November monthly candles are positive and this trend finds support.. and the danger line is not breached. On the flipside, this decent can continue and really pick up speed and we see a 2000-2003 correction or 2007-2009.
Here is an overlay snapshot with those corrections to similar scale. That is what could happen if the current trend continues.. we could see 12-24 months of recession and very steep drops and sharp bearish reversals. Be careful, manage risk, consider hedging certain positions, and know that you DO NOT know what is going to happen.


$IWM Hourly ChartBull Pennant Flag Pattern forming on the hourly chart with MACD cross; supported along with an incoming golden cross on the daily chart. See previous post for $IWM daily chart analysis.

This Should Scare YouWhy do you think they're pushing inflation narrative so much? Because they know greatest deflationary crash is on the HORIZON. DXY may go above 160+. This chart should scare you but warn you they are planning something VERY BIG.

Market Breadth 2023-01-23The main focus is on setups and scan outcome, that will provide viable opportunities.
Market Structure : Duration bearish market (stocks move in tandem, occasional oversold rallies).
Primary Indicator : Green (bullish continuation and bearish reversals are favorable).
Secondary Indicator : Breadth thrust 12 Jan / Countermove attempt 18 Jan. Current MMFI: 67.70.
MR10 : Bullish Continuation - Midpoint. SPY (30 MBC) - QQQ (51 MBC) - IWM (35 MBC)
20 percent study : +27/-6.
Conclusion : Bullish expansion and acceleration in last session, which seems to indicate continuation. Move is not considered at the start, neither overextended as presented from MMFI and MR10. Will run 9 million and combination scan with a positive expectation. In terms of DT will be considerate at 30-45 min of open and observe whether momentum will accelerate or not; due to intact market theme and selective gaps.

IWM/RTY levels going into MondayLooking for a test of 189.50 highs
demand below 180.15-177 area looks interesting for longs on retest

NQ levels going into MondayNeed to breach and hold 11760 or daily supply is intact
lack of strength leads buyers down to 11310 area for buyside liquidity test
above 11760 we look for sellers to step in around 11835-11890 supply area

Rolling (IRA): IWM January 20th 169 Short Put to March 31st 159... for a 1.62 credit.
Comments: My most at risk short put strike in the small caps ETF ... . Rolling it down and out to the quarterly. Collected 1.75 (See Post Below) plus the 1.62 here for a total of 3.37.


RUT @ the gate of "Havens", if rejected only "Hell" is the ALT !Golden Cross vs. Death Cross: An Overview
Technical analysis involves the use of statistical analysis to make trading decisions. Technical analysts use a ton of data, often in the form of charts, to analyze stocks and markets. At times, the trend lines on these charts curve and cross in ways that form shapes, often given funny names like "cup with handle," "head and shoulders," and "double top." Technical traders learn to recognize these common patterns and what they might portend for the future performance of a stock or market.
A golden cross and a death cross are exact opposites. A golden cross indicates a long-term bull market going forward, while a death cross signals a long-term bear market. Both refer to the solid confirmation of a long-term trend by the occurrence of a short-term moving average crossing over a major long-term moving average.
KEY TAKEAWAYS
A golden cross suggests a long-term bull market going forward, while a death cross suggests a long-term bear market.
Either crossover is considered more significant when accompanied by high trading volume.
Once the crossover occurs, the long-term moving average is considered a major support level (in the case of the golden cross) or resistance level (in the instance of the death cross) for the market from that point forward.
Either cross may occur as a signal of a trend change, but they more frequently occur as a strong confirmation of a change in trend that has already taken place.

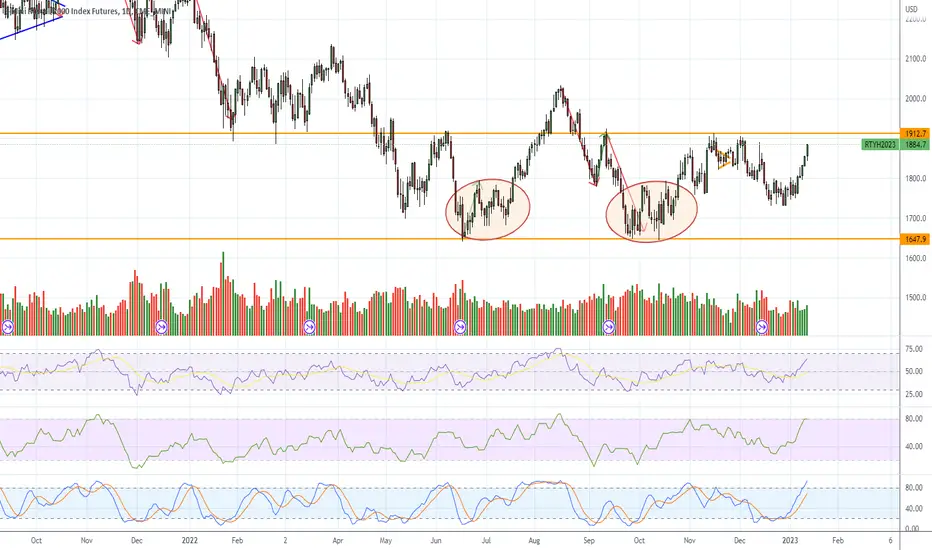
RTY UpdateRSI and MFI overbought with MFI divergence. RTY hit resistance zone. Garbage stock short squeeze appears to be over now.
ECB and Fed speakers tomorrow. Watch out.

The Schindler ratio | Recession Proof Company listAMEX:SPY
The Schindler ratio measures the company's ability to withstand economic recessions. It is calculated by dividing the company's debt-to-GDP ratio by the median debt-to-GDP ratio for the industry in the intermediate future. The Schindler ratio is an essential metric for investors, as higher ratios indicate a more extraordinary ability for the company to withstand economic downturns. Studies have shown that companies with higher Schindler ratios tend to be more recession-proof than those with lower ratios. For example, in the aftermath of the Great Recession, Catlin Group, a UK-based insurer, had a Schindler ratio of 1.07, indicating that it was more likely to survive the recession than its competitors.
The Schindler ratio can also be used to compare the relative recession-proofing of different industries. For example, in a recent study, economists found that the Schindler ratio for the insurance industry was 0.909, meaning that it was less recession-proof than the retail industry, which had a ratio of 0.879. Furthermore, the study found that the Schindler ratio was lower at the tenth quantile than at the median, indicating that the recession-proofing of the industry was more pronounced at the higher distribution levels.
In conclusion, the Schindler ratio is a valuable metric for investors to consider when assessing a company's resilience in the face of an economic recession. Companies with higher Schindler ratios tend to be more recession-proof than those with lower ratios. The Schindler ratio can also be used to compare the relative recession-proofing of different industries.
Here is list of the best recession-proof companies based on the ratio:
Berkshire Hathaway
JP Morgan Chase
Apple
Amazon
Microsoft
Google
Johnson & Johnson
Wells Fargo
Procter & Gamble
Wal Mart
Visa
ExxonMobil
Bank of America
Pfizer
Chevron
Comcast
Intel
UnitedHealth Group
Coca-Cola
Home Depot
Merck
Goldman Sachs
CVS Health
AT&T
Walgreens
McDonalds
Oracle
JPMorgan Chase
Starbucks
Lockheed Martin
United Technologies
American Express
Boeing
General Electric
Abbott Laboratories
IBM
CitiGroup
Honda Motor
Honeywell International
Lowe's
Novartis
3M
Honda

$SPY / $SPX Head and Shoulders Pattern (H&S)?Looks to me that the $SPY could be in the process of forming a H&S Pattern on the weekly chart. I’ve drawn in 2 necklines which can also be called Lines of Resistance. For now, I have an alert set at the more aggressive downtrend line. However, it would not really confirm the pattern until it is decisively above the more traditional Neckline.
I did another post regarding $SPY and stated that it would make a good case for the bottom is in if we can get over and stay over 410. (Link below).
My posts are not meant to be trade recommendations. I may or may not take trades I post. If you use any of my ideas, please make them your own to fit with your trading plan(s).

Is IWM running with the bulls ?IWM smart money been creeping into the small caps for some time now while most of the market running after TSLA the IWM been setting up for this big break out move to the up side

Opening (IRA): IWM Jan/Feb/March 169/160/155 Short PutComments: Laddering out here on weakness ... .
January 20th 169: 1.75 credit.
February 17th 160: 1.68 credit.
March 17th 155: 1.89 credit.
The weakness isn't "ideal" here, but I am relatively flat, so need to get theta out there and grinding. Will look to add at intervals over time.

RTY DailyRTY Daily MFI overbought, has room to go higher but I wouldn't chase garbage stocks at this point
More Fed talk and numbers next week.

Opening (IRA): IWM Feb/March 156/150 Short Put LadderComments: Added rungs in IWM on weakness, targeting the <16 delta strike in the shortest duration paying around 1% of the strike price in credit.
I'm doing things a little differently than last year, where I basically sold the 45 DTE weeklies (assuming they were paying around 1% of the strike price in credit), but constantly had a lot of idle buying power, which is not the "maximal deployment" I was really shooting for, so am fiddling with doing things this way instead. Doing only two rungs here, since the <16 delta strike in January isn't paying 1%, and there isn't an April yet.
February 17th 156 Short Put: 1.66 credit
March 17th 150 Short Put: 1.77 credit

Opening (IRA): IWM Feb/March 154/145 Short Put LadderComments: Squeezing in rungs where I can, targeting the <16 delta strike paying around 1% of the strike price in credit.
February 17th 154: 1.61 credit
March 17th 145: 1.45 credit

TRADE PLAN 01/06/2023 TP1> If we manage to Trade/Bid above MAIN POC 3863,
we can go for 3830 > 3841 > 3862 (Range POC) > 3878 > 3913.
>To the upside, the level I'm looking it right now is the 3860, that's the POC of those last 13 days, we need to trade/bid above so we can try to break the LIS 3913/3915, where BULLS are losing the battle.
TP2> If we manage to Trade below MAIN POC 3830,
we can visit 3826 > 3800 > 3787 > 3766.
>To the downside, the level I'm looking is 3826 (RANGE VAL), as we are already trading below 3960 12 days POC, so once we confirm below 3824, we have to break lower to find strong sellers to push below 3800, where BEARS are losing the battle.
* We are trading in this 100 points RANGE from 3800 to 3900 levels for the last 13 days or about 2 weeks,
I would say that the market structure are balanced, looking for stronger BUYERS or SELLERS around the VALUE AREAS.
Below is my previous comment from yesterday:.
For now no direction in the markets, just range trades, we should break anytime soon out of this BOX, and I was hoping that today with FOMC minutes we could go search some new levels, out of balance, but...
Mr Market had other plans, so for now lets trade the levels and see how it goes by Friday NFP.
>As we didnt break the RANGE, now its a matter of one single REPORT, NFP by tomorrow 8:30am, there's only one way to make money tomorrow, and the way is to be IN ALREADY !! The movement will be soon, and the TRADE will make it or break it bt 8:30am and will set the tone for the following weeks for a BEARISH or BULLISH continuation.
>I'm using $IWM PUT DEBIT SPREAD with 43DTE for my BEARISH BET, this is kind of a LOTTO PLAY, because the TRADE will be moving a lot in one direction, the advantage here is that if its a fake out UP, I have 43 days to manage and decide what to do with it... If you want to take a trade now, you would have to go with FUTURES, or FUTURES OPTIONS using GLOBEX .
#tradesafe #sizekills #justonemoretrade

TRADE PLAN 01/05/2023TP1> If we manage to Trade/Bid above MAIN POC 3863,
we can go for 3880 > 3913 > 3924 > 3943 > 3965 > 3979 > 3995.
>To the upside, the level I'm looking it right now is the 3860, that's the POC of those last 12 days, we need to trade/bid above so we can try to break the LIS 3913/3915, where BULLS are losing the battle.
TP2> If we manage to Trade below MAIN POC 3863,
we can visit 3841 > 3824 > 3800 > 3787 > 3766 > 3728.
>To the downside, the level I'm looking is 3824, as we are already trading below 3960 12 days POC, so once we confirm below 3824, we have to break lower to find strong sellers to push below 3800, where BEARS are losing the battle.
* We are trading in this 100 points RANGE from 3800 to 3900 levels for the last 12 days or about 2 weeks,
I would say that the market structure are balanced, looking for stronger BUYERS or SELLERS around the VALUE AREAS.
For now no direction in the markets, just range trades, we should break anytime soon out of this BOX, and I was hoping that today with FOMC minutes we could go search some new levels, out of balance, but...
Mr Market had other plans, so for now lets trade the levels and see how it goes by Friday NFP.
#tradesafe #sizekills
