7/10/22 DLTRDollar Tree, Inc.( NASDAQ:DLTR )
Sector: Retail Trade (Discount Stores)
Market Capitalization: $37.582B
Current Price: $167.36
Breakout price: $174.25
Buy Zone (Top/Bottom Range): $160.30-$130.35
Price Target: $207.00-$209.80
Estimated Duration to Target: 359-370d
Contract of Interest: $DLTR 1/20/23 175c
Trade price as of publish date: $16.40/contract
IWM

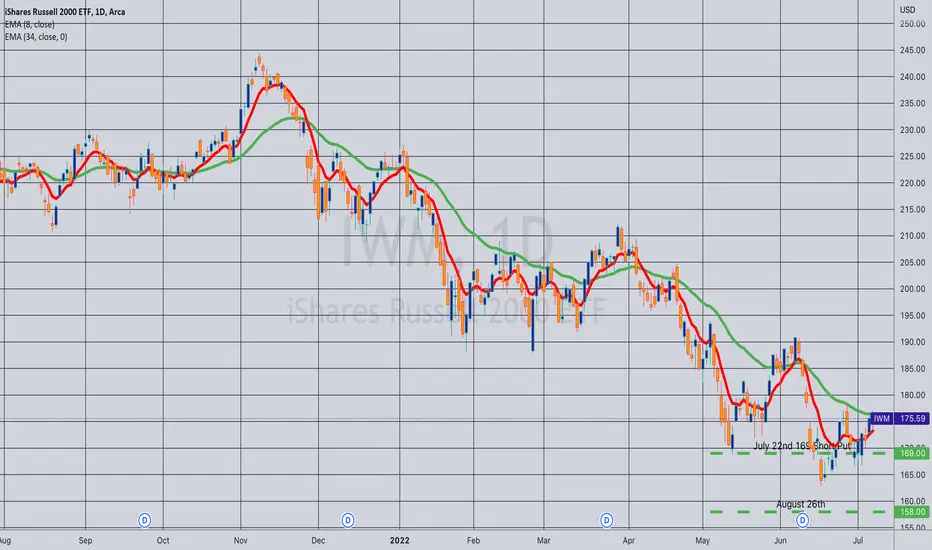
Rolled (IRA): IWM July 22nd 169 Short Put to August 26th 155... for a .25 credit.
Comments: (Late Post). Didn't collect much credit here, but this is the highest strike rung of my short put ladder and would prefer rolling it out of harm's way/to a lower cost basis strike since the market's given me the opportunity here. Total credits collected of 4.79 (See Post Below) plus the .25 here for a total of 5.04.
Rolled: IWM August 19th 158 Short Put to 162... for a .65 credit.
Comments: (Late Post). Rolled up the short put side of my short strangle to delta balance. Total credits collected of 4.73.

RTY UpdateRealigned the overlay, bad news doesn't matter the algos want the gap fill.
Probably staying out of the market for a week or two since it could wind up being a melt up, will still post updates if I wake up early enough

Opening (IRA): IWM August 19th 156 Short Put... for a 1.64 credit.
Comments: Adding some long delta back in here after taking profit on some rungs earlier. Targeting the <16 delta strike paying around 1% of the strike price in credit.

Closed (IRA): IWM July 22nd 162 Short Put... for a .67 debit.
Comments: Opened for 1.65 (See Post Below); closing out here at >50% max for a .98 ($98) profit.

RTY UpdateLOL, i slept in and missed the morning pump. I was all cash.
I think the overlay is a bit too bullish, but I also think the RTY gets a gap fill tomorrow. We could see a possible sector rotation instead of an all out rally.
My play is to short EOD tomorrow, not chasing the pump. Earnings season coming up end of month (EOM), and Fed minutes had nothing positive in it.
Remember the last time the market pumped Fed meeting minutes it was a Thu/Fri pump. I guess the same here.

RUSSELL 2000 respecting FIB levels; ABC may reach 1500 vol zone.The smallcaps Russell 2000 futures RTY1! (also the IWM etf), a leading market indicator like the transports, may complete an A=C correction ending in the volume profile zone near 1500. (IWM seems to be consolidating in tranches of 200…ex…230, 210, 190, now @ 170 & maybe 150 around 4Q2022.) This will complete the final wave 5 of C-wave.
As you can see in this weekly chart, Russell 2000 respects impt FIB levels. 2100 zone is Fib 0.236, 1900 is Fib 0.383, the current 1700 zone is Fib 0.50 & the projected 1500 bottom zone will be Fib 0.618, the most likely zone for a reversal.
THE BULLISH CASE: if Russell 2000 holds the 1700 zone, the bounce will be very quick due to the 2 LOW VOLUME zones. The target will be 2100 with some consolidation near the 1900 zone.
Not trading advice

RTY UpdateRTY MFI went oversold earlier toady though you can;t tell anymore.
In any case, someone asked me for a target, I'll give you 2. First target is the gap fill, and the pumptarded scenario is the overlay.
I am inclined to take the easy money as you guys know by now, lol.

ES and RTY MFI OversoldNQ oversold on weekly MFI and now RTY and ES MFI oversold on my short term charts.
Now that RTY is oversold, I;m really expecting a garbage stock short squeeze, lol.

7/4/22 FDXFedEx Corporation ( NYSE:FDX )
Sector: Transportation (Air Freight/Couriers)
Market Capitalization: $57.955B
Current Price: $223.61
Breakout price: $231.00
Buy Zone (Top/Bottom Range): $219.70-$198.80
Price Target: $270.00-$276.80
Estimated Duration to Target: 266-278d
Contract of Interest: $FDX 1/20/23 220c
Trade price as of publish date: $27.06/contract

7/4/22 MCDMcDonalds Corporation ( NYSE:MCD )
Sector: Consumer Services (Restaurants)
Market Capitalization: $187.076B
Current Price: $252.96
Breakout price: $252.96
Buy Zone (Top/Bottom Range): $248.35-$238.25
Price Target: $258.00-$260.50 (1st), $270.00-$275.60 (2nd), $302.60-$308.20 (3rd)
Estimated Duration to Target: 21-22d (1st), 54-61d (2nd), 150-159d (3rd)
Contract of Interest: $MCD 8/19/22 270c, $MCD 9/16/22 270c, $MCD 12/16/22 280c
Trade price as of publish date: $3.60/contract, $3.60/contract, $4.75/contract

7/4/22 AMNAMN Healthcare Services Inc. ( NYSE:AMN )
Sector: Commercial Services (Personnel Services)
Market Capitalization: $5.130B
Current Price: $114.73
Breakout price: $115.20
Buy Zone (Top/Bottom Range): $113.95-$108.40
Price Target: $120.90-$123.70
Estimated Duration to Target: 38-40d
Contract of Interest: $AMN 8/19/22 110c
Trade price as of publish date: $10.80/contract

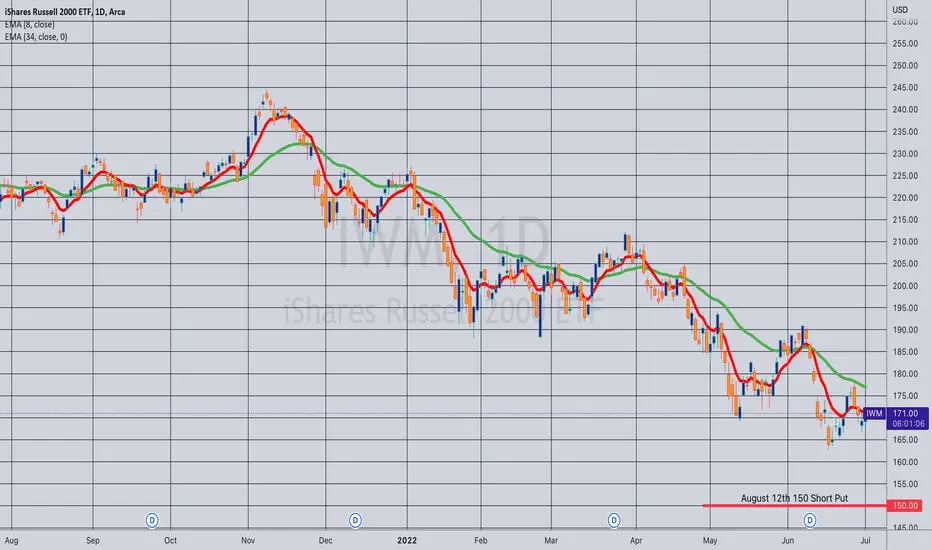
Opening (IRA): IWM August 19th 150 Short Put... for a 1.57 credit.
Comments: Targeting the <16 delta short put paying around 1% in credit in the expiry nearest 45 days to emulate dollar cost averaging into the broad market.
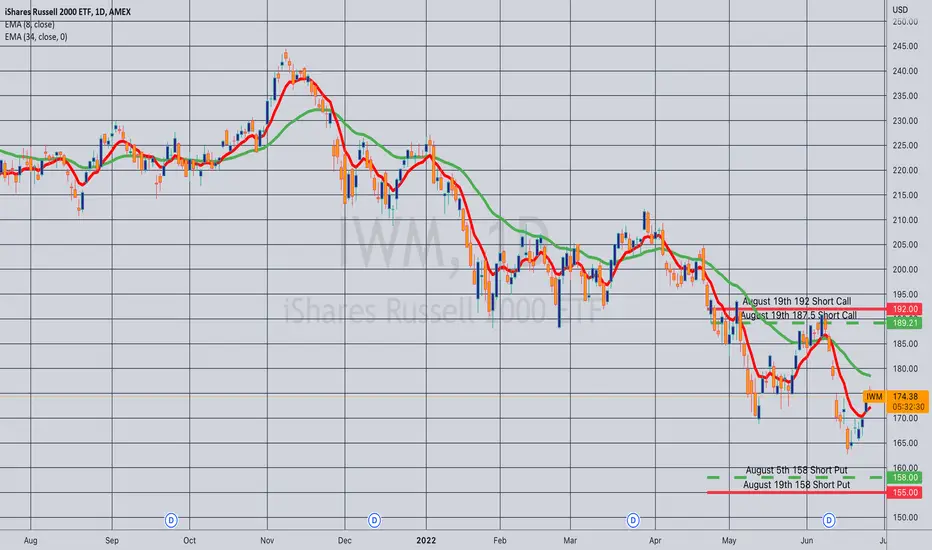
Rolling: IWM August 19th 192 Short Call to 183... for a 1.27 credit.
Comments: Delta balancing my IWM short strangle a smidge ... . Total credits collected of 4.08. End-of-day delta/theta 4.86/11.98. Will look at managing any remaining setups that are "out of kilter" on Friday.

RTY UpdateRTY still hasn;t filled the gap so despite the fact that it's overbought, I'm not feeling bearish quite yet.
As soon as this fills I think it's all over. Probably whipsaws then goes back down.

Rolling: IWM August 5th 158/187.5 to August 19th 158/192... for a .46 credit.
Comments: Locking in some realized gain and recentering risk/balancing delta. Total credits collected of 2.81. Delta/theta 2.69/10.46.
Opened (IRA): IWM August 5th 154 Short Put... for a 1.56 credit.
Comments: Adding back in some long delta here in IWM, targeting the <16 strike in the expiry nearest 45 days paying around 1% of the strike price in credit.

FED Balance sheet and Nasdaq ComparisonNASDAQ:QQQ
As you can see on the chart, FED balance sheet should be adjusted, as you it just started to go down, but QQQ already is 20% down from the top.
so obviously the bear market just started. and I expect more than 50% now. the most powerful and longest bear market of all time.
*This is my idea and could be wrong 100%

6/26/22 LTHMLivent Corporation ( NYSE:LTHM )
Sector: Process Industries (Chemicals: Specialty)
Market Capitalization: $3.922B
Current Price: $24.25
Breakout price: $25.00
Buy Zone (Top/Bottom Range): $23.70-$20.50
Price Target: $29.30-$30.80
Estimated Duration to Target: 160-171d
Contract of Interest: $LTHM 10/21/22 30c
Trade price as of publish date: $2.00/contract

6/26/22 MSTRMicroStrategy Incorporated ( NASDAQ:MSTR )
Sector: Technology Services (Internet Software/Services)
Market Capitalization: $2.321B
Current Price: $205.44
Breakout price: $222.50
Buy Zone (Top/Bottom Range): $195.30-$135.90
Price Target: $404.50-$418.10
Estimated Duration to Target: 99-103d
Contract of Interest: $MSTR 10/21/22 220c
Trade price as of publish date: $44.80/contract

6/26/22 BABAAlibaba Group Holdings Ltd. ( NYSE:BABA )
Sector: Retail Trade (Internet Retail)
Market Capitalization: $309.183B
Current Price: $117.62
Breakout Price: $120.00
Breakdown Price: $85.00
Buy Zone (Top/Bottom Range): $102.65-$87.00
Sell Zone (Top/Bottom Range): $113.80-$124.95
Price Target: $128.40-$131.70 (1st), $167.50-$171.10 (2nd), $15.70-$14.00 (3rd)
Estimated Duration to Target: 29-31d (1st), 117-124d (2nd), 340-356d (3rd)
Contract of Interest: $BABA 7/15/22 120c, $BABA 10/21/22 130c, $BABA 6/16/23 100p
Trade price as of publish date: $6.47/contract, $11.98/contract, $14.93/contract

6/26/22 PDDPinduoduo Inc. ( NASDAQ:PDD )
Sector: Retail Trade (Internet Retail)
Market Capitalization: $82.667B
Current Price: $65.96
Breakout price: $71.40
Buy Zone (Top/Bottom Range): $55.15-$31.65
Price Target: $94.60-$98.60 (1st), $115.40-$119.30 (2nd)
Estimated Duration to Target: 60-66d (1st), 120-129d (2nd)
Contract of Interest: $PDD 8/19/22 80c, $PDD 10/21/22 90c
Trade price as of publish date: $3.85/contract, $4.50/contract
