Closed: IWM July 1st 173/194 Short Strangle... for a 4.58 debit.
Comments: Plain Jane profit-taking. Collected a total of 6.33 in credits. (See Post Below). Closing out here results in a net profit of 1.75 ($175).
IWM

IWM/RUT Wyckoff Distribution is BACK!?About 3-4 months ago, I mentioned that the Russell 2k was showing signs of distribution (huge consolidation before a downtrend). I outlined where big money was selling and where they flipped short. Since the breakdown, we have seen nearly 3 months of consolidation. One could argue that the consolidation was symmetrical with higher highs and higher lows. That, my friends, would be the makings of a BEAAAAR FLAAAAG. If this bear flag correctly plays out, the target to the downside would be about 170 which is former resistance AND a previous gap. Closing above the previous local high at 205 is probably a good stop out.

6/1/22 VLOValero Energy Corporation ( NYSE:VLO )
Sector: Energy Minerals (Oil Refining/Marketing)
Market Capitalization: $52.889B
Current Price: $132.55
Breakout price: $135.90
Buy Zone (Top/Bottom Range): $128.75-$118.15
Price Target: $186.30-$189.00
Estimated Duration to Target: 314-322d
Contract of Interest: $VLO 1/20/23 145c
Trade price as of publish date: $12.45/contract

6/1/22 IWMiShares Russell 2000 ETF ( AMEX:IWM )
Sector: Miscellaneous (Investment Trusts.Mutual Funds)
Market Capitalization: $$--
Current Price: $184.26
Breakout price: $187.85
Buy Zone (Top/Bottom Range): $183.95-$168.15
Price Target: $189.60-$204.00 (1st), $249.20-$278.80 (2nd)
Estimated Duration to Target: 172-180d, 412-422d
Contract of Interest: $IWM 12/16/22 200c, $IWM 6/16/23 210c
Trade price as of publish date: $7.86/contract, $9.41/contract

6/1/22 KRESPDR S&P Regional Banking ETF ( AMEX:KRE )
Sector: Miscellaneous (Investment Trusts/Mutual Funds)
Market Capitalization: $--
Current Price: $63.44
Breakout price: $66.00
Buy Zone (Top/Bottom Range): $62.20-$56.55
Price Target: $90.00-$91.00
Estimated Duration to Target: 496-509d
Contract of Interest: $ZM 6/16/23 70
Trade price as of publish date: $4.70/contract

6/1/22 ZMZoom Video Communications, Inc. ( NASDAQ:ZM )
Sector: Technology Services (Packaged Software)
Market Capitalization: $31.645B
Current Price: $107.65
Breakout price: $127.70
Buy Zone (Top/Bottom Range): $106.60-$71.30
Price Target: $189.60-$204.00 (1st), $249.20-$278.80 (2nd)
Estimated Duration to Target: 181-186d, 300-312d
Contract of Interest: $ZM 1/20/23 125c, $ZM 6/16/23
Trade price as of publish date: $15.90/contract, $27.10/contract

Rolling: IWM July 1st 158 Short Put to July 1st 173... for a 1.64 credit.
Comments: Rolling up the short put aspect of my July 1st IWM short strangle, the short call of which is at the 194 to cut the delta/theta ratio to around 1:1. Total credits collected of 6.33.
It's now delta/theta -12.03/14.85.

$AAPL Closing the week green now whatApple after about 7 straight red weekly candles and RSI approaching over sold, got a nice and technically expected bounce this week.
Now what ?
Well, best any one can do is play it level to level since my crystal ball is broken.
150 - Big psych level here and prior support, which since broke is now resistance, could easily see rejection here , however given RSI and recent options, my bias is price may stall here, but I think we eventually break this level to the upside.
160 - My bias for a good short entry would start here - reversion to the mean of the 10wkMA and big psych level 160. This would also give the RSI time to average out and the skew pulled back from puts a bit.
167 - In my opinion anything is possible and IF price does get here I am definitely going short, with a break above this level at that point would be going long as AAPL would have reclaimed the 30wk MA and is back to an ATH scenario (again I'm not expecting this but anything is probable)
No trade for me just yet, sitting and waiting to see what next week brings.
Also not that this is something I trade off of , but retail and sentiment is now conditioned to short any rip or pop. Even the comments of Reddit, WeBull, etc. , everyone is buying puts on green days now. I would not be surprised we thus now get a more sustained rally to throw everyone long / close puts, just in time for a violent move down :).
Cheers

$POST Keep on watch (or starter )POST keep on watch for blue sky breakout, I added a starter debit spread 80/85c JUL . Option names aren't extremely liquid so would give it some time as an idea with something ITM (either naked but debit spread is more risk friendly).
Made good money on this name after a whale trade , whale is still there buying the JAN 70 calls and looks like they came back with JAN 80 calls with 383 OI.

R2K at middle of channel and 200 week MAThis is a log chart of $RUT where it has been respecting the 200 week MA for three straight weeks. It also happens to be in the middle of a huge parallel channel dating back to the GFC bottom.

5/25/22 ARAntero Resources Corporation ( NYSE:AR )
Sector: Energy Minerals (Oil & Gas Production)
Market Capitalization: $12.969B
Current Price: $41.69
Breakout price: $42.10
Buy Zone (Top/Bottom Range): $37.35-$30.90
Price Target: $56.30-$58.70
Estimated Duration to Target: 340-351d
Contract of Interest: $AR 1/19/24 50c
Trade price as of publish date: $10.00/contract

5/25/22 SBSafe Bulkers, Inc. ( NYSE:SB )
Sector: Transportation (Marine Shipping)
Market Capitalization: $571.751M
Current Price: $4.72
Breakout price: $4.85
Buy Zone (Top/Bottom Range): $4.20-$4.35
Price Target: $5.55-$6.00
Estimated Duration to Target: 287-295d
Contract of Interest: $SB 1/20/23 5c
Trade price as of publish date: $0.80/contract

5/25/22 ANAuto Nation ( NYSE:AN )
Sector: Retail Trade (Specialty Stores)
Market Capitalization: $6.427B
Current Price: $114.84
Breakout price: $118.10
Buy Zone (Top/Bottom Range): $109.60-$96.90
Price Target: $142.80-$144.00
Estimated Duration to Target: 399-407d
Contract of Interest: $AN 1/20/23 110cc
Trade price as of publish date: $20.10/contract

5/25/22 ORLYOReilly Automotive ( NASDAQ:ORLY )
Sector: Retail Trade (Specialty Stores)
Market Capitalization: $39.973B
Current Price: $615.79
Breakout price: $621.50
Buy Zone (Top/Bottom Range): $609.20-$564.80
Price Target: $782.00-$788.00
Estimated Duration to Target: 406-418d
Contract of Interest: $ORLY 11/18/22 630c
Trade price as of publish date: $49.95/contract


$SPY respecting the support line so far!Respecting the downward channel support line so far. Started taking profits on some hedges and adding to longs. Break above 403 and will add more risk long. Sold puts this morning as downside may be capped for now but that doesn't mean we necessarily rip up .
Tough market to trade that's for sure !

Rolled: IWM June 17th 165/200 Short Strangle to July 1st 158/194... for a .90 credit.
Comments: Locking in some realized gain here on this little bounce, recentering side risk, and receiving a credit all at the same time. I rolled both sides to the 16 delta strikes, so that the position is back to delta neutral.
Total credits received of 4.69, relative to a current short strangle price for the July 1st 158/194 of 3.28, so I'm up 1.41 ($141) on the position.
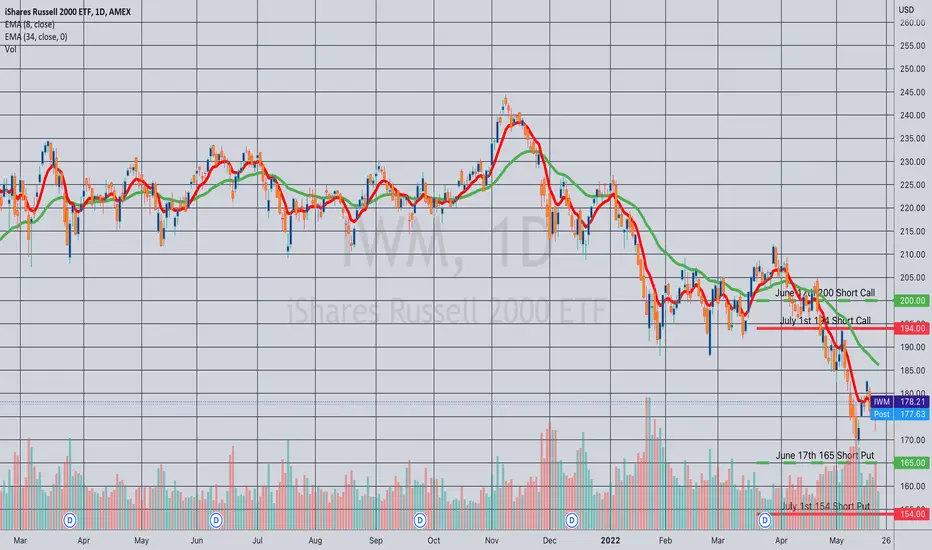
Opening (IRA): IWM July 1st 154 Short Put... for a 1.64 credit.
Comments: Keeping on keeping on ... . I don't have much IWM on, so am selling something new in the July 1st expiry, targeting the <16 delta strike that is paying at least 1% of the strike price in credit to emulate dollar cost averaging into the broad market.

Rolled: IWM June 17th 210 Short Call to 200 ... for a .56 credit.
Comments: Although the 165 hasn't been tested, the 210 is converging on worthless, so rolled it down a smidge. Total credits collected of 3.79.

$TSM Bullish call flow at support zoneLot of June 3 calls hit the tape on TSM, I like the levels here and like the probability of upside in the near term.
First PT $96, close below 87 invalidates idea
I'm long 95 6/3 calls already up 33%, with stop just above break even.

$AMC Bullish Option Flow AMC saw bullish Call buying and Put writing today, currently trading +2.7% afterhours . I followed with the 5/20 $13 calls. Bullish confluence in RSI indicator
First line of resistance $14.8/$15 zone will take profits there, with a break to upside implying a further move to $17 zone 10 day MA (blue line)
Lot of supply overhead, move will happen fast where I would suspect a typical dump.
Use a stop loss : )
Cheers

5/18/22 ALBAlbemarle Corporation ( NYSE:ALB )
Sector: Process Industries (Chemicals: Specialty)
Market Capitalization: $27.636B
Current Price: $235.98
Breakout price: $243.05
Buy Zone (Top/Bottom Range): $231.20-$210.80
Price Target: $263.40-$265.50 (1st), $288.00-$291.50 (2nd)
Estimated Duration to Target: 86-90d (1st), 159-166d (2nd)
Contract of Interest: $ALB 9/16/22 250c, $ALB 12/16/22
Trade price as of publish date: $22.20/contract, $31.05/contract

5/18/22 CFCF Industries Holdings, Inc. ( NYSE:CF )
Sector: Process Industries (Chemicals: Agriculture)
Market Capitalization: $22.623B
Current Price: $101.61
Breakout price: $109.50
Buy Zone (Top/Bottom Range): $99.80-$84.80
Price Target: $152.30-$154.00 (2nd)
Estimated Duration to Target: 187-195d (2nd)
Contract of Interest: $CF 11/18/22 105c
Trade price as of publish date: $14.10/contract
