2/13/22 LMTLockheed Martin Corporation ( NYSE:LMT )
Sector: Electronic Technology (Aerospace & Defense)
Market Capitalization: 107.893B
Current Price: $396.19
Breakout price: $396.00 (hold above)
Buy Zone (Top/Bottom Range): $384.80-$369.85
Price Target: $416.00-$420.00 (1st), $434.00-$442.00 (2nd)
Estimated Duration to Target: 103-110d (1st), 211-221d (2nd)
Contract of Interest: $LMT 6/17/22 400c, $LMT 9/16/22 400c
Trade price as of publish date: $19.40/contract, $25.30/contract
IWM

Rolling (IRA): IWM February 25th 193 Short Put to March 31st 178... for a .58 credit.
Comments: The 193 isn't at 50% max yet, but it's the highest strike I've got in my short put ladder, so taking the opportunity to both realize a little gain, strike improve, and receive a credit for doing it. Total credits collected of 2.09 (See Post Below) +.58 = 2.67 relative to a current price for the March 31st 178 of 1.93, so I've realized gains of .74 ($74) so far.

Rolling (IRA): IWM February 18th 194 Short Put to March 25th 178... for an .83 credit.
Comments: With only 7 days to go, rolling down and out to the strike paying at least 1% of the strike price in credit. Total credits collected of 3.53 (See Post Below) + .83 = 4.36 relative to the March 25th 178's current value of 1.80, so I've realized gains of 2.56 ($256) so far.

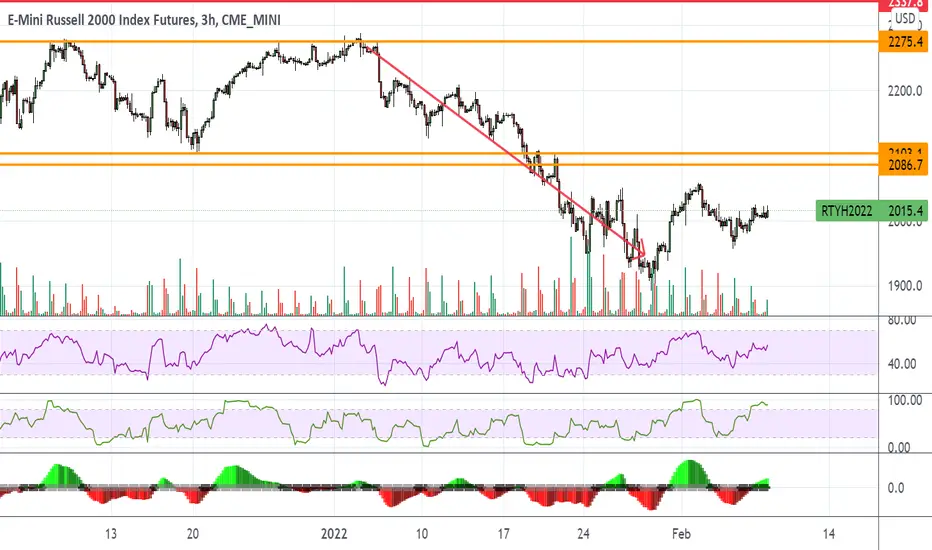
$IWM Russel 2000 - Small caps previous support now resistance?Small caps tend to lead the market. Not a great picture as we saw a strong reversal off previous support yesterday. Technically we have the 50dma trading below both the declining 200day sma and emas. The moving averages are pointing down and we are still under the anchored vwaps from the previous highs. We also seem to be forming a rising wedge formation which are usually continuation patterns in the direction of the previous trend (currently down). Not much to be bullish about in this chart, so odds are in favour of further downside, unless we can climb above a mountain of significant resistance levels above (something which seems unlikely at this stage).

IWM MAJOR UPSWING THE BEAR ENDED The wave structure has dropped in a perfect A=C From the Peak to the low 2020 . and has dropped also a near perfect FIB .382 LOOK FOR BIG RALLY IT HAS STARTED . It dropped to the panic cycle fore cast date jan 27 +or - 1

2/9/22 TECKTeck Resources Ltd. ( NYSE:TECK )
Sector: Non-Energy Minerals (Other Metals/Minerals)
Market Capitalization: 19.179B
Current Price: $35.95
Breakout price: $34.75 (hold above)
Buy Zone (Top/Bottom Range): $32.10-$29.85
Price Target: $38.20-$38.90 (2nd)
Estimated Duration to Target: 58-60d (2nd)
Contract of Interest: $TECK 5/20/22 40c
Trade price as of publish date: $1.88/contract

2/9/22 BILLBill.com Holdings, Inc. ( NYSE:BILL )
Sector: Technology Services (Packaged Software)
Market Capitalization: 25.38B
Current Price: $247.48
Breakout price: $260.00
Buy Zone (Top/Bottom Range): $222.85-$179.70
Price Target: $302.00-$309.00 (1st), $344.00-$352.00 (2nd)
Estimated Duration to Target: 36-39d (1st), 58-62d (2nd)
Contract of Interest: $BILL 3/18/22 270c, $BILL 5/20/22 300c
Trade price as of publish date: $9.50/contract, $16.00/contract

2/9/22 SBLKStar Bulk Carriers Corp. ( NASDAQ:SBLK )
Sector: Transportation (Marine Shipping)
Market Capitalization: 2.726B
Current Price: $26.66
Breakout price: $27.30
Buy Zone (Top/Bottom Range): $23.95-$21.95
Price Target: $30.70-$31.20 (3rd)
Estimated Duration to Target: 77-82d (3rd)
Contract of Interest: $SBLK 5/20/22 25c
Trade price as of publish date: $3.00/contract

2/9/22 CEIXCONSOL Energy Inc. ( NYSE:CEIX )
Sector: Energy Minerals (Coal)
Market Capitalization: 1.004B
Current Price: $29.13
Breakout price: $29.50
Buy Zone (Top/Bottom Range): $26.95-$24.05
Price Target: $32.50-$32.80 (1st), $36.20-$37.40 (2nd)
Estimated Duration to Target: 22-25d (1st), 41-46d (2nd)
Contract of Interest: $CEIX 3/18/22 25c, $CEIX 6/17/22 30c
Trade price as of publish date: $4.90/contract, $3.80/contract

1 to 1 correction complete on IWM, looking for a 5th wave and 3kSo many growth stocks look similar in that we see large flat 3 wave corrective action that appears complete to me. This could be the blow off beginning. Typical for 12 months from tightening to top. Maybe its faster this time we shall see.

DO NOT BE SHORT ANY INDEXES . I am net long 90% 90% net long option in calls still and 75 % net long the index across the board . most of my work and timing and models are in a place you DO NOT WANT TO BE SHORT AT ALL THE BLOW OFF WAVE 5

RTY Still OverboughtMFI overbought but it's still moving up. Maybe RSI needs to go overbought?
Market is just doing some weird stuff this week
IVM death cross, waiting price to challenge supply zoneI wonder if we will se a continuation of a downtrend or we will resume uptrend.
Please do not short, if short please set stop loss

Rolling: IWM February 25th 197/198 Short Strangle to March 18th... 199 short straddle.
Comments: As with my February 18th IWM tight short strangle, rolling out my February 25th to the March 18th 199 short straddle for a 4.24 credit. Total credits collected of 12.80 relative to the March 18th 199 short straddle price of 14.46, so also still slightly underwater. I'll continue naturally continue to do defensive adjustments as necessary to keep these setups from getting too directional.
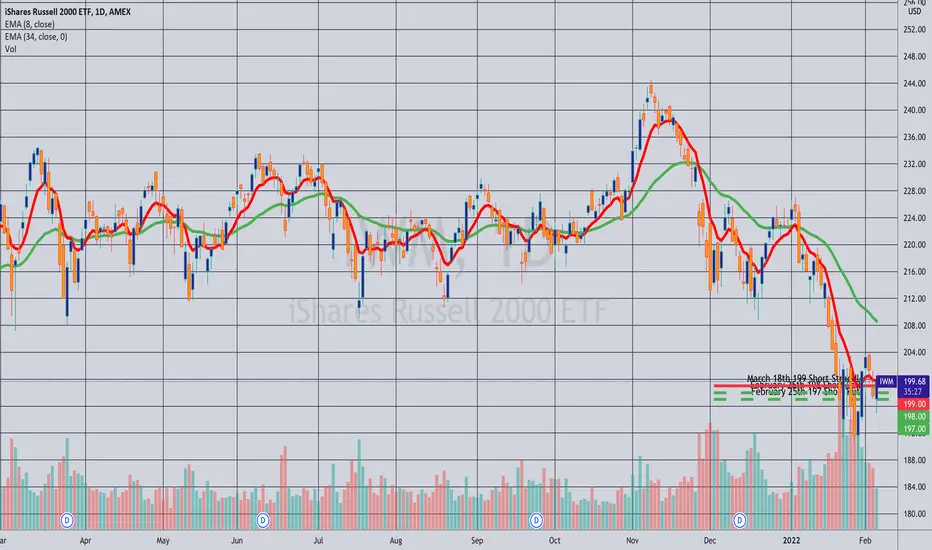
Rolling: IWM February 18th 198/197 Short Strangle to March 11th ... 199 short straddle for a 4.24 credit.
Comments: Locking in some realized gains by rolling the tight short strangle out to the March 11th 199 short straddle with 14 days to go. Total credits collected of 12.10 relative to the March 18th 199 short straddle price of 13.01, so it's still slightly underwater (credits collected are less than the current price of the setup).

Opening (IRA): IWM April 14th 160 Short Put... for a 1.73 credit.
Comments: Adding a rung out in the April monthly as part of a longer-dated strategy to emulate dollar cost averaging into the broad market using SPY, IWM, and QQQ. Targeting the strike paying at least 1% of the strike price in credit. Will generally look to roll at 50% max.

RTY MFI oversoldThe other indices are not there yet but RTY MFI is oversold.
Could be the first index to reverse, we'll see. ES and NQ charts imply a reversal either this afternoon or tomorrow but everything depends on AMZN earnings so no prdictions

Leading Indicators Reversal in ProgressInteresting... in the last couple of weeks, as the Leading Indicators signaled a retracement, it appears that it may be time for a technical bounce...
JNK broke down as expected, and exceeded target. Last week's candle had a long tail recovery, and this current week is forming a rebound.
MACD still in bear territory.
IWM, DJT and VALUG all seemed to have retraced hard, and bounced off a support. MACD crossed and still in bear territory... may not be over. sus.
TIPS failed a support and does not seem to be recovering, not bouncing for the matter. MACD appears to be recovering though. This one is rather odd, so I would just note and leave it for now.
TLT is not bullish as one would expect it to be. In fact, it looks bearish, which is favorable (bullish) for the equity markets.
VIX failed a solid break out and looks to be finding 16 again, signalling the interim volatilty is over and more bullish markets to prevail.
/HG Copper futures are held in a tight range and appear to be recovering this week - if it can hold steady and break out. MACD is not yet bullish.
Overall, the leading indicators are signalling an interim bottom. perhaps a larger than expected rebound should follow in the coming weeks...

Rolled (IRA): IWM March 11th 171 Short Put to March 18th 181... for a 1.24 credit.
Comments: After a few short days, this one's already at 50% max, so I rolled it out to 16 delta strike in the expiry nearest 45 days. Total credits collected of 2.59 (See Post Below) plus the 1.24 here or 3.83 relative to the 181 short put price of 2.13, so I've realized gains of 1.70 ($170) by rolling here.

IWM Iron Condor 183/212 Video says it all, two part trade which started as a put credit spread. Added call side for some P/L offset if we continue to move downwards.

Opening (IRA): IWM March 11th 170 Short Put... for a 2.59 credit.
Comments: Selling the weekly nearest 45 days until expiry/strike nearest 16 delta in the broad market exchange-traded fund with the highest 30-day on the board to emulate dollar cost averaging into small caps.

Opening (Margin): IWM February 18th 198/233 Short Strangle... for a 3.57 credit.
Comments: I'm pretty much in everything at the top of the exchange-traded fund board and wanted to deploy a little more buying power before the February monthly shortens too much in duration, so selling premium in the broad market exchange-traded fund with the highest background implied. 3.57 on buying power effect of 28.05 (on margin); 12.7% ROC at max; 6.4% at 50% max. Will look to take profit at 50% max; manage sides on approaching worthless/side test.
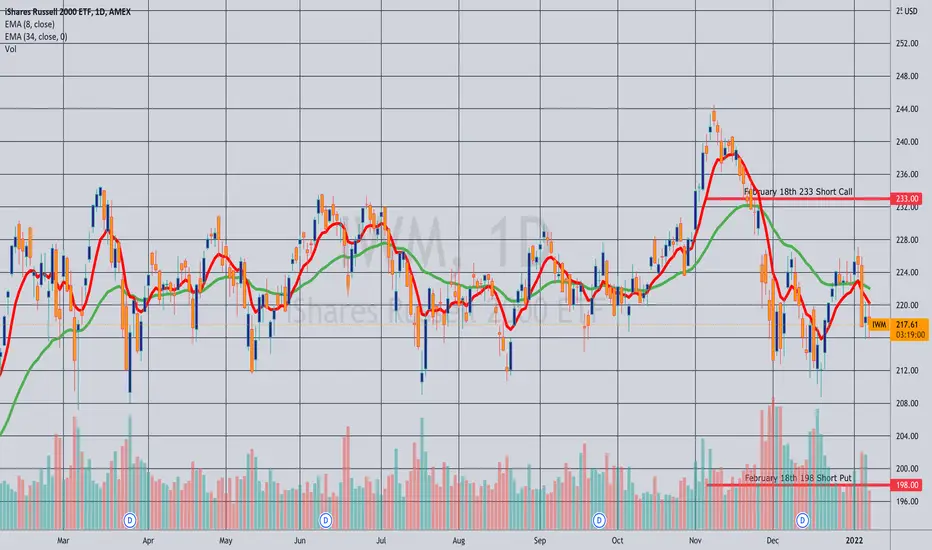
Opened: IWM February 25th 197/300 Short Strangle... for a 3.27 credit.
Comments: Here, just adding in a little IWM in the weeklies around 45 days until expiry while I wait for the March monthly to shorten in duration to do other stuff.
3.27 on buying power effect of 26.15; 12.5% ROC as a function of buying power effect (on margin); 6.3% ROC at 50% max.
