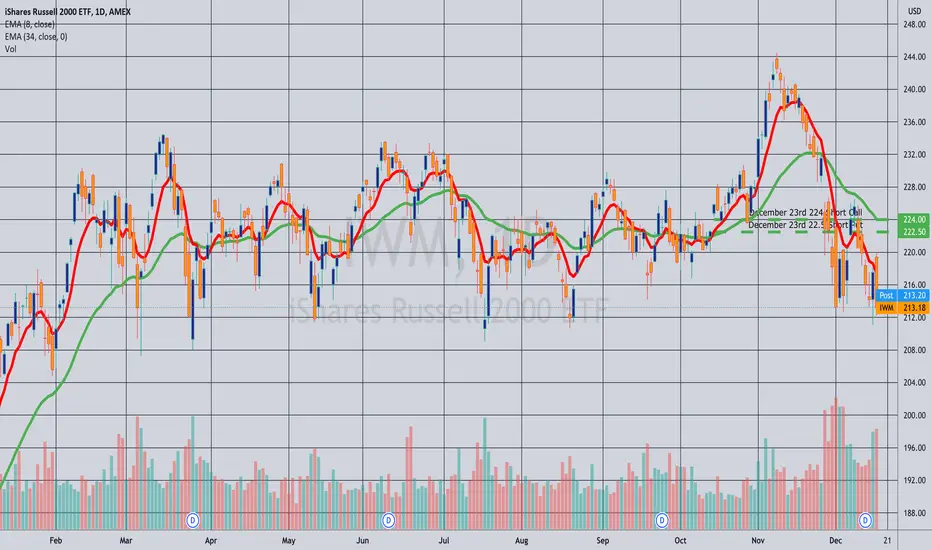
Closed: IWM December 23rd 222.5/224 Short Strangle... for a 6.39 debit.
Comments: Collected a total of 8.10 in credits for this for the original short strangle plus credits received with various adjustments. (See Posts Below). Closed it out today via good until cancelled order to take profit at what was originally my 50% maximum for the original short strangle. 8.10 - 6.39 = 1.71 ($171) profit.
IWM
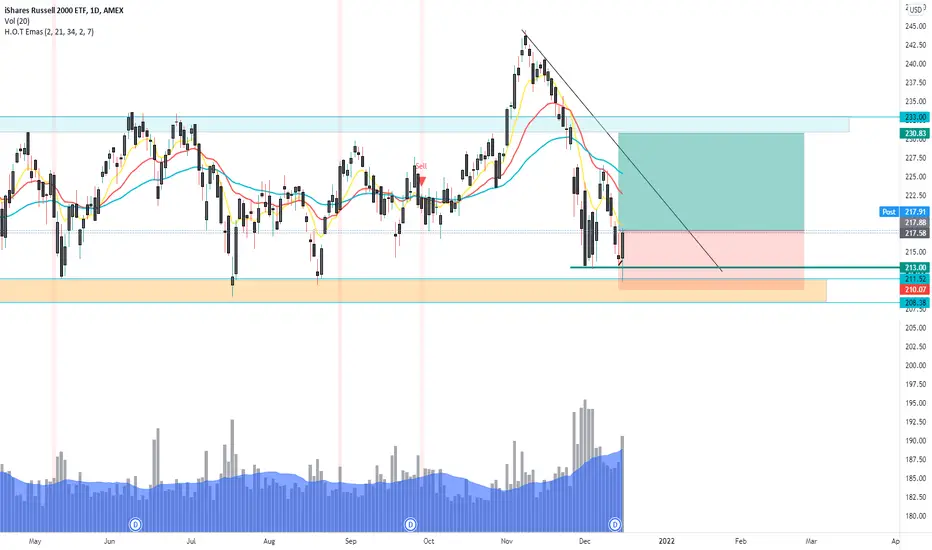
IWM support defendedToday IWM dipped once again into the support zone.
This zone has been defended for over a year now.
Every time we come down here, price rejects and run towards the upside of the channel.
For those who trade rangebound, this is a great R:R trade !
Russell 2000 touch downs.According to RSI this is a trough lands. RSI is just oversold way oversold since Covid's low.

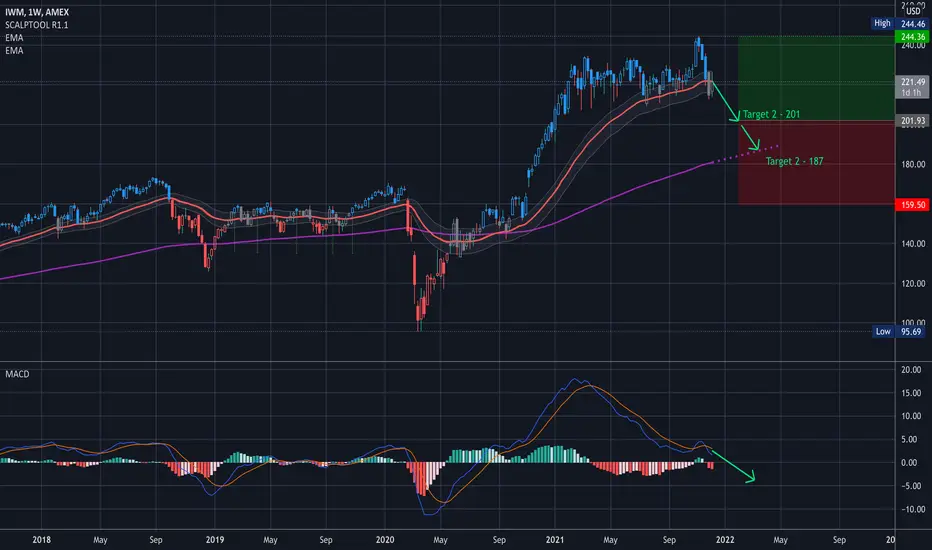
$IWM target 201$IWM target 201
Still in the neutral zone, with technicals pointing down.
Let me know your thoughts and what you guys are doing.
Have fun!!
——————
I usually trade both ways, but lately I’ve been focusing more to the downside because of how high the market is. It makes more sense to sell puts right now, and I’m usually at Target 2.
——————
I am not your financial advisor, but I will happily answer questions and analyze to the best of my ability but ultimately the risk is on you. Check out my ideas, but also do your own due diligence.
I am not a bull. I am not a bear. I just see what I see in the charts and I don’t pay too much attention to the noise in the news.
Very often you have to look at my charts from the perspective of where I’m looking to sell puts. But I also do open positions still once in a while.
If you want me to analyze any stock or ETF just leave me a comment and I’ll do it if I can.
Have fun, y’all!!
(\_/)
( •_•)
/ >🚀

IWM Get Through and Possible Double TopIWM can create a lower high low with a move to hold 220 tomorrow. Has some work to do to get over $227, but if we do it can gap fill to 228.54. Lets see if they want to double top IWM.

$RTY | WEEKLY WATCHLIST 12/13$RTY $IWM 1D
We stayed patient and got the exact pullback we were looking for. Now, we must hold $2170-2200. If we do, targeting wave 3 high of $2365 immediately.

$IWM target 201$IWM target 201
Target 1 was hit beautifully… so taking it out onto the 1W 5Y chart target 2 looks like a nice place to sell puts at this time. I would happily start a position there. Right now it’s kind of in the neutral zone, but technicals are pointing to down.
Let me know your thoughts and what you guys are doing.
Have fun!!
——————
I usually trade both ways, but lately I’ve been focusing more to the downside because of how high the market is. It makes more sense to sell puts right now, and I’m usually at Target 2.
——————
I am not your financial advisor, but I will happily answer questions and analyze to the best of my ability but ultimately the risk is on you. Check out my ideas, but also do your own due diligence.
I am not a bull. I am not a bear. I just see what I see in the charts and I don’t pay too much attention to the noise in the news.
Very often you have to look at my charts from the perspective of where I’m looking to sell puts. But I also do open positions still once in a while.
If you want me to analyze any stock or ETF just leave me a comment and I’ll do it if I can.
Have fun, y’all!!
(\_/)
( •_•)
/ >🚀
Opening (IRA): IWM January 21st 200 Short Put... for a 2.35 credit.
Comments: Premium is not as good as it was last week (current 30-day implied is at 29.6%), but the 16 delta strike's still paying better than 1% as a function of strike price. Will generally look to take profit at 50% via close or roll out.

$IWM weak this morning...We pointed it out as a short idea in the group on the live stream earlier...

Closing (IRA): IWM January 21st 188 Short Put... for a 1.37 debit.
Comments: Filled this for a 3.20 ($320) credit in Friday's weakness/high implied. (See Post Below). Out today for greater than 50% max with 44 days to go. 1.83 ($183) profit.

RUT'S RSI lowest since Covid's crash !Omicron + Speedy tapering are the keys
Or could be the start of a correction !
Already 12% down form top !

$sofii've actually been eying this stock for maybe a month now, i dont short or play puts so i waited patiently for entry. today i bought 400 shares and i am looking for this to make highs back to $22-$25. sofi seems to have a good army of investors and institutional holders. this could become a long term hold if bank charter news creeps closer anytime soon!

RTY Expansion zone - Trend TBDWe're experiencing another Expansion zone as highlighted before. Market will be deciding on Trend. Under that average price will result in a down trend.

IWM: Nasty Sell-Off Now Ready For Reversal IWM Looking to get back to 226.90 by Friday. Get over there and back to ATH after a few days of consolidation.

es\rty 12\3 update~good morning,
the bulls came in clutch in this last second to put in the fifth leg of a sloppy leading diagonal into wave (1) of a higher degree
this in my eyes confirms a break of downtrend, and the dip that comes is for buying.
expect a deeper dip than usual, as there is still very strong selling pressure, but don't be afraid of it.
i don't think we take out of the local lows.
dip might not come today, but i got a feeling we gonna get it sometime soon.

To Buy The Dip or Not To Buy The Dip - Place Your Bets!So here's your stock market correction update:
S&P 500 -5%
Nasdaq-100 -7%
Russell 2000 -13%
Pick your bottoms carefully.
I generally think that a -10% correction is a great drawdown point to start entering. But, at the same time, some individual stocks have been totally crushed from Zoom to Palantir and Peloton and more. These big, pandemic, names have been cratering 30%, 40% and 50%. Just look around the market and you will see that it is a stock picker's bear market!
The three charts above showing the indexes that I am most interested in:
S&P 500
Nasdaq-100
Russell 2000
I don't show the Dow because it is just 30 companies. There are over 5,000 stocks in the market today and even more cryptocurrencies. I really don't want to compare just 30 companies no matter how large they are. I am not interested.
All that matters now to me is where the bottom will be found.
Small caps are -13% and they tend to be my favorite playing field. So I am looking deeply into that world.
But also the Nasdaq-100 is down 7% from its highs. Let's just I've set an alert for the Nasdaq-100 and the moment it hits -10%. I think that will be an interesting choice.
Thanks for reading!
