September Effect - Up/Down/Sideways - How I'm Trading ItSummer trading is officially done and the market will be news sensitive leading up to the big bad FOMC Rate Decision on September 18.
August's monthly candle is a wild one with a massive wick to the south and the bulls pushed the SPY within a whisker of all-time highs, Dow to several all-time highs, Nasdaq into a nice bullish recovery posture, and Russell the same (higher lows).
6 Central Bank Rate Decisions in September
US News on Employment and Inflation all rolling out before the FOMC
I'd like to see a seasonal dip or pullback to offer more accumulation opportunities before a run higher. Let's see how it plays out.
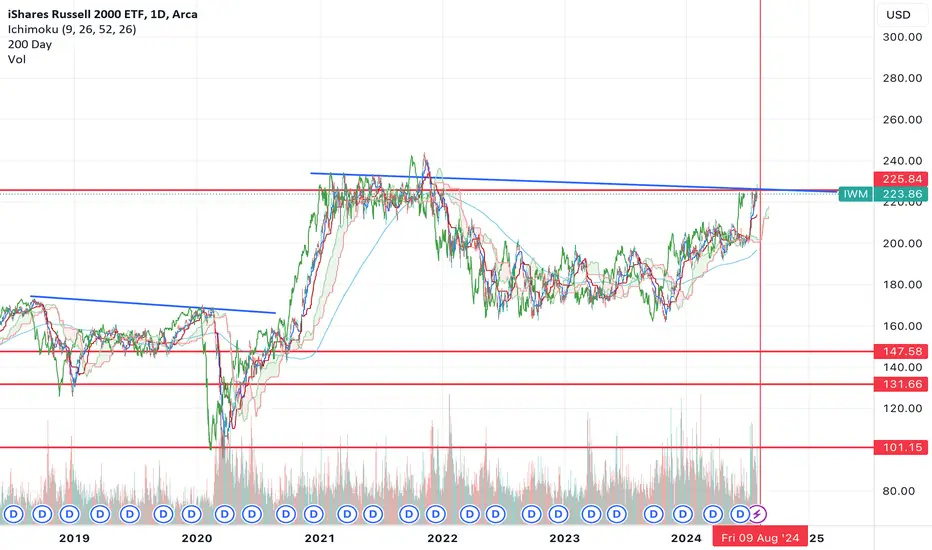
IWM

IWMTheory is we have another leg higher to IWM here before we submit to the C wave on the very HTF cycle wave 4. I suspect this will be an expanding flat and wave B will hit close to $260-$300 before wave C runs all the wave back down to $110 finishing the 4th. Then we start the HTF wave 5 to $450-$600 per share

Opening (IRA): IWM August 30th 193 Monied Covered Call... for a 191.21 debit.
Comments: I'm not quite ready to move out to the September monthly due to its duration, so doing a little something different here to attempt to milk a smidge more out of August. After having taken off my longer-dated position in profit, re-upping in 45 DTE with the short call at about the exact same delta it was at previously (around the -88).
This doesn't result in really awesome ROC metrics, but I have already grabbed the June divvy and realized gains in the August cycle, so am just looking for a little more somethin' somethin' without taking on a ton of additional risk before moving out to Sept. As usual, I'll look to take profit at 50% max; roll out for duration on side test.
Metrics:
Buying Power Effect/Break Even: 191.21
Max Profit: 1.79
ROC at Max: .936%
50% Max: .90
ROC at 50% Max: .468%

Powell Says "We're Cutting Rates" - S&P Performance MixedA nice alignment comparing SPX, NDX, RUT with the Fed Funds Rate showing when the FED raises rates and cuts rates and how it impacts the indexes.
1995 Cut Cycle - S&P Higher
1998 Cut Cycle - S&P Higher
2001 Cut Cycle - S&P Lower
2007 Cut Cycle - S&P Lower
2019 Cut Cycle - S&P Higher (but after 30-40% COVID Crash)
Nobody knows how this cycle will impact current markets, but we're about to find out. September 18 = 1st cut since 2019 (pre-COVID) and we've seen some impressive booms and busts since 2018. It's pretty remarkable really. The bull markets seem unhealthy, and the bear markets seem more violent and aggressive, but end sooner.
How great or how nasty does it get? Let's figure it out and trade accordingly.

Bulls Say "Can't Stop Won't Stop" - S&P 1% from All-Time HighsIt's as if the markets couldn't wait to open on Monday and continue what they've been doing for 9 of 11 trading days - push higher.
S&P +.96%
Nasdaq +1.31%
Dow +.58%
Russell 1.22%
For a Monday, it was a pretty directional day.
Wed-Fri is when the US news hits (FOMC Minutes, PMI, Jackson Hole, Powell Speech) so let's see if the party bus continues to rock until something forces a pause.
S&P is a mere 1% off of the all-time highs. All of these comebacks are mighty impressive considering it's the bears that usually accelerate the direction - these bulls are highly motivated.

SPY/QQQ Plan Your Trade For 8-13 : Breakaway May Pause A BitThis morning's video covers the SPY, QQQ, Gold, Bitcoin, IWM, and more.
I suspect today's Breakaway pattern will result in a moderate pause before the markets attempt to move higher.
I still believe the US markets are shifting (decoupling) from global markets a bit, and we are amid a mild "shakeout."
I believe the US markets must settle (establish a base) before the rally can continue.
Ultimately, what has changed over the past 90 days is nothing other than the fact that we have a new dynamic in US politics, and the BOJ has warned that the US Fed's rate decisions may put extreme pressure on foreign currencies.
Get ready for a bit of a sideways slide before the markets resume trending (I believe upward) again.
Get some.
#trading #research #investing #tradingalgos #tradingsignals #cycles #fibonacci #elliotwave #modelingsystems #stocks #bitcoin #btcusd #cryptos #spy #es #nq #gold

SPY/QQQ Plan Your Trade Update For 8-12: Vortex Base Building This is a quick update suggesting that the upward momentum in the US markets appears to be fairly strong. But I urge my followers to stay cautious.
The markets are not "cleared for lift-off" yet. We still have numerous Fibonacci resistance levels to break, and we could see the markets move into a broad sideways FLAG formation or break downward again to establish a deeper low.
Within this video, I share what I believe is essential for the markets to move into a confirmed "lift-off" mode.
Please be patient. If we stay patient and protect capital, there will be many opportunities for big swing trades.
Get some.
#trading #research #investing #tradingalgos #tradingsignals #cycles #fibonacci #elliotwave #modelingsystems #stocks #bitcoin #btcusd #cryptos #spy #es #nq #gold

SPY/QQQ Plan Your Trade For 8-12: Gap/Breakaway PatternWatch this video to learn why the Vortex Rally is building a base and why it is important that price stay above the 0.382 and 0.50 Fibonacci price levels as the base forms.
You'll see how these Fibonacci price structures are key components to all of my research and how to use them efficiently.
Fibonacci Price Theory teaches us price is always attempting to reach new highs and/or new lows. Additionally, price moves in only two modes : Trending or Flagging.
When you completely understand the mechanics of price and how price attempts to operate (see above), then you can pick apart charts very easily.
Currently, price is moving higher (establishing new higher highs) and may attempt to break through the downward 0.382 & 0.50 ceilings as the Vortex Rally base continues to build.
Stay cautious this week as we may see extended price volatility. There will be a huge opportunity (sweet spot) for traders over the next 60+ days to catch more of this big Vortex Rally phase.
Get some
#trading #research #investing #tradingalgos #tradingsignals #cycles #fibonacci #elliotwave #modelingsystems #stocks #bitcoin #btcusd #cryptos #spy #es #nq #gold

SPY short into the 540-543 zoneSPY short into the 540-543 zone on the first touch would most likely pay.

Members Daily Analysis Markets move higher, despite no participation from MSFT.
NVDA could rally into earnings.
IWM & KRE looking bearish.
Yield curve still inverted with lower high rejection.
SPY outperforming QQQ

SPY/QQQ Plan Your Trade 8-9 Noon Update : Possible SqueezeThis quick update covers SPY, Gold, Bitcoin, IWM, and NVDA.
Boy, what a change in price range compared to the last few weeks. Looks like ht markets have settled into a deep sleep today.
I still believe the Breakaway pattern could really make a move in the last 30 to 40 minutes of trading. A solid squeeze potential is available to price if the short trading pressure starts to unwind before the weekend.
Watch how this plays out at the end of the day, and remember that next week should see solid rallying trends.
Have a great weekend.
Get some.
#trading #research #investing #tradingalgos #tradingsignals #cycles #fibonacci #elliotwave #modelingsystems #stocks #bitcoin #btcusd #cryptos #spy #es #nq #gold

SPY/QQQ Plan Your Trade For 8-9 : Inside Breakaway VolatilityToday's Inside Breakaway pattern requires price to open within the body of yesterday's candle. Therefore, we need to see price move below $530.65 before the 930 opening bell in NY.
If this happens, then the Inside Breakaway pattern is ready to play out, and I believe we have a much stronger chance (about 75%) for the price to rally higher today (leaving only about a 25% chance for a broader market pullback).
The Current Flag formation on the SPY (and other major symbols) may present an extended range of volatility today and on Monday.
I'm suggesting today's Inside Breakaway pattern will resolve to the upside. But I'm also warning there is about a 30% chance the markets will FLUSH-OUT to the downside today before resolving back into a Bullish price trend.
The reason I'm making this suggestion/warning is because of the Flag pattern that is currently playing out. The closer we move toward the Flag Apex, the more likely we will see broader price volatility and bigger price swings.
It is very common for price to become extremely volatile near Flag Apexes. This happens because the price has been coiling into the Flag Apex range for many hours/days and potentially weeks. That energy, when released, usually prompts a fairly large volatility range.
Today, I warn that the $524-525 should act like a make-or-break level for Bullish or Bearish trending.
I cover the SPY, Gold, Bitcoin, IWM, and more in today's video.
Remember, I'm trying to teach you techniques you can use for the rest of your life while showing you what I see on these charts.
Get some.
#trading #research #investing #tradingalgos #tradingsignals #cycles #fibonacci #elliotwave #modelingsystems #stocks #bitcoin #btcusd #cryptos #spy #es #nq #gold

Long $QQQ with a target of 460Near the close on Friday after break above daily anchored vwap I did buy some weekly calls looking for a bounce towards 460
I will update and manage the position on Monday

Bought calls near end of day in $DIAWe closed above daily anchored vwap late on Friday afternoon in AMEX:DIA so I did buy calls with a target towards 404
Will manage the position Monday morning

Was that it for $IWM? Do we correct before the real run?While I do think that IWM is the place to be over QQQ , I think this run has gotten a little ahead of itself.
I noticed something interesting today on the chart, if you look at it on the 6hr or 4hr, you'll noticed we tried to break above resistance on the 9am candle, and rejected hard back below it.
This leads me to believe that the next move from here is actually down, not up.
If we zoom out, the chart looks extremely similar to how it did before the covid crash. We formed a high, went down and v bottomed up into what looked like a breakout (Feb 2020), but instead formed a double top and then rolled over hard.
Now we've pretty much made the same move, we formed a high in 2021, corrected, v bottomed in Oct 2023 and now we're at the exact level where a double top could take place from the high that was formed in Jan 2022 before price broke down.
So will we have another covid style crash that brings price back to $150 or lower? TBD, but I have that feeling...
SPY/QQQ Plan Your Trade 8-2 : Breakaway In Carryover ModeAs we have all experienced over the past 6+ days - outside news events can (and often do) disrupt my SPY Cycle Patterns.
I've talked about the Kamala-Crush event (just 10+ days ago) that disrupted market trends after Biden stepped down from running for POTUS in 2024.
I've talked about how capital would shift away from risks because of the sudden shift in expectations.
I've talked about how this shifting capital would likely benefit the US market and what I call (major global economies) - where capital may rush into areas considered safer than most of the rest of the globe.
Then, we saw a bloody attack on Israeli children turn the world upside down with the threat of an Israel/Iran conflict.
We are now seeing Japan really become an issue with the BOJ attempting to manage risk factors related to their economy.
In my opinion, the past 10+ days have been a series of minor crisis events (some a bit more major than minor) that have played out to disrupt the US/Global markets with huge volatility.
We don't normally see 2.5 to 5.5% price swings - EVER. These types of price swings are MASSIVE.
We are living through a disruption that may go down in history related to a global shift in expectations.
But, at the same time, we've only seen the US markets fall 3.5% from the recent highs. Certainly not a CRASH event (yet).
Honestly, I don't expect my SPY Cycle Pattern to play out very well today. I believe these outside factors are really driving price action and I've clearly tried to highlight that in this video.
If & when the markets settle and move back into more normal types of price trending (away from outside factors driving price trend) - the SPY Cycle Patterns will likely fall back into a better predictive mode.
As I stated, the SPY Cycle Patterns are not 100% accurate all the time. The past 10-15+ days have been very unusual (to say the least). We've seen a series of events that are really unprecedented (starting with the Kamale-Crush).
Buckle up. Today could be a very interesting day if support holds. We may see the SPY attempt to rally back above $552-554 at some point.
Get some.
#trading #research #investing #tradingalgos #tradingsignals #cycles #fibonacci #elliotwave #modelingsystems #stocks #bitcoin #btcusd #cryptos #spy #es #nq #gold

Members Daily Analysis July 31 2024Strong AMD earnings rection pushed Semis higher....NVDA was the sympathy trade whihc became the primary.
Trimmed Disney profits.
Meta strong earnings / ARM weak earnings
Oil mega reversal / Nat gas weak.
Powell Dovish/ Yields drop /

BTC...a big move is brewing!Bitcoin keeps finding sellers off the SWB:69K previous all time high 2021 resistancce.
We have not had a definitive break above that are for quiet a long time.
If the bears reject price again were likely going back to 50K.
If the bulls can get above this level and hold some weekly closes we may have a move to 95K in a few months.
Very ley price action is set to unfold.
Use caution in this are.

Weekly Recap & Market Forecast $SPX (July 21st —>July 26th)Market Forecast (Updated 07/21/2024)
**SPX**-Rotation into small caps and industrial stocks continue, which led to more sell off in SPX
We have a lot of earnings coming up this week so that can shift the direction of the market as well.
Next resistance $5655and $5688
Next support $5521 and 5428
Weekly Sentiment = Bearish
**Chart Analysis:**
()
**Dollar Index:**
DXY- Looks like the dollar index found support as the euro weakens. Which means we could see further drop in SPX.
Next resistance $105.90
Support $104
Sentiment = Crossover to upside
**Put to call Ratio: 1.31 —> 1.15
Next FOMC date: July 31, 2024**
**Fear & Greed Index: 56—>49**

Is the market crashing? The SPY and IWM have completely diverged.
On the back of rate cut expectations, many investors are piling back into the junk and high beta names.
A clear relative strength move has occurred in small caps: IWM
Whilst the megacap stocks have been sold off.
The SPY sliced through the 50 MA yesterday and cofirmed the break below.
Although this is typically bearish, we are getting into an area of oversold support.
If the SPY gaps down tomorrow, I think traders will be buying the dip with both hands.
The IWM has blasted above the 50MA, basically moving the exact opposite of the S&P500.
The question remains....are small caps going to hold their gains inside of the weekly topping tail?

MidCap vs. LargeCap. Technical & Fundamental Levels to WatchThe Russell 2000 trailed the S&P 500 significantly in 2023, gaining about 17% compared to a gain of about 24% for the large cap index. That underperformance has spilled over into 2024.
As of July 10, 2024 the Russell 2000 YTD is about Zero compared to a 17.75% gain in the S&P 500 (SPX) and 23.50 gain in Nasdaq Composite Index (IXIC).
By the way, that valuation measures make the small cap Russell 2000 index much more compelling when compared to the S&P 500.
Small caps relative to the S&P 500 on a price-to-book basis is back to where it was in 1999.
As of June 30, 2024 small caps price-to-book (P/B) ratio is 2.10, as it described on FTSE Russell 2000 Index Factsheet, while Total US Market (Russell 3000) P/B ratio is 4.42.
I'll be brief. Perhaps it will be the briefest brief over the past ten god years I'm here on TV.
DON'T MISS IT, AS IT ONE PER LIFE OPPORTUNITY.
The main technical graph is ratio between RUT (Russell 2000 Index) and S&P500 Index, and it back to support that was never seen over the past 25 years, since March 1999.
What's happened with market at these times?
⭐ Nasdaq Composite Index doubled in price over the next 12 months (March, 1999 - March, 2000), than turned 4x down.
⭐ S&P500 Index printed +20 per cents (March, 1999 - March, 2000), than turned 2x down.
⭐ March 1999 was the absolute low and was a launch point of 12 years of outperformance for Small caps vs Large caps.
Will history repeat itself..? Who knows... But personally I believe - Yes, it can.

is this signalling a market crash? The yield curve invesrion remains in place for the longest historical inversion run.
This cant be good right?
History shows once the spread between the 10 & 2 corrects back to normal / un-inverts you usually get a sell signal in the market.
We are observing a massive bullish wedge pattern unfolding and looks poised at any moment to breakout.
The un- inversion breakout usually happens quickly and sharply.

Small 'n Furious. Early 2020's Signaling A Big Midcap Run AheadThe Russell 2000 trailed the S&P 500 significantly in 2023, gaining about 17% compared to a gain of about 24% for the large cap index. That underperformance has spilled over into 2024. Year-to-date, the Russell 2000 is about 2% compared to a 7% gain in the S&P 500.
By the way, that valuation measures make the small cap Russell 2000 index much more compelling when compared to the S&P 500.
Small caps relative to the S&P 500 on a price-to-book basis is back to where it was in 1999, which was the absolute low and was a launch point of 12 years of outperformance for small caps.
As of January 31, 2024 small caps price-to-book ratio is 2.01, as it described on FTSE Russell 2000 Index Factsheet.
Like a sensationally increased shares of Supermicro NASDAQ:SMCI or e.l.f. Beauty Inc NYSE:ELF , I believe many other small cap stocks can be the best ideas for 2024, in part because of that participation in the ongoing stock market rally is improving and is no longer concentrated in just ultra-mega-cap tech stocks, like it was in 2023.
If so-called breadth improves in the stock market, then small cap stocks will catch a bid.
There are three factors will help to boost small-cap stocks in 2024.
First, fund flows into the stock market are necessary for small cap stocks to outperform. If retail funds aren't flowing into the stock market, then funds likely aren't flowing into small cap stocks.
That have changed already in late 2023 as investors start to warm up the stock market.
To be clear, let's take a look at lower technical graph, so-called "AUM", or AMEX:IWM assets under management chart, that is one of the most important ETFs metrics. While it's been correlated pretty well with IWM price action over the past two years, last December has changed the rule, as managed assets smartly jumped to almost historical highs.
Second, small cap stocks are highly levered and tend to have a higher cost of capital, so a decline or no more hikes in interest rates should benefit small cap stocks much more than large cap stocks.
To be clear, let's compare two graphs: for actual U.S. Interest Rate and Expected on Dec, 2024 Interest Rate.
Finally, an expansion in economic growth could be a "huge tailwind" for small cap stocks as they are highly exposed to the domestic economy.
An overlooked area of the stock market is set to soar in 2024 after significantly underperforming the S&P 500 last year.
In technical terms, AMEX:IWM graph is near to break its 52- and 104-weeks highs, to deliver the price 50 percent higher after a breakthrough, like it did it before, on the hottest ever edge of 2020 and 2021.
