Daily Market Update for 9/17
Summary: Indexes closed lower while volume soared on quadruple-witching Friday. Only the Russell 2000 was able to end the day with gains.
Notes
Ideas always welcome in the comments. Errors will be amended as comments on TradingView or corrected inline in my blog.
The Daily Market Update growth list is here: www.tradingview.com It is not a list of all growth stocks, and the stocks in the list are not recommendations.
-=x=-=x=-=x=-=x=-=x=-=x=-=x=-
Friday, September 17, 2021
Facts: -0.91%, Volume higher, Closing Range: 27%, Body: 71% Red
Good: Support at 15,000
Bad: Close below 21d EMA, lower high
Highs/Lows: Lower high, Lower low
Candle: Mostly red body with a small lower wick
Advance/Decline: 0.82, more declining stocks than advancing stocks
Indexes: SPX (-0.91%), DJI (-0.48%), RUT (+0.18%), VIX (+11.34%)
Sector List: Health (XLV +0.10%) and Consumer Discretionary (XLY -0.35%) at the top. Technology (XLK -1.56%) and Materials (XLB -2.06%) at the bottom.
Expectation: Sideways or Lower
-=x=-=x=-=x=-=x=-=x=-=x=-=x=-
Market Overview
Indexes closed lower while volume soared on quadruple-witching Friday. Only the Russell 2000 was able to end the day with gains.
The Nasdaq moved back below its 21d EMA with a -0.91% decline today. Volume was more than 50% over average daily volume due to index and stock options expiration. The candle is primarily red body with a small lower wick. The closing range of 27% came after a rally before close. There were more declining stocks than advancing stocks.
The Russell 2000 (RUT) was the only index to gain for the day, advancing +0.18%. The S&P 500 (SPX) declined -0.91%, and the Dow Jones Industrial Average (DJI) fell -0.48%. The VIX Volatility index rose +11.34%.
Only the Health (XLV +0.10%) sector ended the day with gains. Consumer Discretionary (XLY -0.35%) was the second-best sector but declined for the day. Technology (XLK -1.56%) and Materials (XLB -2.06%) were at the bottom of the sector list.
Michigan Consumer Sentiment data was slightly lower than expected. The US Dollar strengthened by +0.41%. Treasury Yields continue to rise as bond investors anticipate the Fed to begin tapering bond purchases later this year. Both High Yield (HYG) and Investment Grade (LQD) Corporate Bond prices tracked along with Treasury prices to close lower.
Silver dropped another -2.33%, while Gold remained about the same. Timber declined -1.40%. Aluminum is holding near record-high levels.
The put/call ratio (PCCE) rose 0.747. The CNN Fear & Greed index moved closer to Extreme Fear.
The NAAIM money manager exposure index rose to 87.02 from 84.68 the previous week.
All of the four largest mega-caps declined. Microsoft (MSFT) closed just above its 21d EMA. Amazon (AMZN) also is above its 21d EMA and 50d MA. Alphabet (GOOGL) dropped below its 21d EMA, and Apple (AAPL) moved below its 50d MA.
The mega-cap list had only ten advancing stocks for the day. Thermo Fisher Scientific (TMO) was the top gainer with a 6.49% advance. The company provided strong guidance on growth at its investor's day event. PayPal (PYPL) was at the bottom of the list, declining -2.34%. Digital Turbine (APPS) was the top gainer in the daily update growth list.
-=x=-=x=-=x=-=x=-=x=-=x=-=x=-
Looking ahead
There is not much economic news scheduled for Monday. Watch for news on the $3.5 trillion budget that will include a corporate tax hike. Also, look for any signs from the Fed that bond tapering will begin.
There are no relevant earnings reports for Monday.
-=x=-=x=-=x=-=x=-=x=-=x=-=x=-
Trends, Support, and Resistance
The Nasdaq moved back below the 21d EMA but found support above 15,000.
If the five-day trend line continues into Monday, it will end with a +0.22% gain.
The trend line from the 9/7 high points to a -0.48% decline.
The one-day trend line ends with a -0.75% decline.
-=x=-=x=-=x=-=x=-=x=-=x=-=x=-
Wrap-up
A broad sell-off comes during a week of ups and downs among robust economic data. A positive for the economy, the data raises the possibility of the Fed tapering bond purchases faster. The result is rising yields on Treasury bonds and a strong US dollar, and both apply downward pressure on big tech and growth stocks.
Add to that the potential for increased corporate taxes eating into earnings, and investors can expect further declines in the major indexes.
The expectation for Monday is sideways or lower.
Stay healthy and trade safe!
Nasdaq Composite Index CFD

Daily Market Update for 9/16
Summary: Better than expected Retail Sales data help the Consumer Discretionary sector advance to the top of the sector list. However, rising Treasury Yields subdued other sectors and sent three of the four major indexes to losses for the day.
Notes
Ideas always welcome in the comments. Errors will be amended as comments on TradingView or corrected inline in my blog.
-=x=-=x=-=x=-=x=-=x=-=x=-=x=-
Thursday, September 16, 2021
Facts: +0.13%, Volume lower, Closing Range: 85%, Body: 39% Green
Good: Higher high, good closing range
Bad: Dip below 21d EMA, low A/D ratio
Highs/Lows: Higher high, Higher low
Candle: Short body in upper half of candle, long lower wick
Advance/Decline: 0.81, more declining than advancing stocks
Indexes: SPX (-0.16%), DJI (-0.18%), RUT (-0.07%), VIX (+2.81%)
Sector List: Consumer Discretionary (XLY +0.46%) and Real Estate (XLRE +0.19%) at the top. Materials (XLB -1.08%) and Energy (XLE -1.13%) at the bottom.
Expectation: Sideways
-=x=-=x=-=x=-=x=-=x=-=x=-=x=-
Market Overview
Better than expected Retail Sales data help the Consumer Discretionary sector advance to the top of the sector list. However, rising Treasury Yields subdued other sectors and sent three of the four major indexes to losses for the day.
The Nasdaq closed the day with a +0.13% gain after dipping in the morning. The 39% green body is in the upper half of the candle, with a long lower wick representing the morning decline. After hitting the intraday low, the index rose through the afternoon to end with an 85% closing range. Volume was lower than the previous day, and there were more declining stocks than advancing stocks.
The S&P 500 (SPX) declined -0.16%. The Dow Jones Industrial Average (DJI) lost -0.18%. The Russell 2000 (RUT) fell just -0.07%. The VIX Volatility Index rose +2.81%.
Consumer Discretionary (XLY +0.46%) was at the top of the sector list after the positive Retail Sales data in the morning. Real Estate (XLRE +0.19%) was the second-best sector. Technology (XLK +0.06%) was the only other sector with gains. Materials (XLB -1.08%) and Energy (XLE -1.13%) were the worst-performing sectors for the day.
Retail Sales grew +1.8% for August, while analysts expected a -0.1% decline for the month. The Philadelphia Manufacturing Index was 30.7, compared to the 18.8 expectation. Initial Jobless Claims were slightly higher than expected but not alarming. Altogether, the data showed a more optimistic view of economic growth. However, that also raises questions of when the Fed will begin bond tapering.
Treasury Yields rose for the day, with the spread between long-term and short-term notes narrowing. Yields move opposite to prices, signaling bond investors are selling treasuries ahead of bond tapering. The US Dollar strengthened for the day, with the DXY index rising +0.42%. Silver and Gold dropped sharply, declining -3.92% and -2.26%, respectively. Crude Oil futures continue to rise.
The put/call ratio declined to 0.621 for the day. The CNN Fear & Greed index remained in the Fear Zone. The NAAIM money manager exposure index rose to 87.02 from 84.68 the previous week.
Amazon (AMZN) helped push the consumer discretionary sector higher with a +0.36$ advance today. Microsoft (MSFT) also ended the day with gains while Apple (AAPL) and Alphabet (GOOGL) declined.
Salesforce.com (CRM) was the top mega-cap for today, advancing +1.64%. Ely Lilly (LLY) was at the bottom of the list, losing -1.15%. There were plenty of winners in the daily update growth list. Palantir (PLTR) and DoorDash (DASH) topped the list with over 5.5% gains. FUTU Holdings (FUTU) and UP Fintech (TIGR) were at the bottom of the list.
-=x=-=x=-=x=-=x=-=x=-=x=-=x=-
Looking ahead
Initial Consumer Sentiment data for September, released on Friday, will hopefully improve over the previous month.
Friday is a quadruple witching day when stock futures, index futures, stock options, and index options all expire on the same day, causing a higher than average volume.
There are no relevant earnings reports for Friday.
-=x=-=x=-=x=-=x=-=x=-=x=-=x=-
Trends, Support, and Resistance
The Nasdaq dipped below the 21d EMA before rallying into the afternoon and closing higher.
If the one-day trend line continues, it shows a +0.85% gain for tomorrow.
The five-day trend line points to a -0.92% decline.
The trend line from the 9/7 high ends with a -1.25% decline for Friday.
-=x=-=x=-=x=-=x=-=x=-=x=-=x=-
Wrap-up
Bond investors saw today's positive Retail Sales data as more support for the Fed to begin bond tapering. Bond tapering will mean lower prices and higher yields, and higher yields could put some downward pressure on growth sectors.
The expectation for tomorrow is Sideways.
Stay healthy and trade safe!

Daily Market Update for 9/15Summary: Stocks rose on Wednesday after Crude Oil supplies signaled much higher demand than expected. That boosted the Energy sector by more than 3.5%, and the improved optimism drove broad gains across the market.
Notes
Ideas always welcome in the comments. Errors will be amended as comments on TradingView or corrected inline in my blog.
-=x=-=x=-=x=-=x=-=x=-=x=-=x=-
Wednesday, September 15, 2021
Facts: +0.82%, Volume lower, Closing Range: 93%, Body: 48% Green
Good: Support at 15,000 sent started a rally into afternoon
Bad: Could not break above yesterday's high
Highs/Lows: Lower high, Lower low
Candle: Long lower wick formed from morning sell, green upper body
Advance/Decline: 1.31, more advancing than declining stocks
Indexes: SPX (+0.85%), DJI (+0.68%), RUT (+1.11%), VIX (-6.58%)
Sector List: Energy (XLE +3.74%) and Industrials (XLI +1.10%) at the top. Consumer Staples (XLP +0.36%) and Utilities (XLU -0.13%) at the bottom.
Expectation: Sideways or Higher
-=x=-=x=-=x=-=x=-=x=-=x=-=x=-
Market Overview
Stocks rose on Wednesday after Crude Oil supplies signaled much higher demand than expected. That boosted the Energy sector by more than 3.5%, and the improved optimism drove broad gains across the market.
The Nasdaq gained +0.82% for the day after getting support at 15,000 in the morning. The 48% green body led to a 93% closing range. Volume was lower than the previous day, and there were more advancing stocks than declining stocks. The index could not break yesterday's high, so it is still in a downtrend, but the long lower wick formed from the bounce off 15,000 led to a rally in that afternoon that has potential.
Small-caps in the Russell 2000 (RUT) led the day, with the index advancing +1.11%. The S&P 500 (SPX) gained +0.85%, while the Dow Jones Industrial Average (DJI) climbed +0.68%. The VIX Volatility Index dropped -6.58%.
Energy (XLE +3.74%) and Industrials (XLI +1.10%) are the best sectors for the day. The only sector to decline was Utilities (XLU -0.13%). Consumer Staples (XLP +0.36%) was the second worst-performing sector but did gain for the day.
Crude Oil Inventories released at 10:30 am were -6.422m barrels compared to an expectation of -3.544m barrels showing much higher demand than forecasted.
The US Dollar weakened, with the DXY index dropping 0.20% for the day. The US 30y Treasury yield remained about the same while the 10y and 2y Treasury yields climbed. High Yield (HYG) Corporate Bond prices rose, setting a new post-pandemic high.
Crude Oil Futures rose on the news of higher demand. The improved economic outlook from higher oil demand also signals higher demand for materials. Timber, Copper, and Aluminum all climbed higher today.
The put/call ratio declined to 0.649. The CNN Fear & Greed index moved closer to Neutral but remained in Fear.
Exxon Mobil (XOM) topped the mega-cap list for the day. Comcast (CMCSA) was the second-best performer on the list after dipping yesterday. Microsoft (MSFT) gapped up in the morning and had a record close. All four largest mega-caps are above their 50d MA. Only Apple (AAPL) remains below its 21d EMA.
RobinHood (HOOD) was the top growth stock in the daily update list. The list is primarily gainers today. At the bottom of the list was Sumo Digital (SUMO).
-=x=-=x=-=x=-=x=-=x=-=x=-=x=-
Looking ahead
On Thursday, we will get Retail Sales data for August. Initial Jobless Claims will also be available in the morning.
There are no relevant earnings reports for Thursday.
-=x=-=x=-=x=-=x=-=x=-=x=-=x=-
Trends, Support, and Resistance
The Nasdaq bounced off the 15,000 support area and then rallied on optimism, generated by the Crude Oil numbers, for the remainder of the day.
If the one-day trend line continues into tomorrow, the index will gain +1.28%.
The trend line from the 9/7 top and the five-day trend line point to a -1.31% decline tomorrow.
-=x=-=x=-=x=-=x=-=x=-=x=-=x=-
Wrap-up
The Crude Oil inventories data gave investors a shot of optimism that caused a market rally today. However, only the S&P 500 was able to reverse the trend fully and beat yesterday's high. The Nasdaq remains in a downtrend, but the long lower wick shows the strong reversal off the 15,000 support area and could be enough to boost prices further tomorrow.
The expectation for tomorrow is Sideways or Higher.
Stay healthy and trade safe!

Daily Market Update for 9/14Summary: US Treasury Yields slid after the morning's consumer price index data added more confusion to the economic picture. Is lower than expected inflation a good thing or a bad thing? What does it mean for Fed monetary policy? The unanswered questions equate to risk for investors, sending them to safer bets.
Notes
Ideas always welcome in the comments. Errors will be amended as comments on TradingView or corrected inline in my blog.
-=x=-=x=-=x=-=x=-=x=-=x=-=x=-
Tuesday, September 14, 2021
Facts: -0.45%, Volume lower, Closing Range: 17%, Body: 76% Red
Good: Support above 15,000
Bad: Mostly red body, lower high, lower low. a/d ratio
Highs/Lows: Lower high, Lower low
Candle: Mostly red body with small upper and lower wicks
Advance/Decline: 0.28, more than three declining stocks for every advancing stock
Indexes: SPX (-0.57%), DJI (-0.84%), RUT (-1.37%), VIX (+0.46%)
Sector List: Health (XLV -0.02%) and Technology (XLK -0.13%) at the top. Financials (XLF -1.34%) and Energy (XLE -1.44%) at the bottom.
Expectation: Lower
-=x=-=x=-=x=-=x=-=x=-=x=-=x=-
Market Overview
US Treasury Yields slid after the morning's consumer price index data added more confusion to the economic picture. Is lower than expected inflation a good thing or a bad thing? What does it mean for Fed monetary policy? The unanswered questions equate to risk for investors, sending them to safer bets.
The Nasdaq closed with a -0.45% decline. Volume was lower than the previous day. The 76% red body represents a bearish day ending with the closing range of 17%. There were more than three declining stocks for every advancing stock.
The Russell 2000 (RUT) declined the most among the major indexes, losing -1.37% today. The Dow Jones Industrial Average (DJI) declined -0.84%. The S&P 500 (SPX) fell -0.57%.
All sectors declined today. The sectors that fell the least were Health (XLV -0.02%) and Technology (XLK -0.13%) at the top. Investors see mega-caps in the Technology sector as resilient in the current uncertain environment. The heaviest falls came at the bottom of the sector list in Financials (XLF -1.34%) and Energy (XLE -1.44%). The Financial sector is impacted by the drop in treasury yields that will lower interest rates on lending instruments.
The consumer price index (CPI) data came in at 5.3% against an expectation of 5.4%. The Core CPI data, which excludes food and energy, showed prices rose only 0.1%, where the expectation was 0.3%.
The US Dollar rose slightly by +0.05%. The US30y, US10y, and US2y treasury yields all declined significantly. High Yields Corporate Bond (HYG) prices declined while Investment Grade Corporate Bond (LQD) prices increased. Gold moved higher. Timber, Copper, and Aluminum all dropped, with Aluminum falling back from recent record highs.
The put/call ratio rose to 0.791. The CNN Fear & Greed index moved closer to Extreme Fear.
Microsoft (MSFT) was the top mega-cap for the day, gaining +0.94%. Comcast (CMCSA) declined -7.30%, putting it at the bottom of the mega-cap list. The stock sold off severely after comments made by the CFO at an investor conference that revealed a grim outlook for the third quarter.
ZoomInfo Technologies (ZI) was the top gaining growth stock for the daily update list, advancing +3.75% today and briefly breaking out from a cup-with-handle. GrowGeneration (GRWG) dropped another -8.99% today and is down over 63$ from its 52w high.
-=x=-=x=-=x=-=x=-=x=-=x=-=x=-
Looking ahead
Export and Import Price Index data and the NY Empire State Manufacturing Index will be available on Wednesday. Crude Oil Inventories will be available after the market opens.
There are no relevant earnings reports for Wednesday.
-=x=-=x=-=x=-=x=-=x=-=x=-=x=-
Trends, Support, and Resistance
The Nasdaq closed below its 21d exponential moving average but stayed above 15,000 today, which becomes a critical support area for tomorrow.
The trend line from the 9/7 high and the five-day trend line point to a -0.37% decline for Wednesday.
The one-day trend line ends with a -0.78% loss for tomorrow.
-=x=-=x=-=x=-=x=-=x=-=x=-=x=-
Wrap-up
It's interesting to see Technology outperform on a bearish day. Investors see it as a relatively safe trade during these times of uncertainty. The sector was resilient during much of the economic disruption in 2020. In addition, the lower Treasury yields and subdued inflation data are favorable for the sector, while the supply constraints impacting much of the economy are less worrisome for big tech.
If the Fed does start tapering, we can expect Treasury yields to rise, potentially a stronger dollar, and Technology becomes less attractive. At that point, we should hope other economic data such as Employment and Services activity show more positive signs for growth. Otherwise, there won't be many safe havens, and a further correction in stock markets is likely.
For tomorrow, the chart isn't showing any strength so expect a Lower move unless something changes the outlook.
Stay healthy and trade safe!

Daily Market Update for 9/13Summary: The OPEC Monthly Report provided a positive outlook for the economy, stating that oil demand would exceed pre-pandemic levels next year. That sent oil futures and the Energy sector higher and turned investors more optimistic on value stocks and the re-opening trade.
Notes
Ideas always welcome in the comments. Errors will be amended as comments on TradingView or corrected inline in my blog.
-=x=-=x=-=x=-=x=-=x=-=x=-=x=-
Monday, September 13, 2021
Facts: -0.07%, Volume higher, Closing Range: 40%, Body: 57% Red
Good: Closed above the 21d EMA
Bad: Two dips below 21d EMA, couldn't hold intraday high at open
Highs/Lows: Lower high, Lower low
Candle: Red body in upper half of candle with a long lower wick
Advance/Decline: 0.73, more declining than advancing
Indexes: SPX (+0.23%), DJI (+0.76%), RUT (+0.59%), VIX (-7.54%)
Sector List: Energy (XLE +2.87%) and Financials (XLF +1.14%) at the top. Utilities (XLU -0.18%) and Health (XLV -0.62%) at the bottom.
Expectation: Sideways or Lower
-=x=-=x=-=x=-=x=-=x=-=x=-=x=-
Market Overview
The OPEC Monthly Report provided a positive outlook for the economy, stating that oil demand would exceed pre-pandemic levels next year. That sent oil futures and the Energy sector higher and turned investors more optimistic on value stocks and the re-opening trade.
The Nasdaq closed the day with a -0.07% decline. Volume was higher than the previous day. The index started with a gain but quickly sold as investors rotated out of growth stocks and back into value stocks. The Nasdaq dipped below its 21d exponential moving average twice but was able to close above the line. The closing range of 40% is under a red body that covers more than half of the candle. There is a long lower wick with a tiny upper wick. More stocks declined than advanced on the Nasdaq. Notably, there were two advancing stocks for every declining stock on the New York Stock Exchange.
The Dow Jones Industrial Average (DJI) led the major indexes with a +0.76% gain. Small caps in the Russell 2000 (RUT) also did well, with the index gaining +0.59%. The S&P 500 (SPX) advanced +0.23%. The VIX Volatility Index (VIX) fell back -7.54%.
Energy (XLE +2.87%) was by far the top sector of the day. Financials (XLF +1.14%) ended the day in second place. Only three sectors declined, with Materials (XLB -0.02%), Utilities (XLU -0.18%), and Health (XLV -0.62%) at the bottom of the sector list.
The OPEC Monthly Report released early in the morning provided investors with a more optimistic outlook for 2022. The report said oil demand would exceed pre-pandemic levels by next year. The sent crude oil futures higher.
The US Dollar remained about the same with just a -0.03% decline in the index (DXY). The US 30y and 10y Treasury yields declined for the day. The US 2y Treasury yield remained flat. Both High Yield (HYG) and Investment Grade (LQD) bond prices increased.
Aluminum finally pulled back after nearly two weeks of exceptional gains. Timber and Copper also declined.
The Put/Call ratio (PCCE) declined to 0.673. The CNN Fear & Greed index is still in Fear but moved back toward Neutral.
Three of the four largest mega-caps gained for the day. Amazon (AMZN) was the only to decline, closing back below its 50d moving average line. The top mega-cap for the day was United Health (UNH), followed by Exxon Mobil (XOM). The daily update growth list was mostly losers for the day. Fiverr (FVRR) was the top gainer with a +4.82% advance. FUTU Holding (FUTU) was the biggest loser, declining -8.24%.
Pfizer (PFE) and Moderna (MRNA) declined after experts said booster shots were not widely required.
-=x=-=x=-=x=-=x=-=x=-=x=-=x=-
Looking ahead
Inflation data will have everyone's attention on Tuesday with the release of August's consumer price index data.
There are no relevant earnings reports for Tuesday.
-=x=-=x=-=x=-=x=-=x=-=x=-=x=-
Trends, Support, and Resistance
The Nasdaq dipped below the 21d exponential moving average twice during the session. It was able to close above the key moving average line after a late afternoon rally.
The trend line from the 9/7 high, the five-day trend line, and the one-day trend line all point to approximately the same place, which would result in a -0.42% decline tomorrow.
-=x=-=x=-=x=-=x=-=x=-=x=-=x=-
Wrap-up
Value and re-opening stocks are back in play again as investors see the OPEC projection for oil demand as a leading indicator of economic activity. However, the optimism could end tomorrow if there are surprises with the consumer price index data.
The Nasdaq chart is in a clear downtrend, but the two mid-day rally attempts give some hope for a reversal. The expectation is for Sideways or Lower tomorrow.
Stay healthy and trade safe!

Market Week in Review - 9/7/2021 - 9/10/2021Summary: This week investors wrestled with worries over a slowing economic recovery and the timing of the Fed's bond tapering this fall. The short week opened with the Nasdaq reaching a new all-time high, but prices faded from that point through the end of the week. Glitches in cryptocurrency platforms sent Bitcoin and Ethereum lower, while NFTs sent Litecoin higher.
Notes
The Market Week in Review is my weekend homework where I look over what happened in the previous week and what might come in the next week.
I occasionally have some errors or typos and will correct them in my blog or the comments on TradingView. I do not have an editor and do this in my free time.
If you find this helpful, please let me know in the comments. I am also more than happy to add new perspectives and data points if you have ideas.
The structure is the following:
A recap of the daily updates that I do here on TradingView.
View on the past week
What's coming in the next week
The Bullish View, The Bearish View
Key index levels to watch out for
Wrap-up
If you have been following my daily updates, you can skip down to "View on the Week." If not, then this first part is a great play-by-play recap for the week. Click the daily charts for more detail on sectors, indexes, and market leaders each day.
-=x=-=x=-=x=-=x=-=x=-=x=-=x=-
Tuesday, September 07, 2021
Facts: +0.07%, Volume lower, Closing Range: 52%, Body: 3% Red
Good: Higher high, higher low on increased volume
Bad: Low A/D ratio, thin red body in middle of candle signals indecision
Highs/Lows: Higher high, Higher low
Candle: Indecisive doji style candle shows buyers and sellers in market
Advance/Decline: 0.45, two declining stocks for every advancing stock
Indexes: SPX (-0.34%), DJI (-0.76%), RUT (-0.72%), VIX (+10.54%)
Sector List: Consumer Discretionary (XLY +0.29%) and Communications (XLC +0.23%) at the top. Utilities (XLU -1.32%) and Industrials (XLI -1.73%) at the bottom.
Expectation: Sideways or Lower
Markets closed the day with mixed results as investors worried about a slowing economy and uncertainty around when the Fed would start bond tapering. Big Tech were viewed as safe bets, helping keep the growth sectors and the Nasdaq in the positive for the day.
The Nasdaq ended the day with a +0.07% gain, setting a new all-time and another record close. The 3% red body rests in the middle of the candle, representing the indecision for buyers and sellers during the day. The closing range of 52% is ok. The fight between bulls and bears created a higher volume day than the previous day. There were over two declining stocks for every advancing stock.
-=x=-=x=-=x=-=x=-=x=-=x=-=x=-
Wednesday, September 08, 2021
Facts: -0.57%, Volume higher, Closing Range: 52%, Body: 48% Red
Good: Climb back to 52% closing range after morning selling
Bad: Red body, lower high and close on higher volume
Highs/Lows: Lower high, Lower low
Candle: No upper wick, half red body and half lower wick
Advance/Decline: 0.31, more than three declining
Indexes: SPX (-0.13%), DJI (-0.20%), RUT (-1.14%), VIX (-0.99%)
Sector List: Utilities (XLU +1.79%) and Consumer Staples (XLP +0.86%) at the top. Materials (XLB -0.96%) and Energy (XLE -1.28%) at the bottom.
Expectation: Sideways or Lower
Investors were cautious on Wednesday, sending indexes lower over fears of a slowing economy. Defensive sectors led the day.
The Nasdaq closed with a -0.57% loss for the day. Volume was higher than the previous day. The closing range of 52% comes below a 48% red body that occupies the upper half of the candle. There is a long lower wick and no upper wick. More than three stocks declined for every advancing stock.
-=x=-=x=-=x=-=x=-=x=-=x=-=x=-
Thursday, September 09, 2021
Facts: -0.25%, Volume lower, Closing Range: 3%, Body: 45% Red
Good: Closed above yesterday's low
Bad: Long upper wick formed after a failed morning rally
Highs/Lows: Lower high, Higher low
Candle: Inside day, long upper wick with very low closing range
Advance/Decline: 0.83, more declining stocks than advancing stocks
Indexes: SPX (-0.46%), DJI (-0.43%), RUT (-0.03%), VIX (+4.68%)
Sector List: Financials (XLF +0.29%) and Energy (XLE +0.21%) at the top. Health (XLV -1.15%) and Real Estate (XLRE -2.12%) at the bottom.
Expectation: Lower
Indexes declined today after a volatile day for bonds. Yields were rising in the early morning before a robust 30y Bond auction sent yields lower. Jobless claims data released in the morning hit another pandemic low, boosting the economic outlook but raising expectations for the Fed to start tapering bond repurchasing.
The Nasdaq closed with a -0.25% gain for the day. The index could not hold onto a morning rally that formed a long upper wick. The index faded after the rally to end the day with a 3% closing range and 45% red body. Volume was lower than the previous day, and the trading range was within the high and low of Wednesday. There were more declining stocks than advancing stocks.
-=x=-=x=-=x=-=x=-=x=-=x=-=x=-
Friday, September 10, 2021
Facts: -0.87%, Volume higher, Closing Range: 2%, Body: 91% Red
Good: Stayed above 21d EMA, but maybe just because the market closed
Bad: Failed support at 15,200, all red body candle
Highs/Lows: Lower high, Lower low
Candle: Tiny upper wick and no lower wick, all red body
Advance/Decline: 0.36, three declining stocks for every advancing stock
Indexes: SPX (-0.77%), DJI (-0.78%), RUT (-0.96%), VIX (+11.44%)
Sector List: Materials (XLB -0.02%) and Energy (XLE -0.04%) at the top. Real Estate (XLRE -1.26%) and Utilities (XLU -1.40%) at the bottom.
Expectation: Lower
Markets reacted on fears of a slowing economy while demand remains higher than supply in several parts of the economy, and indicators show continued inflation for producers. The day marks the fourth straight session of declines for equities.
The Nasdaq lost -0.87% for the day on a higher volume than average. The candle is 91% red body with a tiny upper wick and barely visible lower wick. The closing range was 2%. There were three declining stocks for every advancing stock.
-=x=-=x=-=x=-=x=-=x=-=x=-=x=-
View on the Week
This week investors wrestled with worries over a slowing economic recovery and the timing of the Fed's bond tapering this fall. The short week opened with the Nasdaq reaching a new all-time high, but prices faded from that point through the end of the week. Glitches in cryptocurrency platforms sent Bitcoin and Ethereum lower, while NFTs sent Litecoin higher.
The previous Friday's employment data provided a sour outlook for investors looking for more robust economic growth. That disappointing news came amidst continued concerns over the spread of the Delta variant of COVID, causing more headwinds for the service industry. The result was investors buying up big tech at the beginning of the week. Big tech has shown resilience to the impacts of the pandemic.
The economic data brings up another concern for investors. When will the Fed start to taper bond purchases? At first glance, one could imagine that the slowing growth in payrolls would push tapering out further.
On the contrary, statements from the Fed this week indicated that the economy had recovered enough that bond tapering could still proceed in the short term.
The result was quite a bit of volatility in Treasury bonds. Volatility in the bond market is going to lead to volatility in equities. Both increase risk for large institutional investors who are inevitably going to reduce or hedge positions. So we have a week of distribution days across all the major indexes, with the huge drops coming in mid-day reactions.
The sell-off on Friday afternoon capped the bearish week and was likely investors positioning against further volatility over the weekend.
The Nasdaq declined -1.62% for the week. Volume was higher than the previous week. The closing range is 2%, reflecting the selling on Friday afternoon that continued into the market close.
The Dow Jones Industrial Average (DJI) fell -2.15% for the week. The S&P 500 (SPX) declined -1.69%. The Russell 2000 (RUT) lost -2.81% this week.
The VIX volatility index ended the week up +27.68% over the previous week.
-=x=-=x=-=x=-=x=-=x=-=x=-=x=-
Sectors
All sectors declined this week as the S&P 500 pulled back from all-time highs. Consumer Discretionary ( XLY ) was poised to end the week with gains before losing those gains in Friday afternoon selling.
Real Estate ( XLRE ) was the worst-performing sector of the week after outperforming the market in the previous week. The sector erased all of last week's 4% gain as investors reversed the trade that is supposed to protect against inflation and benefit from low interest rates.
Utilities ( XLU ) took the top position on Wednesday but gave the lead back to Consumer Discretionary on Thursday.
-=x=-=x=-=x=-=x=-=x=-=x=-=x=-
Economic Indicators
The US Dollar (DXY) advanced +0.57% for the week.
US Treasuries 30y yield declined this week after there was high demand in an auction on Thursday. The 10y yield rose for the third week. The 2y yield also rose. The 30/5 spread declined for the week.
High Yield (HYG) Corporate Bond prices declined this week while Investment Grade (LQD) Corporate Bond prices advanced.
Silver and Gold fell for the week. Crude Oil was up but has been sticking within a bound range since the end of August. Timber declined for the week.
The big moves in commodities were Copper and Aluminum futures. Copper was up +3.46% for the week. Aluminum soared +7.05% prices and has risen 15% over the past three weeks among reported supply issues.
-=x=-=x=-=x=-=x=-=x=-=x=-=x=-
Investor Sentiment
The put/call ratio (PCCE) ended the week at 0.728. The level is not overly bearish but is much higher than a week ago when it was near 0.5.
The CNN Fear & Greed Index moved back to Fear and is approaching Extreme Fear.
The NAAIM money manager exposure index fell to 84.68 from 93.95 the previous week.
-=x=-=x=-=x=-=x=-=x=-=x=-=x=-
Stocks of the Week
This week, Apple (AAPL) led the declines for the four largest mega-caps with a -3.45% loss. The sell-off on Friday came after a judge ruled Apple must loosen the strict rules for sellers in its app store. Microsoft (MSFT) and Alphabet (GOOGL) also ended the week with losses. The three stocks moved below their 21d exponential moving average on the daily chart but remained above the 10w moving average on the weekly chart. Amazon (AMZN) also declined but is trading above these moving averages for now.
Lululemon (LULU) climbed 14% intraday on Thursday before ending the week with a 10% gain. The company smashed earnings expectations and improved its outlook for the remainder of the year.
UP Fintech (TIGR) missed earnings expectations in their report this week but continues to impress investors with strong growth and potential for growth in the future. The stock was up 18% intraday on Friday before closing, with an 8.59% gain for the day.
Peloton (PTON) gained 16% for the week after announcing its private-label apparel brand. The news came on Wednesday, sending the stock 9% and 6% the following two days.
SUMO Digital dropped -14.91% this week despite beating revenue and earnings expectations this week. Analysts downgraded the stock because growth projections were primarily focused on one large customer. The stock is down 60% from its all-time high set in January of this year.
DraftKings (DKNG) and Penn National Gaming (PENN) continue to climb as the college and professional football seasons get underway, with many stadiums allowing near full capacity and bringing some added excitement back to the games and sports betting.
-=x=-=x=-=x=-=x=-=x=-=x=-=x=-
Cryptocurrency
Bitcoin (BTCUSD) and Ethereum (ETHUSD) dropped sharply this week, declining -11.13% and -13.88% after the rollout of digital currency in El Salvador hit snags among glitches in major trading platforms such as Coinbase (COIN). Coinbase was also down nearly 11% for the week.
Litecoin (LTCUSD) got a boost, advancing +33.14% on the excitement of non-fungible tokens launching on the platform.
-=x=-=x=-=x=-=x=-=x=-=x=-=x=-
The Week Ahead
Monday
OPEC's Monthly report is due on Monday morning. The Federal Budget Balance comes in the afternoon.
Oracle (ORCL) and H&R Block (HRB) report earnings on Monday.
Tuesday
Inflation data will have everyone's attention on Tuesday with the release of August's consumer price index data.
There are no relevant earnings reports for Tuesday.
Wednesday
Export and Import Price Index data and the NY Empire State Manufacturing Index will be available on Wednesday. Crude Oil Inventories will be available after the market opens.
There are no relevant earnings reports for Wednesday.
Thursday
On Thursday, we will get Retail Sales data for August. Initial Jobless Claims will also be available in the morning.
There are no relevant earnings reports for Thursday.
Friday
Initial Consumer Sentiment data for September, released on Friday, will hopefully improve over the previous month.
There are no relevant earnings reports for Friday.
-=x=-=x=-=x=-=x=-=x=-=x=-=x=-
The Bullish Side
Investors have been dealing with worries over bond tapering for months. Good and bad economic news has had opposite impacts on markets as investors consider that the Fed might slow bond purchases quicker than previously expected. Each time that has caused a dip in the major indexes that recovers in the following week. While sentiment indicators show fear in the market, the market continues to climb higher on those fears.
Economic growth is being held back not by a lack of demand but a lack of supply across many parts of the economy. The labor market, raw materials, and transportation are all holding back the market from meeting demands. The only place not seeing a high demand now are pandemic-vulnerable segments in the service industry. The market will figure out how to meet demand, and the economy will move forward.
-=x=-=x=-=x=-=x=-=x=-=x=-=x=-
The Bearish Side
The pending Fed bond purchase taper could be another painful lesson in how bond volatility impacts equity markets. Treasury yields will rise through the end of the year and potentially have an impact similar to when they rose in the first quarter. Expect a series of rotations as investors rebalance portfolios in anticipation of the changing dynamic.
-=x=-=x=-=x=-=x=-=x=-=x=-=x=-
Key Nasdaq Levels to Watch
This week, the Nasdaq set another all-time high but closed the week lower, resting just above the 21d exponential moving average.
On the positive side, the levels are:
The 10d moving average is at 15,268.34.
A new all-time high was set on Monday at 15,403.44.
The index met several days of resistance around 15,400.
15,500 may be the next area of resistance.
On the downside, there are a few key levels:
The low of the week is 15,111.31, just below Friday's close.
The 21d EMA is at 15,081.46.
15,000 is an area of support.
The 50d MA is at 14,825.85.
14,423.16 is the low of the most recent pullback.
14,200 remains a critical level if the index moves downward.
14,000 has been an area of support/resistance.
There is a pivot at 13,903.73.
A further pullback would likely hit the 200d moving average at 13,771.69. The index hasn't approached this line since rising above it in April 2020.
-=x=-=x=-=x=-=x=-=x=-=x=-=x=-
Wrap-up
September looks like it will live up to its reputation as the most bearish month of the year. The 2020 September correction took the Nasdaq to a 12% decline. It looks like this month will be a more typical 5-6% dip taking us back to the 14,500 area before getting support. Of course, some economic news could turn that around.
I don't think we are going to see a more severe correction at this point. Even when the Fed starts tapering, they will not be shutting off purchases all at once. It's a taper, not a termination. Interest rate hikes are still far in the future. Using lower borrowing rates on top of high cash accounts, Corporations will spend to meet high demands in the economy. Eventually, supply chain issues will diminish, and companies will show improving P/E ratios, allowing investors to be less concerned about an extended stock market.
Good luck, stay healthy, and trade safe!

NDX Smaller Pullbacks over the past year - This Time Different?I'm not sure either way.
Just sharing my chart.

Daily Market Update for 9/10Summary: Markets reacted on fears of a slowing economy while demand remains higher than supply in several parts of the economy, and indicators show continued inflation for producers. The day marks the fourth straight session of declines for equities.
Notes
Ideas always welcome in the comments. Errors will be amended as comments on TradingView or corrected inline in my blog.
-=x=-=x=-=x=-=x=-=x=-=x=-=x=-
Friday, September 10, 2021
Facts: -0.87%, Volume higher, Closing Range: 2%, Body: 91% Red
Good: Stayed above 21d EMA, but maybe just because the market closed
Bad: Failed support at 15,200, all red body candle
Highs/Lows: Lower high, Lower low
Candle: Tiny upper wick and no lower wick, all red body
Advance/Decline: 0.36, three declining stocks for every advancing stock
Indexes: SPX (-0.77%), DJI (-0.78%), RUT (-0.96%), VIX (+11.44%)
Sector List: Materials (XLB -0.02%) and Energy (XLE -0.04%) at the top. Real Estate (XLRE -1.26%) and Utilities (XLU -1.40%) at the bottom.
Expectation: Lower
-=x=-=x=-=x=-=x=-=x=-=x=-=x=-
Market Overview
Markets reacted on fears of a slowing economy while demand remains higher than supply in several parts of the economy, and indicators show continued inflation for producers. The day marks the fourth straight session of declines for equities.
The Nasdaq lost -0.87% for the day on a higher volume than average. The candle is 91% red body with a tiny upper wick and barely visible lower wick. The closing range was 2%. There were three declining stocks for every advancing stock.
The Russell 2000 (RUT) led the losses for the day with a -0.96% decline. The S&P 500 (SPX) and Dow Jones Industrial Average (DJI) lost -0.77% and -0.78%. The VIX Volatility Index (VIX) rose +11.44%.
All sectors declined today. Materials (XLB -0.02%) and Energy (XLE -0.04%) performed the best while Real Estate (XLRE -1.26%) and Utilities (XLU -1.40%) were at the bottom of the sector list. It's notable that after 13:00, when the afternoon selling began, Utilities and Consumer Staples outperformed the other sectors.
Producer price index data was higher than expected, showing that inflation will be here for a while. The indicator is a good forward predictor of inflation as higher producer prices get passed along to consumers. The US Dollar strengthened, and Treasury Yields rose after the data was released. The dollar index advanced +0.13%. Both High Yield (HYG) and Investment Grade (LQD) Corporate Bond prices declined for the day.
Aluminum continued its climb, gaining over 7% this week. Copper is also starting to climb sharply, advancing +3.34% for the day. Timber has been on a decline this week and lost another -0.32% on Friday. Crude Oil Futures are still bouncing inside a range since the end of August.
The put/call ratio rose to 0.729 as investors became a bit more bearish on Friday. The CNN Fear & Greed index moved well into the Fear area, approaching Extreme Fear.
Apple (AAPL) lost -3.31% today after a judge ruled that the company must make the rules in its app store more flexible. Microsoft (MSFT) and Alphabet (GOOGL) joined Apple with declines that took them below their 21d EMA. Amazon (AMZN) declined as well but remained above its key moving average lines.
Nvidia (NVDA) topped a shortlist of mega-caps that gained for the day, advancing +1.36%. Apple was the worst-performing mega-cap, followed by United Health (UNH) and Tesla (TSLA).
UP Fintech (TIGR), Peloton (PTON), and Zynga (ZNGA) topped the daily update growth list with more than 6% gains each. Investors forgave UP Fintech for missing expectations as the company still grew sales almost 100% year over year, and the outlook appears promising. After two analyst downgrades, Sumo Digital (SUMO) was at the bottom of the list with a +9.49% decline. Earnings were good, but the growth outlook was driven mainly by a single large customer.
-=x=-=x=-=x=-=x=-=x=-=x=-=x=-
Looking ahead
OPEC's Monthly report is due on Monday morning. The Federal Budget Balance comes in the afternoon.
Oracle (ORCL) reports earnings on Monday.
-=x=-=x=-=x=-=x=-=x=-=x=-=x=-
Trends, Support, and Resistance
The Nasdaq lost support at 15,200 and sold off in the afternoon, closing above its 21d exponential moving average. The move had the feeling it would have kept going if the closing bell didn't ring.
The index would need to climb +2.73% on Monday to get back to the trend line from the 8/19 low.
The five-day trend line, which is in decline, ends with a +0.57% gain for Monday.
If the one-day trend continues, the index will decline another +0.62% to start next week.
-=x=-=x=-=x=-=x=-=x=-=x=-=x=-
Wrap-up
The sour mood for the market in the morning seemed to change around mid-day, but then investors turned defensive again in the afternoon. That sent indexes lower. Although defensive sectors were at the bottom of the daily sector list, they outperformed the other sectors in the afternoon selling.
The question is whether the bearish mood in the afternoon is just defense heading into the weekend while COVID fears continue to rise. Or will markets catch a bottom here, and investors buy the dip to start the week? Based on the chart, I expect Lower on Monday, with little economic news to change the mood.
Stay healthy and trade safe!

IXIC (Nasdaq) - Journal and Projection Entry - 9.10.21
My projection hit within my time-line. Probably see more selling with market then bouncing beginning of the week.
(Opinion only)

Market correction just started.
as you can see, the line has broken.
there is week support line near 15110, but it's also nearly about to break soon.

Daily Market Update for 9/9Summary: Indexes declined today after a volatile day for bonds. Yields were rising in the early morning before a robust 30y Bond auction sent yields lower. Jobless claims data released in the morning hit another pandemic low, boosting the economic outlook but raising expectations for the Fed to start tapering bond repurchasing.
Notes
Ideas always welcome in the comments. Errors will be amended as comments on TradingView or corrected inline in my blog.
-=x=-=x=-=x=-=x=-=x=-=x=-=x=-
Thursday, September 09, 2021
Facts: -0.25%, Volume lower, Closing Range: 3%, Body: 45% Red
Good: Closed above yesterday's low
Bad: Long upper wick formed after a failed morning rally
Highs/Lows: Lower high, Higher low
Candle: Inside day, long upper wick with very low closing range
Advance/Decline: 0.83, more declining stocks than advancing stocks
Indexes: SPX (-0.46%), DJI (-0.43%), RUT (-0.03%), VIX (+4.68%)
Sector List: Financials (XLF +0.29%) and Energy (XLE +0.21%) at the top. Health (XLV -1.15%) and Real Estate (XLRE -2.12%) at the bottom.
Expectation: Lower
-=x=-=x=-=x=-=x=-=x=-=x=-=x=-
Market Overview
Indexes declined today after a volatile day for bonds. Yields were rising in the early morning before a robust 30y Bond auction sent yields lower. Jobless claims data released in the morning hit another pandemic low, boosting the economic outlook but raising expectations for the Fed to start tapering bond repurchasing.
The Nasdaq closed with a -0.25% gain for the day. The index could not hold onto a morning rally that formed a long upper wick. The index faded after the rally to end the day with a 3% closing range and 45% red body. Volume was lower than the previous day, and the trading range was within the high and low of Wednesday. There were more declining stocks than advancing stocks.
The Russell 2000 (RUT) started the day outperforming the other indexes, climbing over 1% in the morning. But two sell-offs, one after the 30y auction and the other later in the afternoon, erased those gains ending the day with a -0.03% decline for the small-cap index. The S&P 500 (SPX) declined -0.46%, dragged down by big tech. The Dow Jones Industrial Average (DJI) lost -0.43%.
Three cyclical sectors, Financials (XLF +0.29%), Energy (XLE +0.21%), and Materials (XLB +0.04%), were the only sectors to end the day with gains. Defensive sectors moved to the bottom of the list, with Health (XLV -1.15%) and Real Estate (XLRE -2.12%) having the worst performance.
Initial jobless claims came in better than expected, whereas continuing jobless claims were slightly worse than expected. Crude Oil Inventories showed less demand than forecast. The 30y Bond Auction was the day's big news, with high demand sending yields across all Treasuries lower. It could be that bond investors are moving to US Treasuries as the ECB begins tapering emergency bond purchases in Europe.
The US Dollar Index (DXY) dropped -0.20% for the day while long- and short-term Treasury yields declined. The US Dollar started the day OK but then weakened throughout the morning. It regained some of the loss after the strong 30y bond auction. Both High Yield (HYG) and Investment Grade (LQD) bond prices increased for the day.
Aluminum futures continue to soar higher with another +1.62% gain today. Timber is in its third day of decline. Copper has been bouncing up and down in a bound trading range since the end of August.
The put/call ratio declined to 0.597 for the day. The CNN Fear & Greed index moved further into the fear territory. The NAAIM money manager exposure index fell to 84.68 from 93.95 the previous week.
All four of the largest mega-caps declined today. Microsoft (MSFT) closed below its 21d exponential moving average lien for the first time since June. The other three are still trading above their key moving average lines. Nike (NKE) was the top-performing mega-cap for the day. Most mega-caps declined for the day, with health services companies Johnson & Johnson (JNJ) and Eli Lilly (LLY) performing the worst.
Growth stocks in the daily update list did reasonably well today. Lululemon (LULU) was a top performer, gaining over 10% after smashing earnings expectations and improving outlook in its earnings call yesterday. Shares of Peloton (PTON) were up almost 10% after announcing its private-label clothing brand.
-=x=-=x=-=x=-=x=-=x=-=x=-=x=-
Looking ahead
We will get a forward-looking update on inflation with the Producer Price Index data in the morning.
Kroger (KR) and UP Fintech (TIGR) release earnings on Friday.
-=x=-=x=-=x=-=x=-=x=-=x=-=x=-
Trends, Support, and Resistance
The Nasdaq attempted a rally in the morning before dipping below 15,300 again.
The trend line from the 8/19 low points toward a +2.00% gain for Friday.
The five-day trend line leads to a +0.19% gain.
The one-day trend line points to another -0.45% decline to end the week.
-=x=-=x=-=x=-=x=-=x=-=x=-=x=-
Wrap-up
Treasury yields swung up and down today. They rose slightly before the jobless claims data, then dropped sharply during the 30y bond auction before recovering a bit before the market closed. There will be more volatility as investors change their assessment of when the Fed will begin tapering bond purchasing programs. Once the tapering begins, its expected yields will continue to rise until the end of the year.
Equity markets haven't reacted well during volatility in bonds and the volatility today reversed the morning rally. With the long upper wick and low closing range, the expectation is for Lower tomorrow.
Stay healthy and trade safe!

Daily Market Update for 9/8Summary: Investors were cautious on Wednesday, sending indexes lower over fears of a slowing economy. Defensive sectors led the day.
Notes
Ideas always welcome in the comments. Errors will be amended as comments on TradingView or corrected inline in my blog.
-=x=-=x=-=x=-=x=-=x=-=x=-=x=-
Wednesday, September 08, 2021
Facts: -0.57%, Volume higher, Closing Range: 52%, Body: 48% Red
Good: Climb back to 52% closing range after morning selling
Bad: Red body, lower high and close on higher volume
Highs/Lows: Lower high, Lower low
Candle: No upper wick, half red body and half lower wick
Advance/Decline: 0.31, more than three declining
Indexes: SPX (-0.13%), DJI (-0.20%), RUT (-1.14%), VIX (-0.99%)
Sector List: Utilities (XLU +1.79%) and Consumer Staples (XLP +0.86%) at the top. Materials (XLB -0.96%) and Energy (XLE -1.28%) at the bottom.
Expectation: Sideways or Lower
-=x=-=x=-=x=-=x=-=x=-=x=-=x=-
Market Overview
Investors were cautious on Wednesday, sending indexes lower over fears of a slowing economy. Defensive sectors led the day.
The Nasdaq closed with a -0.57% loss for the day. Volume was higher than the previous day. The closing range of 52% comes below a 48% red body that occupies the upper half of the candle. There is a long lower wick and no upper wick. More than three stocks declined for every advancing stock.
The Russell 2000 (RUT) continues to underperform this week with a -1.14% decline today. The S&P 500 (SPX) declined -0.13%. The Dow Jones Industrial Average (DJI) fell -0.20% and closed just above its 50d moving average line. The VIX Volatility Index declined -0.99% after rising 10% yesterday and another 8% intraday today.
Defensive sectors led today, with Utilities (XLU +1.79%) topping the sector list and Consumer Staples (XLP +0.86%) in second place. Materials (XLB -0.96%) and Energy (XLE -1.28%) were at the bottom of the list. Of the growth sectors, only Consumer Discretionary (XLY +0.11%) ended the day in the positive. Industrials (XLI +0.14%) gained today after a considerable selloff yesterday.
It was not much of a surprise, but the JOLTS Job Openings data came in higher than expected. Given the slowing growth in payrolls revealed last week, it's becoming clear that there is a supply issue in the labor force, not a demand issue. That may change this week with Federal Unemployment Benefits ending, but there are no guarantees there.
The US Dollar strengthened today with a +0.19% gain in the currency index (DXY). The US Treasury 10y note auction passed without any surprises. Yields on long-term and short-term Treasuries declined after spiking yesterday. High Yield (HYG) and Investment Grade (LQD) Corporate Bond prices both increased. Aluminum futures continue to soar, with companies reporting the high cost of acquiring the metal needed in the manufacturing and packaging of consumer goods.
The put/call ratio (PCCE) rose slightly to 0.610. The CNN Fear & Greed index moved into Fear but remained near Neutral.
Apple (AAPL) declined after hitting a record close yesterday. Microsoft (MSFT) continues to test its 21d exponential moving average line but closed with a slight gain today. Mastercard (MA) was the top mega-cap of the day. PayPal (PYPL) was at the bottom of the mega-cap list. The company announced an acquisition of Japanese buy-now, pay-later company Paidy. Alibaba (BABA) was also at the bottom of the list after topping the list yesterday.
Not many stocks in the daily update growth list gained today. DoorDash (DASH) was at the top of the list with a 1.93% gain. Sumo Logic (SUMO) declined -8.29% to end up at the bottom of the growth list. Lululemon (LULU) was up nearly 14% in after-market trading on a huge earnings beat and improved outlook.
The Fed's John Williams said the economy was still on track for the Fed to begin bond tapering this year. However, he acknowledged that additional hurdles need to pass before they commit to tapering.
-=x=-=x=-=x=-=x=-=x=-=x=-=x=-
Looking ahead
The weekly Initial and Continuing Jobless Claims report come on Thursday. Crude Oil Inventories will get an update after the market opens. The Fed's Mary Daly speaks in the morning, and John Williams speaks in the afternoon.
Zscaler (ZS) will report earnings.
-=x=-=x=-=x=-=x=-=x=-=x=-=x=-
Trends, Support, and Resistance
The index fell back from a new all-time high yesterday before getting support around 15,200 and climbing back to the 15,300 support/resistance area.
The trend line from the 8/19 low points to a +1.79% gain for Thursday.
The five-day trend line ends with a +0.10% gain.
The one-day trend line points to a -0.17% decline.
-=x=-=x=-=x=-=x=-=x=-=x=-=x=-
Wrap-up
Investors are spooked about the slowing economic growth. While demand remains high for everything from manufacturing goods to the labor market, supply is holding back growth while also adding inflation pressures into the mix. At the same time, the Fed remains confident it will start bond tapering this year and could pull closer interest rate hikes if inflation doesn't prove transitory.
The long lower wick could turn into a further rally at open tomorrow. However, the waning rally and low advance/decline ratio tell me to expect Sideways or Lower.
Stay healthy and trade safe!

Daily Market Update for 9/7Summary: Markets closed the day with mixed results as investors worried about a slowing economy and uncertainty around when the Fed would start bond tapering. Big Tech was viewed as the safe bet, helping keep the growth sectors and the Nasdaq positive for the day.
Notes
Ideas always welcome in the comments. Errors will be amended as comments on TradingView or corrected inline in my blog.
-=x=-=x=-=x=-=x=-=x=-=x=-=x=-
Tuesday, September 07, 2021
Facts: +0.07%, Volume lower, Closing Range: 52%, Body: 3% Red
Good: Higher high, higher low on increased volume
Bad: Low A/D ratio, thin red body in middle of candle signals indecision
Highs/Lows: Higher high, Higher low
Candle: Indecisive doji style candle shows buyers and sellers in the market
Advance/Decline: 0.45, two declining stocks for every advancing stock
Indexes: SPX (-0.34%), DJI (-0.76%), RUT (-0.72%), VIX (+10.54%)
Sector List: Consumer Discretionary (XLY +0.29%) and Communications (XLC +0.23%) at the top. Utilities (XLU -1.32%) and Industrials (XLI -1.73%) at the bottom.
Expectation: Sideways or Lower
-=x=-=x=-=x=-=x=-=x=-=x=-=x=-
Market Overview
Markets closed the day with mixed results as investors worried about a slowing economy and uncertainty around when the Fed would start bond tapering. Big Tech was viewed as the safe bet, helping keep the growth sectors and the Nasdaq positive for the day.
The Nasdaq ended the day with a +0.07% gain, setting a new all-time and another record close. The 3% red body rests in the middle of the candle, representing the indecision for buyers and sellers during the day. The closing range of 52% is ok. The fight between bulls and bears created a higher volume day than the previous day. There were over two declining stocks for every advancing stock.
The S&P 500 (SPX) declined -0.34%. The Russell 2000 (RUT) lost -0.72%. The Dow Jones Industrial Average (DJI) was the worst of the major indexes, falling -0.76% and following the cyclical sectors underperforming for the day. The VIX Volatility Index (VIX) gained +10.54%.
Only the growth sectors ended the day with gains. Consumer Discretionary (XLY +0.29%) and Communications (XLC +0.23%) are at the top of the sector list. Utilities (XLU -1.32%) and Industrials (XLI -1.73%) were at the bottom. Losses by 3M, Amgen, and Honeywell brought down the Industrials ETF and led the Dow Jones lower.
The US Dollar strengthened today after sliding for the past few weeks. The USD Currency Index (DXY) climbed by +0.34%. US Treasury Yields for both long and short-term notes rose for the day. Despite the disappointing jobs report on Friday, bond investors still believe the Fed will continue plans to start tapering bond purchases this fall. The lower demand moves bond prices lower and yields higher.
High Yield (HYG) and Investment Grade (LQD) Corporate Bond prices also fell sharply today. The price movement is tracking along with Treasury prices. The demand for high-yield corporate bonds has been at its highest point since the start of the pandemic as investors seek higher returns. If Treasury yields rise, expect investors to rebalance back toward less risky instruments.
The Put/Call ratio declined to 0.609. The ratio signals that investors remain bullish. The CNN Fear & Greed index remained near neutral.
Three of the four largest mega-caps gained for the day. Only Microsoft (MSFT) declined, testing its 21d EMA but getting support at the key line. Apple (AAPL) gained +1.55% for the day. The top mega-cap for the day was Alibaba (BABA). Chinese stocks got a boost from better than expected trade data for China and Hong Kong reopening their border.
Chinese stocks FUTU Holding (FUTU) and JD.com (JD) topped the daily update growth list. In third and fourth place were DraftKings (DKNG) and Penn National Gaming (PENN), finishing their first weekend of College football and entering the first week of the NFL. DocuSign (DOCU) was at the bottom of the list, giving back all of its gains from Friday's earnings reaction.
-=x=-=x=-=x=-=x=-=x=-=x=-=x=-
Looking ahead
The JOLTs Job Openings report is due on Wednesday. The information could contrast last week's employment data and show more openings than people willing to fill. With Federal Unemployment Benefits ending this week, supply in the labor market will pick up, helping to fill job openings.
There is a 10-year note auction in the afternoon. Around the same time, the NY Fed's John Williams is scheduled to speak, and investors will be listening for any taper talk. Expect a reaction in Treasuries to spill over to the USD and Equities.
Lululemon (LULU), Coupa Software (COUP), GameStop (GME), and RH (RH) will report earnings on Wednesday.
-=x=-=x=-=x=-=x=-=x=-=x=-=x=-
Trends, Support, and Resistance
The Nasdaq set a new all-time high and record close. Still, there is resistance around 15,400. Watch that area for a breakout this week or for continued resistance to send the index lower.
The trend line from the 8/19 low points to a +1.32% gain for Wednesday.
The one-day and five-day trend lines end with a +0.32% gain.
-=x=-=x=-=x=-=x=-=x=-=x=-=x=-
Wrap-up
Without much economic news to influence investors, nervous sentiment spilled over from Friday's jobs report. That all could quickly change with new economic data tomorrow and an update from the Fed just as the 10y Treasury Note auction completes.
Based on the Nasdaq chart and the narrow gains focused on big tech today, the expectation is for Sideways or Lower tomorrow.
Stay healthy and trade safe!

short nasdaqtrendline analysis.. we will see a short move to 15,200. it tried to break the resistance. it couldn´t. now the way is free to go to the floor (support) again and will after that try to beat the resistance

Market Week in Review - 8/30/2021 - 9/3/2021Summary: Employment data kept investors guessing about the Fed's timeline for bond tapering. However, that did not keep the Nasdaq and S&P 500 from hitting new all-time highs. Defensive sectors led the week, but growth sectors also closed the week with gains.
Notes
The Market Week in Review is my weekend homework where I look over what happened in the previous week and what might come in the next week.
I occasionally have some errors or typos and will correct them in my blog or the comments on TradingView. I do not have an editor and do this in my free time.
If you find this helpful, please let me know in the comments. I am also more than happy to add new perspectives and data points if you have ideas.
The structure is the following:
A recap of the daily updates that I do here on TradingView.
View on the past week
What's coming in the next week
The Bullish View, The Bearish View
Key index levels to watch out for
Wrap-up
If you have been following my daily updates, you can skip down to "View on the Week." If not, then this first part is a great play-by-play recap for the week. Click the daily charts for more detail on sectors, indexes, and market leaders each day.
-=x=-=x=-=x=-=x=-=x=-=x=-=x=-
Monday, August 30, 2021
Facts: +0.90%, Volume lower, Closing Range: 85% (w/gap), Body: 81% Green
Good: Strong gain in morning, held near high in the afternoon
Bad: Lower volume, low A/D ratio
Highs/Lows: Higher high, Higher low
Candle: Gap-up at open, with tick green body and tiny upper wick. No lower wick.
Advance/Decline: 0.61, more than three declining stocks for every two advancing
Indexes: SPX (+0.43%), DJIA (-0.16%), RUT (-0.49%), VIX (-1.22%)
Sector List: Real Estate (XLRE +1.22%) and Technology (XLK +1.08%) at the top. Energy (XLE -1.18%) and Financials (XLF -1.41%) at the bottom.
Expectation: Sideways or Higher
Technology stocks rallied today after the Fed expressed a dovish stance toward tapering and interest rate hikes on Friday. Cyclical sectors faded while growth sectors dominated the top of the sector list.
The Nasdaq gained +0.90% for another record close. The closing range of 85% is just under a small upper wick, formed from a dip in the last hour of trading. The 81% Green body developed in the morning rally, with the index leveling off at a new all-time high and holding that level in the afternoon. Volume was lower than the previous day, and there were three declining stocks for every two advancing stocks.
-=x=-=x=-=x=-=x=-=x=-=x=-=x=-
Tuesday, August 31, 2021
Facts: -0.04%, Volume higher, Closing Range: 74%, Body: 5% Red
Good: Higher low continues uptrend, sideways move allows moving averages to catch up
Bad: Lower high, higher volume on decline, A/D ratio
Highs/Lows: Lower high, Higher low
Candle: Inside day with thin body at top of the candle
Advance/Decline: 0.81, more declining than advancing stocks
Indexes: SPX (-0.13%), DJI (-0.11%), RUT (+0.34%), VIX (+1.79%)
Sector List: Real Estate (XLRE +0.59%) and Communications (XLC +0.38%) at the top. Technology (XLK -0.53%) and Energy (XLE -0.68%) at the bottom.
Expectation: Sideways
Markets closed the month of August, moving sideways, but capped another bullish month of gains. The day started with investors swarming defensive sectors, but sentiment flipped, and the sector list scrambled.
The Nasdaq closed with a -0.04% decline on higher volume than the previous day. The inside day started with a dip at open but climbed back to set an intraday high before another more minor dip before the close. That created a thin red body above a longer lower wick, all within the high and low of the previous day. There were more declining stocks than advancing stocks.
-=x=-=x=-=x=-=x=-=x=-=x=-=x=-
Wednesday, September 01, 2021
Facts: +0.33%, Volume higher, Closing Range: 30% (w/gap), Body: 1% Green
Good: Gain on higher volume, higher high, higher low
Bad: Fade from new all-time high
Highs/Lows: Higher high, Higher low
Candle: Gap-up to long upper wick, almost no body, no lower wick
Advance/Decline: 0.99, one advancing for every declining stock
Indexes: SPX (+0.03%), DJI (-0.14%), RUT (+0.58%), VIX (-2.25%)
Sector List: Real Estate (XLRE +1.72%) and Utilities (XLU +1.31%) at the top. Financials (XLF -0.57%) and Energy (XLE -1.47%) at the bottom.
Expectation: Sideways or Lower
Markets rallied in the morning before investors turned defensive and the gains faded, weighed down by big tech stocks that all sold off in the later afternoon. Regardless, most of the market held onto some gain for the day.
The Nasdaq closed with a +0.33% gain but was up 0.80% midday. Volume was higher than the previous day. A gap-up at open turned into a morning rally, creating a long upper wick with no lower wick. However, the index faded in the afternoon, leaving a green body covering only 1% of the candle. There was an equal number of advancing and declining stocks for the day.
-=x=-=x=-=x=-=x=-=x=-=x=-=x=-
Thursday, September 02, 2021
Facts: +0.14%, Volume lower, Closing Range: 48%, Body: 29% Red
Good: Support forming at 15,300. Sideways move allowing moving averages to catch up.
Bad: Resistance near the weekly high
Highs/Lows: Higher high, Higher low
Candle: Outside day, red body above longer lower wick
Advance/Decline: 1.24, more advancing stocks than declining stocks
Indexes: SPX (+0.28%), DJI (+0.37%), RUT (+0.74%), VIX (+1.86%)
Sector List: Energy (XLE +2.54%) and Industrials (XLI +1.08%) at the top. Technology (XLK -0.11%) and Communications (XLC -0.67%) at the bottom.
Expectation: Sideways or Lower
Jobs data in the morning improved the economic outlook even while the pandemic remains relentless. Cyclical and defensive sectors outperformed while growth sectors declined for the day.
The Nasdaq gained +0.14% for the day. Volume was lower than the previous day. The 29% red body sits above a longer lower wick and below a shorter upper wick. The closing range of 48% is in the middle of an outside day where the high is higher, and the low is lower than the previous day. That’s two days of sideways trading near the all-time high for the index. There were more advancing stocks than declining stocks today.
-=x=-=x=-=x=-=x=-=x=-=x=-=x=-
Friday, September 03, 2021
Facts: +0.21%, Volume lower, Closing Range: 87%, Body: 55% Green
Good: Progress all day after a dip at open
Bad: Lower volume gain with low A/D ratio
Highs/Lows: Lower high, Lower low
Candle: Mostly green body in the middle of candle, longer lower wick
Advance/Decline: 0.47, two declining stocks for every advancing stock
Indexes: SPX (-0.03%), DJI (-0.21%), RUT (-0.52%), VIX (+0.00%)
Sector List: Technology (XLK +0.40%) and Health (XLV +0.11%) at the top. Materials (XLB -0.66%) and Utilities (XLU -0.83%) at the bottom.
Expectation:
Investors rushed to safety in big tech today after payroll growth data came in much lower than expected. The result was losses across most sectors and indexes, but enough gains in tech mega-caps for the Nasdaq to end the day higher.
The Nasdaq closed the day with a +0.21% gain. Volume was lower than the previous day. The closing range of 87% came after a volatile morning which turned into a steady climb to close near the intraday high. The lower wick is longer than the upper wick, and the green body covers 55% of the candle. There were two declining stocks for every advancing stock.
-=x=-=x=-=x=-=x=-=x=-=x=-=x=-
View on the Week
Employment data kept investors guessing about the Fed's timeline for bond tapering. However, that did not keep the Nasdaq and S&P 500 from hitting new all-time highs. Defensive sectors led the week, but growth sectors also closed the week with gains.
The week opened with momentum from the previous week's dovish speech by Jerome Powell at the Jackson Hole economic symposium. The speech indicated bond tapering could start this year, but the Fed would hold off on interest rate hikes until further progress in the economic recovery. That turned all eyes toward the labor market as the Fed's primary concern.
So how is the labor market doing? The answer varies depending on the labor data indicator. ADP Nonfarm Employment change data was lower than expected on Wednesday. Continuing and Initial jobless claims data was better than expected on Thursday. Then Nonfarm payrolls data on Friday was surprisingly lower than expected. The data had investors guessing what impact that would have on Fed policy.
The result of the swings in expectations had investors rotating between big tech and defensive stocks on poor labor market data and small-caps and cyclicals on good labor market data. That was on display on Wednesday as big tech soared in the morning after the Nonfarm Employment change data indicated a delay to tapering but then fell back after the Fed's Bostic said tapering could start as early as October.
Many of the economic indicators are showing that supply issues are holding back growth. The payrolls data, for example, shows the number of jobs filled but does not show the number of job openings without employees. Other data show there are plenty of jobs, but not people to fill them. Walmart and Amazon both made announcements this week that they will be adding a total of 75,000 in the coming months.
Manufacturers reported significant supply issues. A key component of PMI data shows order backlogs at their highest point in the past 70 years. Aluminum futures were up over 3% to new all-time highs. Aluminum is an essential material in the manufacturing of products and packaging.
Pending Home Sales data released on Monday was much lower than expected. However, the shortage of contracts pending is not a sign of low demand but rather a sign of low supply. That has housing prices growing at their highest rate on record.
Real Estate stocks are benefitting the most from the data. The sector is undoubtedly getting a boost from the housing data. However, investors are also rotating into Real Estate as a hedge against inflation and as a sector that benefits from continuing low-interest rates.
Federal Unemployment Benefits that have been in place since March 2020 are scheduled to end this week. That may force the current dynamic in the economy to change quite a bit.
The Nasdaq advanced +1.55% for the week. Volume was lower than the previous week. The closing range is 93%. Like the previous week, the weekly candle has no lower wick and only a tiny upper wick.
The Russell 2000 (RUT) gained +0.65% this week. The S&P 500 (SPX) advanced +0.58%. The Dow Jones Industrial Average (DJI) fell -0.24% for the week.
The VIX volatility index ended the week flat.
-=x=-=x=-=x=-=x=-=x=-=x=-=x=-
Sectors
Defensive sectors led the sector list during a week where employment data kept investors guessing on the Fed's timeline for bond tapering.
Real Estate ( XLRE ) led the list throughout the week. The sector is benefiting from low interest rates while it also remains a good hedge against inflation. The Fed continues to put full employment ahead of inflation as the priority for interest rate hikes, so the sector will continue to perform if labor recovery slows.
Health Care ( XLV ) was the second-best sector, following by Consumer Staples ( XLP ) and Utilities ( XLU ).
The cyclical sectors ended the week lower, with Financials ( XLF ) and Energy ( XLE ) sitting at the bottom of the sector list. The slowing labor market and missed PMI numbers this week showed some weakness in the economy.
-=x=-=x=-=x=-=x=-=x=-=x=-=x=-
Economic Indicators
The US Dollar (DXY) declined -0.61% this week. The dollar continues to weaken as the Fed remains dovish toward interest rates and seems poised to continue economic support until the labor market recovers fully.
US Treasuries 30y and 10y yields rose for a second week while the 2y yield declined, widening the gap between long-term and short-term yields for another week.
Both High Yield (HYG) Corporate Bond prices rose this week while Investment Grade (LQD) Corporate Bond prices fell.
Silver and Gold continue to rise as the US Dollar declines. Timber and Aluminum prices are rising as growth in demand continues to outpace supply. However, Copper declined for the week.
Crude Oil Futures were up and down throughout the week but ended the week flat.
-=x=-=x=-=x=-=x=-=x=-=x=-=x=-
Investor Sentiment
The put/call ratio (PCCE) ended the week at 0.626. It's in the bullish range but not overly bullish compared to earlier in the week when it hit 0.505.
The CNN Fear & Greed Index moved back to Neutral after sliding into Greed mid-week.
The NAAIM money manager exposure index rose to 93.95 from 92.83 in the previous week.
-=x=-=x=-=x=-=x=-=x=-=x=-=x=-
Stocks of the Week
Amazon (AMZN) moved back above its 10w moving average line with a +3.83% gain. Apple (AAPL) had a similar advance of +3.84$. Microsoft gained +0.47% but faded from mid-week highs. Alphabet (GOOGL) declined -0.18% for the week but hit a new all-time high on Wednesday. All four are trading above the key moving average lines.
MongoDB (MDB) was the big earnings winner for the week, smashing expectations and closing the week with a +28.26% gain. Digital Turbine (APPS) also had a massive gain of +21.46% after the S&P decided to add the company to its mid-cap 400 index.
RobinHood (HOOD) declined -7.51% this week. The SEC discussed the possibility of blocking payment for order flow, a huge part of RobinHood's business model.
Chewy (CHWY) and Zoom Video (ZM) disappointed investors with slowing growth. Chewy declined -12.89%, and Zoom Video declined -12.48% for the week.
-=x=-=x=-=x=-=x=-=x=-=x=-=x=-
Cryptocurrency
After moving sideways for a few weeks, Ethereum (ETHUSD) took off with a +22.49% gain this week. Ethereum got a boost from a general increase in cryptocurrencies but also an increase in demand for non-fungible tokens (NFT) that trade using the Ethereum network.
Bitcoin (BTCUSD) grew +6.12% this week. Litecoin (LTCUSD) gained +33.14%. Bitcoin Cash (BCHUSD) rose +16%.
-=x=-=x=-=x=-=x=-=x=-=x=-=x=-
The Week Ahead
Monday
Markets will be closed on Monday for the US Labor Day holiday.
Tuesday
There are some short-term Treasury auctions on Tuesday. Otherwise, there is not much economic news planned.
There are no notable earnings reports for the daily update on Tuesday.
Wednesday
The JOLTs Job Openings report is due on Wednesday. The information could contrast last week's employment data and show more openings than people willing to fill. With Federal Unemployment Benefits ending this week, supply in the labor market will pick up.
There is a 10-year note auction in the afternoon. Around the same time, the NY Fed's John Williams is scheduled to speak, and investors will be listening for any taper talk.
Lululemon (LULU), Coupa Software (COUP), GameStop (GME), and RH (RH) will report earnings on Wednesday.
Thursday
The weekly Initial and Continuing Jobless Claims report come on Thursday. Crude Oil Inventories will get an update after the market opens. The Fed's Mary Daly speaks in the morning, and John Williams speaks in the afternoon.
Zscaler (ZS) will report earnings.
Friday
We will get a forward-looking update on inflation with the Produce Price Index data in the morning.
Kroger (KR) and UP Fintech (TIGR) release earnings on Friday.
-=x=-=x=-=x=-=x=-=x=-=x=-=x=-
The Bullish Side
Despite pockets of the US still experiencing a high number of Delta variant cases, the economy continues to move forward. Many of the indicators that show otherwise are suffering from a shortage of supply to meet demand. US Households are ready to spend, still having one of the highest savings rates in recent history. Corporations benefit from low interest rates and cash reserves that they want to put to work for growth.
As the job market recovery slows, the Fed is likely to continue stimulus longer and leave interest rates untouched through 2022. That means companies will continue to benefit from cheap money. The US Dollar will continue to weaken, helping large multi-national corporations.
-=x=-=x=-=x=-=x=-=x=-=x=-=x=-
The Bearish Side
The end to Federal Unemployment Benefits happens at the end of this week. The impact on the economy isn't certain, but there are a few things that could happen. One possible outcome is a surge in supply for the labor market, allowing employment to catch up with job openings. That may be a good thing for the economy but may also cause the Fed to taper sooner and send bond investors into a taper tantrum.
There is considerable divergence in the typical market-timing indicators. While economic data show a slowing recovery, investor sentiment remains neutral to bullish. Indexes are setting new all-time highs each week, but the breadth of those gains is often limited to narrow segments such as big tech. The subcomponents of the CNN Fear & Greed index are at opposite ends of the spectrum. Junk bonds show Extreme Greed while stocks show Extreme Fear.
September is historically a bearish month. It won't take much for investors to get skittish and send indexes lower in the next few weeks.
-=x=-=x=-=x=-=x=-=x=-=x=-=x=-
Key Nasdaq Levels to Watch
The Nasdaq set another all-time high this week, closing the week at a record.
On the positive side, the levels are:
The new all-time high was set on Thursday and is 15,380.07.
The index hit resistance at around 15,380 for the last three days.
15,500 may be the next area of resistance.
On the downside, there are a few key levels:
The 10d moving average is at 15,160.88.
The 21d EMA is at 15,004.89.
15,000 is an area of support.
The 50d MA is at 14,763.22.
14,423.16 is the low of the most recent pullback.
14,200 remains a critical level if the index moves downward.
14,000 has been an area of support/resistance.
There is a pivot at 13,903.73.
A further pullback would likely hit the 200d moving average at 13,703.78. The index hasn't approached this line since rising above it in April 2020.
-=x=-=x=-=x=-=x=-=x=-=x=-=x=-
Wrap-up
Even as the Nasdaq and S&P 500 hit new all-time highs this week, there was uncertainty in the market. Defensive sectors outperformed the other sectors. Big tech and Junk Bonds advanced as some of the few options to find higher returns as the economy stumbles.
Expect investors to continue responding to any clues on Fed tapering, including economic indicators and language in the several Fed speeches scheduled for next week.
Good luck, stay healthy, and trade safe!

Daily Market Update for 9/3Summary: Investors rushed to safety in big tech today after payroll growth data came in much lower than expected. The result was losses across most sectors and indexes, but enough gains in tech mega-caps for the Nasdaq to end the day higher.
Notes
Ideas always welcome in the comments. Errors will be amended as comments on TradingView or corrected inline in my blog.
-=x=-=x=-=x=-=x=-=x=-=x=-=x=-
Friday, September 03, 2021
Facts: +0.21%, Volume lower, Closing Range: 87%, Body: 55% Green
Good: Progress all day after a dip at open
Bad: Lower volume gain with low A/D ratio
Highs/Lows: Lower high, Lower low
Candle: Mostly green body in the middle of candle, longer lower wick
Advance/Decline: 0.47, two declining stocks for every advancing stock
Indexes: SPX (-0.03%), DJI (-0.21%), RUT (-0.52%), VIX (+0.00%)
Sector List: Technology (XLK +0.40%) and Health (XLV +0.11%) at the top. Materials (XLB -0.66%) and Utilities (XLU -0.83%) at the bottom.
Expectation:
-=x=-=x=-=x=-=x=-=x=-=x=-=x=-
Market Overview
Investors rushed to safety in big tech today after payroll growth data came in much lower than expected. The result was losses across most sectors and indexes, but enough gains in tech mega-caps for the Nasdaq to end the day higher.
The Nasdaq closed the day with a +0.21% gain. Volume was lower than the previous day. The closing range of 87% came after a volatile morning which turned into a steady climb to close near the intraday high. The lower wick is longer than the upper wick, and the green body covers 55% of the candle. There were two declining stocks for every advancing stock.
The other major indexes declined for the day, with the Russell 2000 (RUT) having the most significant loss, falling -0.52%. The Dow Jones Industrial Average (DJI) lost -0.21%. The S&P 500 (SPX) declined -0.03%. The VIX Volatility Index gained +1.86%.
Technology (XLK +0.40%) led the sector list, helping the tech-heavy Nasdaq move higher. Health (XLV +0.11%) was the next best sector for the day. Materials (XLB -0.66%) and Utilities (XLU -0.83%) were the bottom two sectors. Notably, the defensive sector of Utilities underperformed today. The economic data from the morning is bad for parts of the economy but not necessarily for equities.
Nonfarm Payrolls for August grew by 235,000, much lower than the expected 750,000. However, the Unemployment Rate met expectations at 5.2%, a 0.2% improvement over the previous month. Payroll data is impacted by both supply and demand in the labor market. The Participation Rate remained the same at 61.7%, indicating that a large portion of the labor force is still not returning to work. Manufacturing Payrolls grew faster than expected.
Consider the announcements this week that Walmart will hire 20,000 workers for its supply-chain operations, and Amazon is planning to hire 55,000 technology workers across its various businesses. Those are just two companies and indicate that demand for workers will outpace supply for the near term.
The Non-Manufacturing Purchasing Managers Index was higher than expected.
The US Dollar (DXY) was down -0.11% for the day. US Treasury yields rose for the day. Bond investors expect bond tapering to be farther in the future than previously expected based on today's jobs data. The Fed has said that employment is the critical factor in their decision to begin tapering. High Yield Corporate Bond (HYG) prices rose for the day while Investment Grade Corporate Bond (LQD) prices dropped.
Silver and Gold increased sharply. Investors may be expecting further drops in the US Dollar. Timber, Copper, and Aluminum all increased. Crude Oil fell back slightly.
The put/call ratio rose to 0.626 for the day. The CNN Fear & Greed index is at Neutral, falling back from Greed. The NAAIM money manager exposure index rose to 93.95 from 92.83 in the previous week.
The four largest mega-caps gained for the day, helping to carry the Technology sector and the Nasdaq higher. Microsoft (MSFT) faded at the end of the session, ending even for the day. Other tech mega-caps outperformed as well, with Taiwan Semiconductor (TSM) and Nvidia (NVDA) leading the mega-cap list with over 2% gain. MongoDB (MDB) was the big winner of the day on the daily update growth. The stock soared +26.33% after smashing earnings estimates yesterday. In second place was another earnings beat, DocuSign (DOCU), which climbed +5.26% for the day.
-=x=-=x=-=x=-=x=-=x=-=x=-=x=-
Looking ahead
Markets will be closed on Monday for the US Labor Day holiday.
There are some short-term Treasury auctions on Tuesday. Otherwise, there is not much economic news planned.
There are no notable earnings reports for the daily update on Tuesday.
-=x=-=x=-=x=-=x=-=x=-=x=-=x=-
Trends, Support, and Resistance
The Nasdaq is finding resistance near the all-time high around 15,380.
The trend line from the 8/19 low points to a +1.23% gain for Tuesday.
The one-day and five-day trend lines end with a +0.24% advance for the start of the week.
-=x=-=x=-=x=-=x=-=x=-=x=-=x=-
Wrap-up
That time when bad news is good news. Although the slowing growth of payrolls is a negative for the economy, there are two things to look at as a silver lining.
First, it appears that the issue in payroll growth is a supply issue and not a demand issue. That means companies are seeing growth and a need for employees but cannot attract them back into the labor force.
Second, the Fed's primary concern for the economy is employment. The fact that payrolls growth is slowing will delay a decision to start bond tapering.
The result is that we didn't see a massive sell-off of equities today. Instead, there was rotation into big tech, which is likely to benefit from continued Fed stimulus and a weaker US dollar. And Utilities, which is typically at the top of the sector list on bad news, was actually at the bottom of the sector list.
The index continues to move sideways while volume shrinks and the advanced/decline ratio moved under 0.50. Although there are reasons to be bullish, the index still indicates a Sideways or Lower move for Tuesday.
Stay healthy and trade safe!

Daily Market Update for 9/2Summary: Jobs data in the morning improved the economic outlook even while the pandemic remains relentless. Cyclical and defensive sectors outperformed while growth sectors declined for the day.
Notes
Ideas always welcome in the comments. Errors will be amended as comments on TradingView or corrected inline in my blog.
-=x=-=x=-=x=-=x=-=x=-=x=-=x=-
Thursday, September 02, 2021
Facts: +0.14%, Volume lower, Closing Range: 48%, Body: 29% Red
Good: Support forming at 15,300. Sideways move allowing moving averages to catch up.
Bad: Resistance near the weekly high
Highs/Lows: Higher high, Higher low
Candle: Outside day, red body above longer lower wick
Advance/Decline: 1.24, more advancing stocks than declining stocks
Indexes: SPX (+0.28%), DJI (+0.37%), RUT (+0.74%), VIX (+1.86%)
Sector List: Energy (XLE +2.54%) and Industrials (XLI +1.08%) at the top. Technology (XLK -0.11%) and Communications (XLC -0.67%) at the bottom.
Expectation: Sideways or Lower
-=x=-=x=-=x=-=x=-=x=-=x=-=x=-
Market Overview
Jobs data in the morning improved the economic outlook even while the pandemic remains relentless. Cyclical and defensive sectors outperformed while growth sectors declined for the day.
The Nasdaq gained +0.14% for the day. Volume was lower than the previous day. The 29% red body sits above a longer lower wick and below a shorter upper wick. The closing range of 48% is in the middle of an outside day where the high is higher, and the low is lower than the previous day. That’s two days of sideways trading near the all-time high for the index. There were more advancing stocks than declining stocks today.
Small-caps continue to outperform as the Russell 2000 (RUT) advanced +0.75% today. The S&P 500 (SPX) gained +0.28%, while the Dow Jones Industrial Average (DJI) gained +0.37%. The VIX Volatility Index (VIX) gained +1.86% for the day. The Nasdaq and S&P 500 finished the day with more record closes.
Energy (XLE +2.54%) bounced back above its 21d EMA after declining to the 200d MA this week. Industrials (XLI +1.08%) was the second-best sector. The growth sectors were the only ones to fall today. Technology (XLK -0.11%) and Communications (XLC -0.67%) were at the bottom of the list.
Continuing and Initial Jobless claims were lower than expected, showing significant progress for the economic recovery. Trade Balance was also better than expected with Exports growing and Imports declining. The US Dollar continues to weaken, declining -0.31% today. US Treasuries also dropped for the day. High Yield (HYG) and Investment Grade (LQD) Corporate Bond prices increased.
Crude Oil Futures advanced as data shows demand is higher than expected. Timber advance, continuing an uptrend from the last part of August.
The put/call ratio (PCCE) declined to 0.505, starting to get into the overly bullish area. The CNN Fear & Greed index is hovering just above Neutral in the Greed area. The NAAIM money manager exposure index rose to 93.95 from 92.83 in the previous week.
Exxon Mobil (XOM) was the best mega-cap of the day, gaining +2.44% and helping Energy lead the sector list for the day. Amazon (AMZN) is getting support at its 50d moving average line but declined -0.46% today.
Visa (V) and Mastercard (MA) were the bottom two mega-caps, losing over 2% each. Digital Turbine (APPS) is back on top of the daily update growth list after having a massive gain on Tuesday. Chewy (CHWY) was at the bottom of the list, declining -9.29%. Growth is slowing for the company, and analysts were disappointed with guidance during yesterday's earnings call.
Both PagerDuty (PD) and MongoDB (MDB) were up over 13% in aftermarket trading. Both companies posted earnings results that smashed expectations and provided better guidance for the year.
-=x=-=x=-=x=-=x=-=x=-=x=-=x=-
Looking ahead
Employment data on Friday morning will show the progress in the labor market recovery. It is data watched closely by the Fed to determine economic policy. We'll also get the Non-Manufacturing Purchasing Managers Index.
DocuSign (DOCU) will release earnings on Friday.
-=x=-=x=-=x=-=x=-=x=-=x=-=x=-
Trends, Support, and Resistance
The Nasdaq set a new all-time high on an outside day for the index. The index moved sideways the last two days.
The trend line from the 8/19 low points to a +1.28% gain for Friday.
The five-day trend line ends with a +0.91% gain.
The one-day trend line would result in a decline of -0.53% for tomorrow.
-=x=-=x=-=x=-=x=-=x=-=x=-=x=-
Wrap-up
All eyes are on the employment data to be available on Friday morning. The market is showing some indecision awaiting the data. The inside day on Tuesday, followed by a faded rally (long upper wick) on Wednesday, and now an outside day today puts that indecision on display.
Small-caps continue to outperform, and that should continue if the Employment data is good on Friday. The Russell 2000 is approaching the upper boundary of a trading range it's been within since February. It will take some momentum to break through the upper bound.
Stay healthy and trade safe!

Short Nasdaq until 15550We will see a big short movement as soon as the stop-losses will be activated. the big traders don´t take profits. they wait until the movement ends. that happens when the trendline is beated. it´s then a nice short entry point. its not an advice. only my oponion. good luck

Daily Market Update for 9/1Summary: Markets rallied in the morning before investors turned defensive and the gains faded, weighed down by big tech stocks that all sold off in the later afternoon. Regardless, most of the market held onto some gain for the day.
Notes
Ideas always welcome in the comments. Errors will be amended as comments on TradingView or corrected inline in my blog.
-=x=-=x=-=x=-=x=-=x=-=x=-=x=-
Wednesday, September 01, 2021
Facts: +0.33%, Volume higher, Closing Range: 30% (w/gap), Body: 1% Green
Good: Gain on higher volume, higher high, higher low
Bad: Fade from new all-time high
Highs/Lows: Higher high, Higher low
Candle: Gap-up to long upper wick, almost no body, no lower wick
Advance/Decline: 0.99, one advancing for every declining stock
Indexes: SPX (+0.03%), DJI (-0.14%), RUT (+0.58%), VIX (-2.25%)
Sector List: Real Estate (XLRE +1.72%) and Utilities (XLU +1.31%) at the top. Financials (XLF -0.57%) and Energy (XLE -1.47%) at the bottom.
Expectation: Sideways or Lower
-=x=-=x=-=x=-=x=-=x=-=x=-=x=-
Market Overview
Markets rallied in the morning before investors turned defensive and the gains faded, weighed down by big tech stocks that all sold off in the later afternoon. Regardless, most of the market held onto some gain for the day.
The Nasdaq closed with a +0.33% gain but was up 0.80% midday. Volume was higher than the previous day. A gap-up at open turned into a morning rally, creating a long upper wick with no lower wick. However, the index faded in the afternoon, leaving a green body covering only 1% of the candle. There was an equal number of advancing and declining stocks for the day.
The Russell 2000 (RUT) outperformed again with a +0.58% gain. The S&P 500 (SPX) held onto a +0.03% gain. The Dow Jones Industrial Average (DJI) declined -0.14%.
Real Estate (XLRE +1.72%) and Utilities (XLU +1.31%) led the sector list as investors were defensive on the first day of September, typically a bearish month in the markets. Cyclical sectors declined for the day, with Financials (XLF -0.57%) and Energy (XLE -1.47%) at the bottom of the sector list.
It's not clear what caused the selling in the afternoon. Morning economic data had Investors already skittish with defensive sectors leading the whole day, but indexes still rose. The Fed's Raphael Bostic made comments around noon that may have spooked the market. He stated that a surge in evictions may weigh on the economic recovery and said it is reasonable that bond-buying taper could start in October.
ADP Nonfarm Employment change data was less than forecast. Manufacturing PMI was higher than expected, and demand for Crude Oil beat the forecast. The US Dollar weakened further, declining -0.15% today. US 30y and 10y Treasury Yields fell while the US 2y Treasury yield remained about the same. High Yield Corporate Bond (HYG) prices declined sharply after making a new post-pandemic high. Investment Grade Corporate Bond (LQD) prices also fell slightly. Most of the commodity prices I track remained about the same, although Copper and Aluminum declined.
All four of the largest mega-caps retreated from mid-day highs, bringing down the Nasdaq with them. Alibaba (BABA) was the top-performing mega-cap for the day as Chinese stocks all seemed to do well. FUTU Holdings (FUTU) and UP Fintech (TIGR) were the top stocks in the daily update growth list, helped by FUTU showing strong growth and beating street expectations.
September is historically one of the most bearish months. Last September, the Nasdaq retreated 13%, and the S&P 500 fell 10%. The Russell 2000 (RUT) also retreated 10% last September but then finished the year with a 50% gain from its September low.
-=x=-=x=-=x=-=x=-=x=-=x=-=x=-
Looking ahead
Thursday morning will bring an update to Exports/Imports for July and Initial Jobless Claims for the week.
Broadcom (AVGO), MongoDB (MDB), Hewlett Packard (HPE), Cloudera (CLDR), and Pagerduty (PD) will report earnings.
-=x=-=x=-=x=-=x=-=x=-=x=-=x=-
Trends, Support, and Resistance
The Nasdaq set another new all-time high and record close today.
The trend line from the 8/19 low and the five-day trend line point to a +1.17% gain.
The one-day trend line ends with a +0.12% gain for tomorrow.
The long upper wick has a more bearish look and may result in a decline for Wednesday.
-=x=-=x=-=x=-=x=-=x=-=x=-=x=-
Wrap-up
Investors entered the new month with optimism, sending indexes higher. Then it seemed they suddenly realized it was September. September is historically a bearish month, with the last three years seeing dips in the month. Is this a year that September will buck the trend?
Based on the long upper wick and almost no candle body after a gap-up and rally, the expectation for tomorrow is Sideways or Lower.
Stay healthy and trade safe!

The bottom for SmallCaps might be inWe might be in the midst of a trend reversal for a rotation that has been going on since March: Megacaps and SuperLargeCaps have been going higher, while everything from SmallLargeCaps to NanoCaps has been on the decline.
We've had many days recently where indexes seemed to go higher when the majority of stocks seemed to decline. That was, because we've seen huge increases in MegaCaps and SuperLargeCap companies recently, which have used so much money on the market that many, if not most SmallCaps have litterally have "their blood drained".
Analyzing the 2,5Y Forward P/E and P/S rates of MSFT & AAPL and adding a little bit bonus for small debt/equity(MSFT) and a little malus for high debt/equity(AAPL) I have come to the conclusion that they're trading roughly 100% over market average valuation for this kind of analysis.
Now, considering the fact, that both these FAANG giants are quite expensive at current valuations and seeing most SmallCaps trading significantly below market averages one starts to wonder when a trend change might be in.
The answer is: probably now. Or soon.
Subtracting Nasdaq100 Index( OANDA:NAS100USD ) (that tracks only the top100 companies of the NASDAQ exchange) from the Nasdaq Composite Index(that includes all Nasdaq listed companies) You're left with a quite unique picture: How Non-Index-Nasdaq-Companies are trading vs Nasdaq100 companies. This, in theory, can be mostly translated into how SmallCaps are faring vs MegaCaps and SuperLargeCaps.
As you can see, we have been on a decline for months, with quite a consistent trend resistance (the yellow line).
We're also trading near 03/2020 (Corona crash) & 09/2020 (Major Tech correction) lows.
We seem to have broken the Trend resistance (but better wait for real confirmation on Monday/Tuesday)
All of these facts lead me to believe the bottom for SmallCaps is in and MegaCaps and SuperLargeCaps are ahead of a major correction.
Let me know your thoughts! :)

Short Nasdaq until 14440Swing sell nasdaq. Its already at the top of the chanell. when break ot of the 1 h trend.. then its trend down

NASDAQ MACRO LOG CHART (+ Info, Targets, Crash Points...) General Info:
- On the linear scale, the NASDAQ has made a parabolic move (2009 - Now).
- The 2009 crisis was never properly fixed. The government placed a bandaid on the debt problem by bailing out all of the banks/corps.
- TECH is the future but speculation is the bubble fueler.
- Margin debt is at ATH
- Transportation Index is down
- "Meme Stocks", Robinhood era - dumb money
- COVID Massive Printing (1/3 of Economy $$ printed in 1 year)
- Joe Biden's trillion-dollar infrastructure plan + corporate tax hikes
- COVID DELTA, Afghanistan... (current events)
- Bull/Bear markets come in cycles
- Overvalued markets as a whole (real estate, crypto, NFT...)
What to expect:
Following the Log Scale, one would expect the biggest crash in history to occur when the NASDAQ reaches the red line (maybe 55K a couple of years down the road (around 2031)), however, this is not feasible. There simply isn't enough liquidity to keep the markets going in an upward direction for years. As we are over-valued, we can expect a correction/crash at the current GANN line we are approaching. There isn't an exact timeline as to when we will touch and react, but here is the scenario:
17K by end of December then crash. If we impulse then 19k. If we keep going up then 22K Q2 2022. It will either be a blowoff top or a stagnation for a couple of months around the PT before downwards movement. An impulse to 22k mid-2022 followed by stagnation can carry the crash over into 2023.
In summary, 17K, 19K, or 22K. EOY or Q2 2022. Have patience and an exit plan. Good Luck!
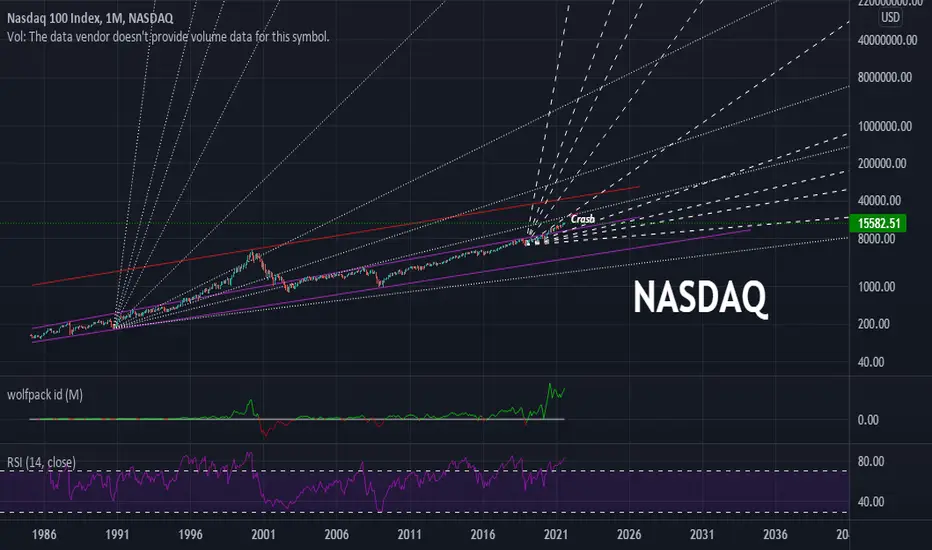
Daily Market Update for 8/31Summary: Markets closed the month of August moving sideways, but capped another bullish month of gains. The day started with investors swarming defensive sectors, but sentiment flipped, and the sector list scrambled.
Notes
Ideas always welcome in the comments. Errors will be amended as comments on TradingView or corrected inline in my blog.
-=x=-=x=-=x=-=x=-=x=-=x=-=x=-
Tuesday, August 31, 2021
Facts: -0.04%, Volume higher, Closing Range: 74%, Body: 5% Red
Good: Higher low continues uptrend, sideways move allows moving averages to catch up
Bad: Lower high, higher volume on decline, A/D ratio
Highs/Lows: Lower high, Higher low
Candle: Inside day with thin body at top of the candle
Advance/Decline: 0.81, more declining than advancing stocks
Indexes: SPX (-0.13%), DJI (-0.11%), RUT (+0.34%), VIX (+1.79%)
Sector List: Real Estate (XLRE +0.59%) and Communications (XLC +0.38%) at the top. Technology (XLK -0.53%) and Energy (XLE -0.68%) at the bottom.
Expectation: Sideways
-=x=-=x=-=x=-=x=-=x=-=x=-=x=-
Market Overview
Markets closed the month of August moving sideways, but capped another bullish month of gains. The day started with investors swarming defensive sectors, but sentiment flipped, and the sector list scrambled.
The Nasdaq closed with a -0.04% decline on higher volume than the previous day. The inside day started with a dip at open but climbed back to set an intraday high before another more minor dip before the close. That created a thin red body above a longer lower wick, all within the high and low of the previous day. There were more declining stocks than advancing stocks.
Today, the Russell 200 (RUT) was the only major index to book gains with a +0.34% advance. The S&P 500 declined -0.13%, while the Dow Jones Industrial Average (DJI) lost -0.11%. The VIX Volatility Index rose +1.79%.
The sector list shuffled after the morning dips. Defensive sectors were the top four at 10:00 am. But then growth sectors started to regain initial losses. Real Estate (XLRE +0.59%) and Communications (XLC +0.38%) ended the day at the top. Technology (XLK -0.53%) and Energy (XLE -0.68%) were at the bottom.
The Chicago PMI for August was lower than expected, indicating a dip in economic activity. However, a subcomponent of the index that tracks order backlogs hit its highest point since 1951. CB Consumer Confidence was also lower than forecast. The S&P CoreLogic Case-Shiller index covering 20 cities showed home prices gaining at a record rate in July.
The US Dollar strengthened, and US Treasury Yields rose after the data became available mid-morning. High Yield Corporate Bond (HYG) prices rose for the day while Investment Grade Corporate Bond (LQD) prices dropped. Aluminum rose another +2.47% today, driven by demand for the metal in Manufacturing. That's consistent with the PMI subcomponent showing backlogs are high because of material shortages.
The put/call ratio rose to 0.667. The CNN Fear & Greed index moved back to neutral after climbing into the Greed area on Monday.
Amazon (AMZN) rose another +1.44% today, closing back above the 50d moving average. It had been trading below the key moving average line since the beginning of August, even dipping below the 200d moving average for several days. Alibaba (BABA) was the top mega-cap for the day. The mega-cap list is about half gainers and half losers. Novo Nordisk (NVO) was the biggest loser of the day.
Digital Turbine (APPS) was the top gainer in the daily update growth list, advancing %14.07. The company will be added to the S&P MidCap 400 on September 7th. Zoom Video (ZM) declined 16.69%, putting it at the bottom of the list. Investors were not happy about slowing growth and the announcement that they will acquire Five9 (FIVN).
-=x=-=x=-=x=-=x=-=x=-=x=-=x=-
Looking ahead
Manufacturing Purchasing Managers Index data will be available on Wednesday. Crude Oil Inventories gets a weekly update after the market opens.
Okta (OKTA), Chewy (CHWY), and Five Below (FIVE) will release earnings on Wednesday.
-=x=-=x=-=x=-=x=-=x=-=x=-=x=-
Trends, Support, and Resistance
The Nasdaq hovered below yesterday's new all-time high, building support and giving moving average lines a chance to catch up.
The trend line from the 8/19 low points to a +1.09% gain for Wednesday.
The five-day trend line ends with a +0.69% gain.
The one-day trend line shows a +0.35% gain for tomorrow.
-=x=-=x=-=x=-=x=-=x=-=x=-=x=-
Wrap-up
I mentioned yesterday that a Sideways move or even a pullback would be constructive to build support and allow the moving average lines to catch up. Another day or two of the same would still be good, so the Nasdaq doesn't become overextended.
The inside day candle with a thin red body shows some indecision. The expectation for tomorrow is set for Sideways, and we'll watch closely to see which direction the market decides to go heading into September.
Stay healthy and trade safe!
