HolderStat┆BNBUSD consolidation breakout hunts 700-720CRYPTOCAP:BNB ended a protracted falling-channel decline by igniting from a tight consolidation rectangle around 600 USDT. The ensuing surge stalled near 670 and is now rechecking the breakout zone at 640, which also aligns with the underside of a freshly drawn rising wedge. A successful hold here could catapult price toward the 700-720 resistance corridor, the depth equivalent of the prior consolidation range. Slip back under 620 would risk sliding into the old channel.
J-BNB

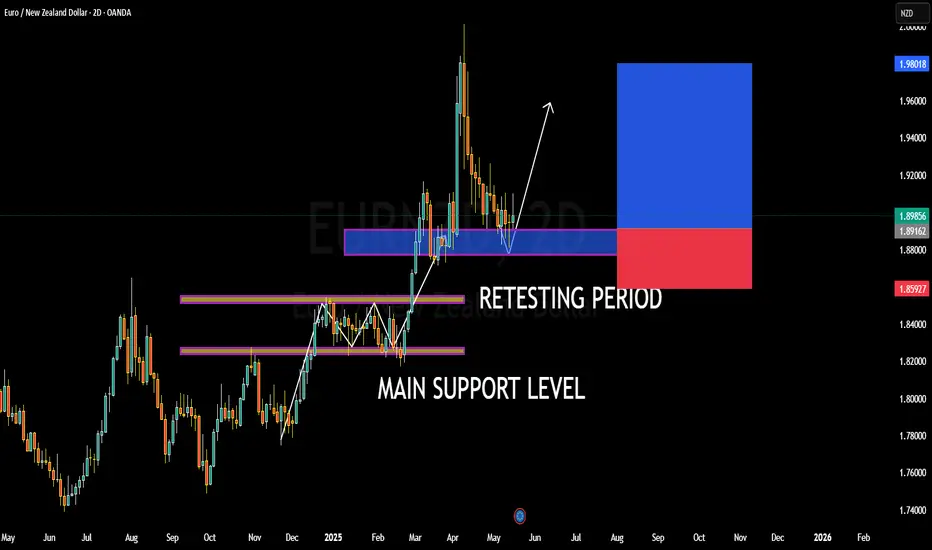
EURNZD BULLISH OR BEARISH DETAILED ANALYSISEURNZD is currently trading around the 1.89 zone after successfully completing a retest of its prior breakout area. This level aligns perfectly with a key historical demand zone, where previous resistance has now flipped into strong support. The market structure remains bullish, and the recent higher-low formation combined with increased volume suggests the pair is gearing up for its next impulsive move to the upside. The price has respected the support zone with precision, signaling institutional interest and a favorable risk-to-reward ratio for long positions.
From a fundamental perspective, the euro remains relatively supported against the New Zealand dollar due to diverging monetary policy expectations. The European Central Bank is maintaining a cautious but slightly hawkish tone amid sticky core inflation, while the Reserve Bank of New Zealand is under pressure to ease policy later this year due to softening economic indicators, including a slowdown in GDP growth and weaker labor market conditions. These macro drivers favor a bullish bias on EURNZD as capital flow leans toward safer, yield-protected assets in the eurozone.
Technically, this setup has clean market geometry. The pair has broken through a multi-month consolidation structure and is now retesting the breakout with confluence from the main support zone at 1.88–1.89. With momentum building and volume increasing on the bounce, the setup is valid for a continuation toward the 1.99 level, especially if the pair reclaims the minor resistance at 1.9050. Breakout traders and position holders should monitor this area closely for confirmation.
Overall, this is a textbook bullish continuation play. The market has absorbed sell pressure at a critical level, and the successful retest confirms the strength of the new support base. With both technical structure and macro fundamentals aligned, this setup offers high potential for trend continuation, and I'm anticipating a strong move toward 1.99 in the coming weeks.
REIUSDT Forming a Bullish Falling Wedge
REIUSDT is currently trading within a well-defined falling wedge pattern, a classic technical formation that often signals an imminent bullish reversal. As price action tightens near the apex of the wedge, REI is showing strong signs of accumulation, supported by a solid bounce from a major horizontal support zone. This key level has held multiple times, indicating buyers are stepping in with increasing conviction.
Volume is picking up in recent sessions, further validating the possibility of an upcoming breakout. A falling wedge breakout, especially with rising volume, tends to trigger powerful rallies. In this case, the projected move could see REIUSDT appreciating by 200% to 250%, targeting previous highs and major resistance levels from earlier cycles. Such explosive upside aligns well with the technical structure and growing investor attention around the project.
This setup offers a favorable risk-to-reward scenario for swing traders and mid-term investors who are watching for altcoin breakouts. With broader market sentiment leaning bullish and renewed interest flowing into undervalued coins, REIUSDT stands out as a compelling opportunity. The coin’s ability to maintain support while coiling within the wedge is a bullish signal in itself.
✅ Show your support by hitting the like button and
✅ Leaving a comment below! (What is You opinion about this Coin)
Your feedback and engagement keep me inspired to share more insightful market analysis with you!

BNBUSDT - Potential SupportWhen my latest BNB analysis() still printing, best trade is the one you make with your profits!
I'm watching BNB, specifically this blue box, where buyers might step in.
If price drops to this zone, I won't trade blindly. I'll look for a breakout above a small resistance level within the box, followed by a retest as support on a lower timeframe. This confirms buyer interest.
I'll also monitor order flow, CDV divergences, and volume spikes for clues. In narrow ranges, watch for liquidity hunts dips below support that quickly recover. Failed breakouts above resistance within the box, or regained levels, are also key.
Remember, I won't insist on a short if price breaks upward with volume and retests that level as support; I'll consider longs. Flexibility and confirmation are crucial.
I hope we reach this blue area to gauge the market reaction. Expect volatility. Missing this setup could be costly. Stay tuned for updates; you can rely on my insights.
📌I keep my charts clean and simple because I believe clarity leads to better decisions.
📌My approach is built on years of experience and a solid track record. I don’t claim to know it all but I’m confident in my ability to spot high-probability setups.
📌If you would like to learn how to use the heatmap, cumulative volume delta and volume footprint techniques that I use below to determine very accurate demand regions, you can send me a private message. I help anyone who wants it completely free of charge.
🔑I have a long list of my proven technique below:
🎯 ZENUSDT.P: Patience & Profitability | %230 Reaction from the Sniper Entry
🐶 DOGEUSDT.P: Next Move
🎨 RENDERUSDT.P: Opportunity of the Month
💎 ETHUSDT.P: Where to Retrace
🟢 BNBUSDT.P: Potential Surge
📊 BTC Dominance: Reaction Zone
🌊 WAVESUSDT.P: Demand Zone Potential
🟣 UNIUSDT.P: Long-Term Trade
🔵 XRPUSDT.P: Entry Zones
🔗 LINKUSDT.P: Follow The River
📈 BTCUSDT.P: Two Key Demand Zones
🟩 POLUSDT: Bullish Momentum
🌟 PENDLEUSDT.P: Where Opportunity Meets Precision
🔥 BTCUSDT.P: Liquidation of Highly Leveraged Longs
🌊 SOLUSDT.P: SOL's Dip - Your Opportunity
🐸 1000PEPEUSDT.P: Prime Bounce Zone Unlocked
🚀 ETHUSDT.P: Set to Explode - Don't Miss This Game Changer
🤖 IQUSDT: Smart Plan
⚡️ PONDUSDT: A Trade Not Taken Is Better Than a Losing One
💼 STMXUSDT: 2 Buying Areas
🐢 TURBOUSDT: Buy Zones and Buyer Presence
🌍 ICPUSDT.P: Massive Upside Potential | Check the Trade Update For Seeing Results
🟠 IDEXUSDT: Spot Buy Area | %26 Profit if You Trade with MSB
📌 USUALUSDT: Buyers Are Active + %70 Profit in Total
🌟 FORTHUSDT: Sniper Entry +%26 Reaction
🐳 QKCUSDT: Sniper Entry +%57 Reaction
📊 BTC.D: Retest of Key Area Highly Likely
📊 XNOUSDT %80 Reaction with a Simple Blue Box!
📊 BELUSDT Amazing %120 Reaction!
📊 Simple Red Box, Extraordinary Results
I stopped adding to the list because it's kinda tiring to add 5-10 charts in every move but you can check my profile and see that it goes on..

HolderStat┆BNBUSD 645 gate opens 730BNB price surged out of a steep falling channel and later coiled inside a tight consolidation rectangle, igniting a vertical drive that now hovers under the 645 USDT horizontal cap. Holding the breakout origin at 600‑610 keeps the upside narrative intact; clearance of 645 exposes the 720‑730 objective derived from the earlier channel depth.

XAUUSD BULLISH OR BEARISH DETAILED ANALYSISGold (XAUUSD) is currently trading around the 3170 level after pulling back from its recent highs near 3400. Price action is showing strong signs of bullish resilience as it bounces off a key support zone, suggesting the corrective phase may be nearing completion. The structure on the 2-day chart is shaping up as a healthy retracement within a strong uptrend, and the latest bounce is gaining volume, which indicates renewed buying interest and a potential re-entry point for bulls.
From a macroeconomic perspective, ongoing concerns about persistent inflation, global debt levels, and geopolitical tensions continue to support the bullish narrative for gold. With the latest U.S. CPI data showing inflation remaining above the Fed's comfort zone, the likelihood of prolonged higher interest rates remains in play. However, real yields have not kept pace, making gold an attractive hedge in this environment. Central banks worldwide are still aggressively accumulating gold as a reserve diversification strategy, which reinforces the broader demand.
Technically, the market is reacting precisely from a demand zone around 3120–3150, where historical resistance turned support. Momentum is building for a continuation of the bullish trend, and a push toward the 3500 level looks increasingly likely if price breaks above the minor resistance around 3250 with conviction. The risk-reward here remains favorable, especially with the clear invalidation level just below the recent lows.
As a professional trader, I view this structure as a textbook bullish continuation setup. The strong trend, clean bounce, and increasing volume are aligning for a potential breakout toward 3500. With macro catalysts and technical confirmation supporting the bullish bias, this is a solid opportunity for swing buyers to ride the next leg up in gold.

Altcoins Market Consolidation until 19th May 2025Total3 (Altcoins market cap) is currently consolidating between $900b-$930b expected until 19th May 2025 before the market continue to climb, just as I pointed out in last week’s analysis. No need to worry, #Altcoinseason is already here. A healthy correction is better than none.

I see ETH break the trend lineETH owner buy enough coin in their wallet with breaking the descend line.

BNBUSDT Analysis: Potential Trap at a Regular Support LevelThere is a very regular support level on BNBUSDT, which appears too consistent to be trusted. This kind of setup often acts as a trap for buyers , enticing entries before breaking down.
I plan to go long if the support is broken and price reaches my blue box zone for an optimal entry. This zone represents a strong area of interest where I anticipate a reversal back upward.
Key Points:
Regular support: Likely a trap, avoid premature entries.
Blue box: My buy zone for a potential long position after the support break.
Strategy: Wait for confirmation and enter cautiously within the blue box.
If you think this analysis helps you, please don't forget to boost and comment on this. These motivate me to share more insights with you!
I keep my charts clean and simple because I believe clarity leads to better decisions.
My approach is built on years of experience and a solid track record. I don’t claim to know it all, but I’m confident in my ability to spot high-probability setups.
My Previous Analysis
🐶 DOGEUSDT.P: Next Move
🎨 RENDERUSDT.P: Opportunity of the Month
💎 ETHUSDT.P: Where to Retrace
🟢 BNBUSDT.P: Potential Surge
📊 BTC Dominance: Reaction Zone
🌊 WAVESUSDT.P: Demand Zone Potential
🟣 UNIUSDT.P: Long-Term Trade
🔵 XRPUSDT.P: Entry Zones
🔗 LINKUSDT.P: Follow The River
📈 BTCUSDT.P: Two Key Demand Zones
🟩 POLUSDT: Bullish Momentum
🌟 PENDLEUSDT.P: Where Opportunity Meets Precision
🔥 BTCUSDT.P: Liquidation of Highly Leveraged Longs
🌊 SOLUSDT.P: SOL's Dip - Your Opportunity
🐸 1000PEPEUSDT.P: Prime Bounce Zone Unlocked
🚀 ETHUSDT.P: Set to Explode - Don't Miss This Game Changer
🤖 IQUSDT: Smart Plan
⚡️ PONDUSDT: A Trade Not Taken Is Better Than a Losing One
💼 STMXUSDT: 2 Buying Areas
🐢 TURBOUSDT: Buy Zones and Buyer Presence
🌍 ICPUSDT.P: Massive Upside Potential | Check the Trade Update For Seeing Results
🟠 IDEXUSDT: Spot Buy Area | %26 Profit if You Trade with MSB
📌 USUALUSDT: Buyers Are Active + %70 Profit in Total

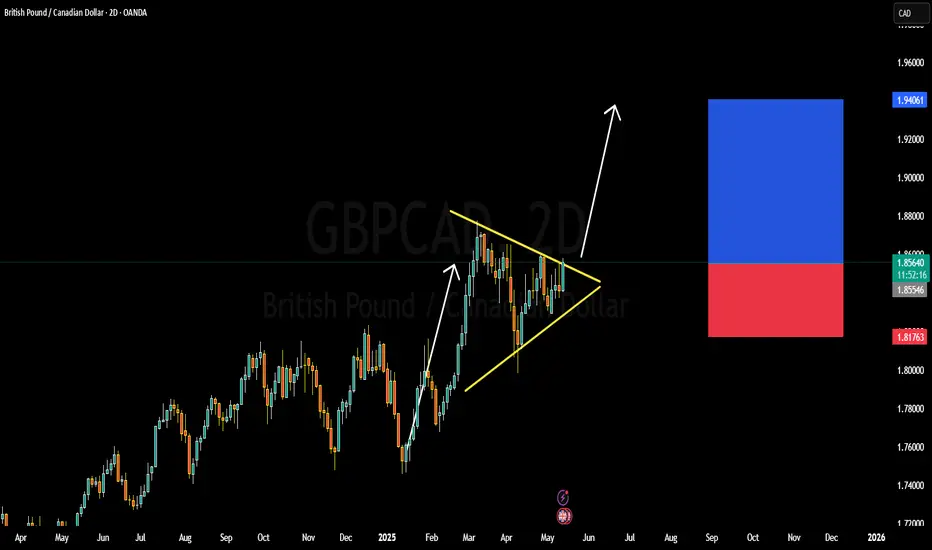
GBPCAD BULLISH OR BEARISH DETAILED ANALYSISGBPCAD is currently trading around the 1.85700 level, consolidating inside a well-defined bullish pennant on the 2-day chart. This pattern formation follows a strong impulsive rally from the 1.71000 region earlier this year, signaling that the pair is in a re-accumulation phase before its next leg higher. Price action is coiling tightly within converging trendlines, and recent volume spikes suggest increasing interest and momentum from the bulls, pointing toward a potential breakout to the upside.
On the fundamental front, the British pound is benefiting from rising wage inflation and a still-hawkish Bank of England tone, which keeps rate cut expectations muted compared to other G10 currencies. Meanwhile, the Canadian dollar remains under pressure due to softening oil prices and weaker-than-expected domestic data. The BoC has also signaled it may start easing in the coming months if inflation continues to slow, making CAD less attractive relative to GBP.
Technically, a breakout above the pennant resistance around 1.8600–1.8650 with strong bullish volume would confirm the continuation of the prior uptrend. The projected target from this pattern sits near the 1.95700 area, aligning with previous major resistance and psychological round numbers. Momentum indicators are building to the upside, and price remains above all key moving averages on the higher timeframes, reinforcing the bullish outlook.
With volume confirming accumulation, a breakout from this bullish pennant could accelerate quickly as trend-following strategies kick in. GBPCAD is well-positioned to capture the upside, and the current structure offers an excellent risk-to-reward opportunity in favor of bulls. In the context of macro divergence between GBP strength and CAD softness, the 1.95700 target looks highly achievable in the coming weeks.
Binance Coin Will Trade At $1,200+, $975 First—New ATH TargetSupport has been confirmed and Binance Coin is now moving in the bullish zone. This is perfect. Now that the bulls have control of the Cryptocurrency market, we no longer have to focus on oscillators, volume, candlestick patterns and the rest, we can simply focus on the targets; things change.
This same approach will be true for all the charts. Instead of reading the signals and sharing "proofs" supporting my bias, we will focus instead on the targets and how far up the pair in question can go. Why? Because the bullish bias has already been confirmed and we are set to grow long-term. The 2025 bull market just as promised.
The first resistance is $730. This is a strong resistance because it rejected growth several times in the past. Many times in December, several times in January and February also. The All-Time High is pretty close as well so here again we will define a range. Between $731 and $794 is the first resistance zone.
BNBUSDT can grapple with this zone for a small while only to win. The win will clear the path for higher prices and open the price discovery phase. After this resistance is broken, the rise will be smooth and nice. Just growth followed by more growth, it will feel great.
The first target will be $975. This is the 1.618 extension in relation to the size of the corrective move. This is a level to watch out for on the way up.
The next target is awesome because the number is so big and because it goes beyond $1,000. The number is $1,269, that's the second—very strong—target.
Depending on how these levels are handled, we can look again and update the chart.
I don't know if this needs to be said, but, just to be certain: Binance Coin is going up .
Namaste.

BNB/USDT Potential UpsidesHey Traders, in today's trading session we are monitoring BNBUSDT for a buying opportunity around 630 zone, BNBUSDT is trading in an uptrend and currently is in a correction phase in which it is approaching the trend at 630 support and resistance area.
Trade safe, Joe.

BNB/USDT 4H Chart: Rising Channel with Fractal Vibes!Hey traders! Binance Coin is showing some promising action that’s got me on the edge of my seat!
We’ve got a clear rising channel in play, with BNBUSDT moving beautifully in sync with a fractal line pattern shown above the chart — mirroring past price behavior like a roadmap! BNBUSDT is currently trading at $650 , I think price will continue bouncing between the channel’s support at $620-$600 and move upwards to the key resistance target at $700-$720 . A breakout above this resistance could send BNB soaring to new highs, potentially targeting $800 or beyond!
However, if BNB fails to break through, we might see a pullback to the channel support at $620-$600 .
Key Levels to Watch:
Resistance: $700-$720
Support: $620-$600
Breakout Target: $800+
Breakdown Risk: $600
Is BNB about to blast through $720, or will it retreat below support? Let’s hear your thoughts below!

AUDUSD BULLISH OR BEARISH DETAILED ANALYSISAUDUSD is currently trading at 0.6400 and forming a clear inverse head and shoulders pattern on the 12-hour timeframe, a well-known bullish reversal structure. The neckline breakout is nearing, and the recent price behavior shows strong bullish volume support, indicating growing confidence among buyers. With a projected target of 0.6700, this setup offers a favorable risk-to-reward ratio as we transition into a potential trend shift in favor of the Aussie.
On the fundamental front, the Australian dollar is benefiting from a more resilient macro backdrop. Recent Australian jobs data came in stronger than expected, and the RBA remains cautious on rate cuts, especially with inflation pressures still lingering. Meanwhile, US inflation remains sticky, but with the Fed leaning toward a “higher-for-longer” stance rather than aggressive tightening, the greenback has shown signs of exhaustion against risk-linked currencies like AUD.
Technically, the price has respected the 0.6350 support level and is now forming higher lows. The breakout of the neckline around 0.6450 could accelerate bullish momentum, especially if accompanied by a strong candle close and continued volume confirmation. The next resistance lies at 0.6550, with the larger structure aiming for a test of 0.6700. This aligns with broader market sentiment rotating into commodity currencies, particularly as China stimulus hopes and improving risk appetite lift AUD.
AUDUSD remains one of the more technically clean setups among the majors right now. With a bullish pattern forming, supportive fundamentals, and improving sentiment across risk assets, this is a setup that deserves close attention from traders looking to ride the next impulsive leg to the upside.

BNB/USDT 1D chartHello everyone, let's look at the 1D BNB chart to USDT, in this situation we can see how the price came out of the downward trend line and currently persists over it.
Going further, let's check the places of potential target for the price:
T1 = $ 686
T2 = $ 732
Т3 = $ 795
Let's go to Stop-Loss now in case of further declines on the market:
SL1 = $ 648
SL2 = $ 599
SL3 = 541 $
Looking at the RSI indicator, we see a clear increase on the indicator that crossed the upper limit, which can also affect the potential relaxation.

EASY RIDE TO $1KHi,
This is by far one of the strongest tokens in the market, even during the pullback we never witnessed a deep move on BNB.
This price has now confirmed a higher low on the weekly timeframe while breaking through a major resistance.
IMO, the next move will send the project to $1000.

BNB is in an interesting zoneBNB is going to test its ATH at previous cycle (around $700) and at the next step, its total ATH (around $800). If it break these levels, BNB parabola is inevitable. At this situation, BSC tokens like NASDAQ:FORM , $Cookie, NASDAQ:CAKE and ... will have potential to explode.

$bnb clear bullishlook for retest to long.
if spot start buying DCA
or long high lev on breakout
life time play with target atleast 900$ easily. 1000$ is momentum not stop. Goodluck all

AUDJPY BULLISH OR BEARISH DETAILED ANALYSISAUDJPY has successfully broken out of a long-term descending channel and is currently trading around 94.50. The breakout is clean and supported by solid bullish volume, which confirms that momentum is shifting in favor of the bulls. This setup indicates a clear trend reversal on the daily timeframe, and with the pair establishing higher lows and breaking resistance, the path toward 100.00 looks technically achievable in the coming weeks.
From a fundamental standpoint, the Australian dollar is gaining strength after the Reserve Bank of Australia (RBA) maintained a firm stance on inflation management. The latest CPI figures remain above the RBA’s comfort zone, and recent wage growth data has further reduced the probability of near-term rate cuts. Meanwhile, the Japanese yen continues to lag due to the Bank of Japan's ultra-loose monetary stance and consistent verbal intervention that lacks follow-through, keeping JPY broadly weaker across the board.
Technically, we’ve seen strong follow-through after the breakout, with price now holding firmly above prior resistance turned support. If this momentum sustains, we could see buyers step in aggressively, targeting 96.50 short-term and extending toward the key psychological level of 100.00 in the medium term. The risk-reward remains attractive with a clearly defined invalidation point below 91.00.
Overall, AUDJPY stands out as one of the most bullish JPY crosses on my radar. With a clean breakout, supportive fundamentals from the Australian side, and persistent weakness in the yen, this trade aligns with broader macro sentiment and could offer strong upside potential heading into the next quarter.

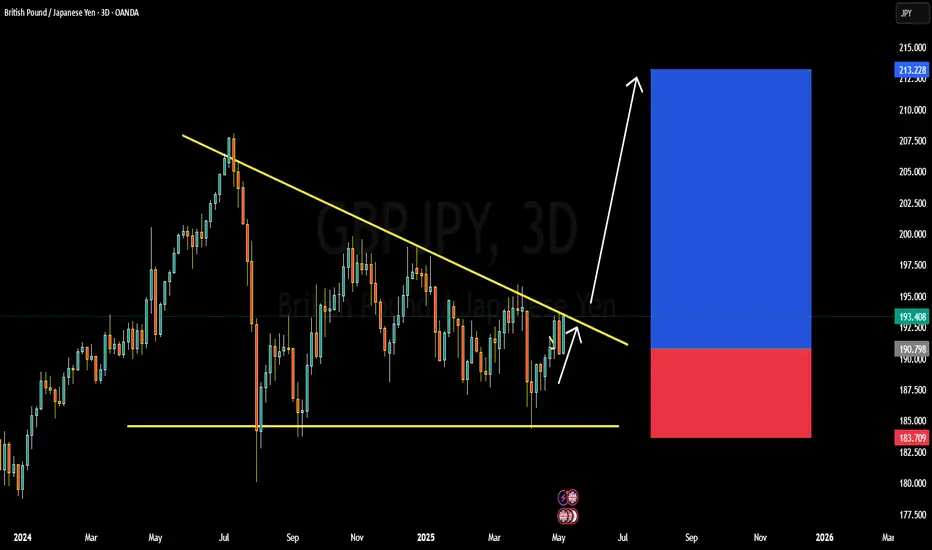
GBPJPY BULLISH OR BEARISH DETAILED ANALYSISGBPJPY is currently trading near 190.80 and is forming a significant breakout structure on the 3-day chart. After months of consolidation under a descending trendline, the pair is now coiling tightly, signaling a potential bullish breakout. The pair has respected the lower support range near 183.70 while pushing up against descending resistance multiple times. This squeeze pattern often precedes a major directional move, and with bullish momentum building, GBPJPY could be primed for a rally toward the 210.00 zone.
Fundamentally, the British pound is finding strong support from the latest hawkish commentary by the Bank of England, which has hinted that inflation remains sticky, keeping rate cut expectations delayed. On the other hand, the Japanese yen remains under consistent pressure due to the Bank of Japan's ultra-dovish stance and yield curve control policies. The BoJ’s reluctance to shift its policy outlook, coupled with soft macro data from Japan, is weakening the yen across the board.
Technically, a breakout and close above the descending trendline around 194.00 will be a key confirmation point. If this happens, bulls could dominate and push GBPJPY toward the 210.00 resistance zone in the medium term. The R\:R on this setup remains favorable with stops safely tucked below 183.70, giving this trade strong upside potential.
This pair is currently one of my top watchlist setups for May as both the technical and fundamental landscapes align. With bullish sentiment driving GBP strength and JPY weakness being a prevailing macro theme, GBPJPY could deliver a powerful upside continuation if the breakout confirms.
BNB Pump???On the daily chart of BNB, a symmetrical triangle has formed, and the price is approaching a breakout point. The $600–$604 zone, aligned with the 200-day moving average and the descending trendline, acts as a key resistance. A bullish breakout could push the price toward the $696 area. On the downside, the $575 support is crucial — if broken, the next potential drop could target the $505 zone. Price compression and declining volatility suggest a strong move is likely soon.
📈 A major move is coming for BNB!
🔺 Resistance: $604
🔻 Support: $575 and then $505

BNB is definitely on its way to $1000.BNB has been consolidating for around 250 days , which is a solid amount of time to build momentum for a breakout. It's almost certain that BNB will hit $1000 soon .
However, this prediction becomes invalid if the price breaks down below $500 with significant volume.
A good price range for accumulation is between $500–$650.
CRYPTO:BNBUSD

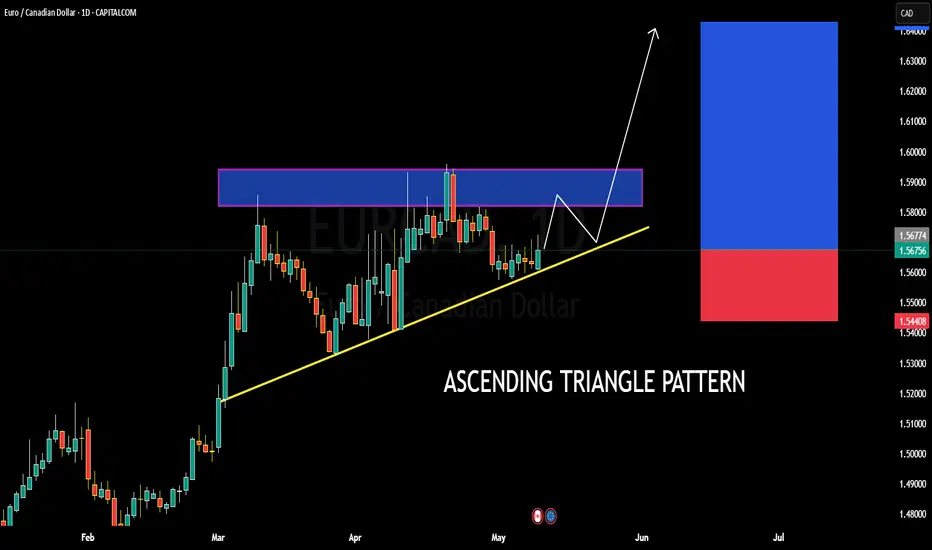
EURCAD BULLISH OR BEARISH DETAILED ANALYSISEURCAD is currently trading around 1.5600 and is consolidating within a textbook ascending triangle pattern on the daily timeframe. This setup signals a strong bullish bias as the pair continues to form higher lows, tightening under a key horizontal resistance zone between 1.5730 and 1.5770. Price is respecting the ascending trendline very well, indicating buyer strength. A breakout above this resistance zone could open the doors for a clean rally toward the 1.6400 psychological level, offering a strong risk-to-reward opportunity.
From a fundamental standpoint, the euro is gaining traction as recent Eurozone economic indicators suggest improving sentiment and a potential shift in ECB tone toward neutral. Meanwhile, the Canadian dollar remains pressured by falling crude oil prices and softening domestic data, including disappointing employment numbers this week. This divergence in fundamentals aligns well with the bullish technical structure for EURCAD, creating a high-probability scenario for buyers.
Looking ahead, a confirmed breakout above 1.5770 with volume could trigger a strong bullish impulse. The measured move from the triangle’s base supports a projection toward the 1.6400 area, making this setup attractive for swing traders aiming to ride the next leg higher. Risk should remain controlled below 1.5440, where the ascending structure would be invalidated.
I’m closely monitoring the price action near the breakout zone. Patience is key, but once we see bullish momentum pushing through the resistance, this trade setup has the potential to deliver a solid upside run. EURCAD remains one of my top bullish forex plays going into mid-May.