BNB Ready for PUMP or what ?Currently, BINANCE:BNBUSDC is forming an ascending triangle, indicating a potential price increase. It is anticipated that the price could rise, aligning with the projected price movement (AB=CD).
However, it is crucial to wait for the triangle to break before taking any action.
Give me some energy !!
Stay Awesome , CobraVanguard
J-BNB

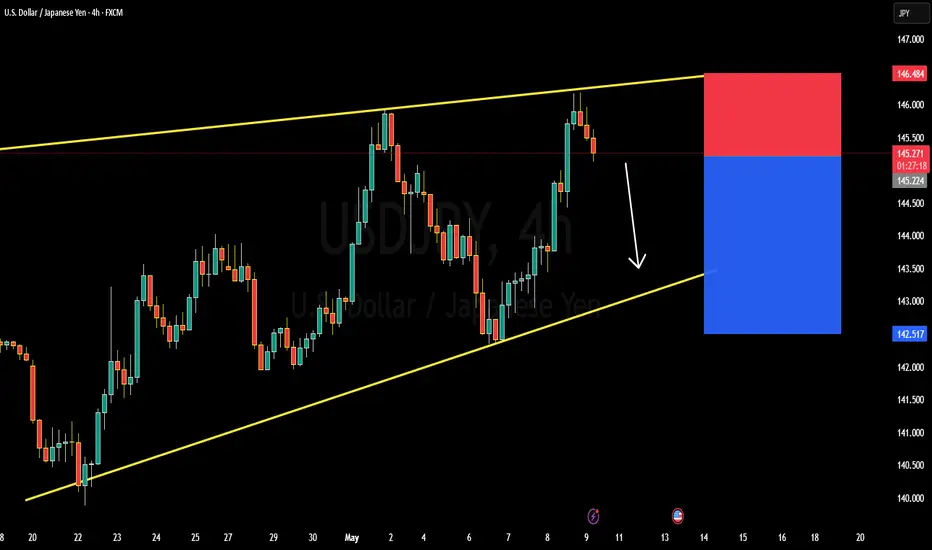
USDJPY BULLISH OR BEARISH DETAILED TECHNICAL AND FUNDAMENTALSUSDJPY is currently trading around 145.300 and showing clear signs of bearish pressure from the upper resistance of a broad ascending channel. The market structure suggests a potential rejection, and price action confirms the formation of a rising wedge pattern—a classically bearish setup indicating an upcoming correction. With momentum slowing and sellers starting to step in, I anticipate a move toward the 143.500 zone as price seeks support near the lower trendline.
From a fundamental standpoint, the US dollar is experiencing slight weakness today following softer-than-expected jobless claims data and a cooling CPI projection. Meanwhile, the Japanese yen is finding strength from renewed risk-off sentiment and speculation that the Bank of Japan may subtly shift its ultra-loose stance if inflationary pressures persist. This macro backdrop adds more weight to the potential downside in USDJPY over the next few sessions.
Technically, the price has tested the 146.000 resistance zone multiple times but failed to break above it with conviction. This repeated rejection near the top of the channel adds credibility to the bearish outlook. A breakdown from the rising wedge would likely accelerate selling pressure, pushing USDJPY toward the 143.500 level, which aligns well with previous demand zones and the channel’s lower boundary.
I’m closely watching for confirmation below the 145.000 level, which would act as a trigger for short positions. With risk-reward favoring the bears and fundamentals aligning with the technical setup, this is a solid opportunity for those looking to capitalize on a potential pullback in USDJPY.
GBPJPY BULLISH OR BEARISH DETAILED ANALYSISGBPJPY is currently trading near 192.100 and has successfully broken out of a falling wedge pattern on the 12-hour chart. This classic bullish reversal structure indicates that buyers have regained control, with momentum building for a potential move toward the 197.400 target area. The breakout candle is strong and well-formed, confirming upside interest after a period of consolidation and price compression.
Fundamentally, the Japanese yen remains under pressure due to the Bank of Japan’s continued ultra-loose monetary policy, while the pound is gaining support ahead of this week's Bank of England rate decision. Traders are pricing in cautious optimism from the BOE as inflation persists, which adds strength to GBP. The divergence in policy stance between the BOE and BOJ creates a favorable environment for GBPJPY bulls.
Technically, the falling wedge breakout is happening in line with higher lows and sustained buying volume. The 190.000 region served as a strong support base, and the breakout above wedge resistance around 191.800 now turns that area into support. The next key resistance sits at 195.000, with potential extension toward the psychological zone of 197.400.
This setup aligns with a trend continuation following the recent impulsive wave, and the risk-reward profile remains attractive for swing buyers. As long as GBPJPY holds above 190.800, the upside thesis remains valid. Keep an eye on UK rate sentiment and BOJ updates to support this technical play.

U scared, I'm eyeing $100k by May.What beautiful price action.
We are going higher.
disagree if you want.
But you should probably hedge that viewpoint, with a bullish bet.
BALLA JI!
WE WILL WIN.

BNB BUY LIMIT Hello friends
Due to the entry of buyers and the registration of higher ceilings and floors, we can buy in the direction of the trend and with capital and risk management within the specified ranges and move to the specified targets.
*Trade safely with us*

EURJPY BULLISH OR BEARISH DETAILED ANALYSIS ??EURJPY is currently trading around 162.800 and showing clear bullish momentum after a clean bounce off a strong support zone. Price has been consolidating above a well-established demand area, and today's candle confirms renewed buyer interest. The reaction from this level highlights a potential shift back to the upside, with 169.000 marked as the next significant target. The rejection wicks and structure suggest accumulation, with the market gearing up for a bullish continuation.
From a fundamental perspective, the euro is gaining strength on the back of better-than-expected economic data across the eurozone, while the Japanese yen continues to face broad pressure due to the Bank of Japan's dovish stance. The BOJ remains committed to ultra-loose monetary policy, which puts the yen at a disadvantage against stronger currencies like the euro, especially when inflation expectations in Europe remain sticky.
Technically, EURJPY has respected this support zone multiple times, creating a solid base of demand. Each test has been met with higher lows, reinforcing the bullish bias. The price action is forming a classic support-retest continuation pattern, and if this structure holds, we could see a swift move toward 169.000. Volume and momentum indicators are also beginning to align in favor of the bulls.
Looking forward, as long as price holds above the 162.200 area, the path of least resistance remains upward. Traders will be watching for continuation signals and breakouts of minor resistance zones to confirm the move. This setup offers a favorable risk-reward structure, and with market sentiment tilting toward euro strength, EURJPY has the potential to deliver solid gains in the coming sessions.

Trade Setup Alert : BNB Levels to Watch 👀 Welcome to my Trading View Analysis and Trading Channel Here , we share the latest market analysis, trading signals, and key insights together .
Ready for smarter trades ? ⭐️
📊 BNB Technical Analysis – Key Zone in Focus for the Next Move
The BNB coin recently broke above the critical $584 resistance level and has successfully consolidated above it. This marks the second time the price has touched this zone, and in response, a strong bullish candle has formed — indicating a clear respect for this important area.
📍 Key Levels & Potential Trade Setups
Currently, the $584–$618 range acts as a decision zone, and price action here will likely determine the next major move.
🟢 If the price breaks above $618:
✅ A long position trigger is confirmed
🎯 Bullish targets:
First target: $732
Second target: $793
🔴 If the price drops below $584:
✅ A short position trigger is activated
🎯 Bearish target: $531
🧠 Additional Insights:
The 3 SMA indicator is currently positioned above the consolidation zone, potentially acting as dynamic resistance.
This area holds strategic importance for the Binance Smart Chain (BSC) ecosystem, making price behavior here highly significant.
⚠️ Final Notes:
We are at a crucial inflection point in the market. So:
Watch candlestick behavior closely
Maintain proper risk management
Wait for clear breakout confirmation before entering any trade
I love you all so much . 👀
don't forget about capital management and risk management .
Be careful with your positions . 🥇

GBPUSD BULLISH OR BEARISH DETAILED ANALYSISGBPUSD is currently trading around 1.33400 and is displaying a promising bullish setup. The price action is coiling within a symmetrical triangle, which typically signals a potential breakout. A clear bullish structure has already formed following the recent impulse wave, and with the consolidation tightening, we are now closely watching for a breakout to the upside. The expected bullish breakout aligns with the projected target of 1.36000, offering a strong risk-reward opportunity for trend-following traders.
From a fundamental standpoint, the British pound is showing resilience despite broader dollar strength. Recent comments from the Bank of England have maintained a cautious yet firm tone regarding inflation control, hinting at the potential for rates to stay elevated longer than markets previously priced in. Meanwhile, the U.S. dollar index has seen some pressure amid mixed economic data and increasing speculation that the Federal Reserve may hold rates steady in the upcoming sessions.
Technically, GBPUSD remains well-supported above the 1.32500 level, with buyers defending key horizontal and trendline support areas. The recent compression in price suggests that volatility is about to expand, typically favoring the direction of the initial trend, which in this case remains bullish. Momentum indicators are beginning to curl higher, further supporting a breakout scenario.
In summary, GBPUSD is setting up for a high-probability bullish continuation. A confirmed breakout from the triangle could ignite a fresh rally toward 1.36000, especially if supported by dovish Fed rhetoric and firm UK economic sentiment. This setup is one to watch closely as it aligns both technically and fundamentally, positioning it as a favorable opportunity for medium-term swing trades.

XAUUSD Bullish or bearish Detailed AnalysisXAUUSD is currently trading around 3380, continuing its bullish momentum as previously anticipated. The price action has followed the projected path, delivering substantial profits for those positioned early. The next key resistance level is at 3450, aligning with the upper boundary of the ascending channel.
Fundamentally, gold's rally is supported by heightened safe-haven demand amid ongoing geopolitical tensions and a weakening U.S. dollar. Investors are closely watching the upcoming Federal Reserve meeting, with expectations leaning toward a dovish stance, which could further bolster gold prices .
Technical indicators suggest that the bullish trend remains intact, with the price maintaining its position above key moving averages. However, traders should be cautious of potential pullbacks as the market approaches overbought conditions.
In summary, XAUUSD is on track toward the 3450 target, supported by both technical and fundamental factors. Traders should monitor key resistance levels and macroeconomic developments to manage their positions effectively.

BNB Is Entering Into Final Stage Of Bull RunHello, Skyrexians!
BINANCE:BNBUSDT is the rare asset which showed the bull market with the Bitcoin and set the new ATH. Like Bitcoin BNB is also about to show us the final growth wave.
On the 2 weeks time frame we can see how this bull market has been developing. Awesome Oscillator gives us a hint that wave 3 is likely to be finished because we see the bearish divergence without zero line cross. Only when it crossed under zero line we can say that wave 4 is finished. Another one factor is fibonacci target area which has been reached. The next wave 5 will be started in 1-2 month and reach approximately $900.
Best regards,
Ivan Skyrexio
___________________________________________________________
Please, boost this article and subscribe our page if you like analysis!

Bitcoin (BTC) Analysis – Will the Rally Continue or Is a CorrectBitcoin is currently trading at $94,500 💰, but statistical studies and mathematical models indicate a potential downward movement 📉 that could push the price toward $93,800, with a strong likelihood of testing the $89,900 zone.
🛡️ Critical Support at $89,000
To maintain the long-term bullish trend, it is crucial that Bitcoin holds above the $89,000 support level. If the price closes below this level for an entire week, it would be a clear negative signal ❌ and could suggest a trend reversal to the downside for a longer period before any renewed upward movement.
✅ When Does the Correction End?
According to statistical studies and mathematical models, the clearest signal that the current correction has ended would be a break above $97,650 followed by three consecutive daily closes above this level 📈.
If this scenario plays out, we could see a strong and rapid surge toward the following targets:
🎯 Target 1: $104,900
🎯 Target 2: $112,900
💡 Investor Advice
If the breakout occurs, it is advisable to take profits 💸 at the mentioned targets and avoid entering new positions until further notice. The market could experience dramatic and swift movements ⚡, so caution is essential.
📢 The analysis will be updated upon reaching these levels to provide a clearer outlook based on price behavior at that time.
Would you like this version formatted for social media, blog post, or perhaps exported as a PDF or presentation slide?

USDCAD BULLISH OR BEARISH DETAILED ANALYSISUSDCAD is currently trading around 1.3820, exhibiting a bullish bias as it approaches the upper boundary of a consolidation range. The pair has been forming a symmetrical triangle pattern, indicating potential for a breakout. A decisive move above the 1.3850 resistance level could pave the way toward the 1.3920 target.
Fundamentally, the U.S. dollar has gained strength due to stronger-than-expected manufacturing data, with the ISM PMI rising to 48.7 in April, surpassing forecasts. This data has bolstered U.S. yields and supported the dollar. Conversely, the Canadian dollar has faced pressure from weaker domestic manufacturing activity, with the S\&P Global Canada Manufacturing PMI falling to 45.3, marking the sharpest contraction since May 2020 .
Additionally, recent U.S. tariff announcements on Canadian goods have introduced further uncertainty, potentially impacting Canada's export-driven economy. The Bank of Canada may consider easing monetary policy to counteract these challenges, which could further weaken the Canadian dollar.
In summary, USDCAD is poised for a potential breakout above 1.3850, driven by a combination of technical patterns and fundamental factors favoring the U.S. dollar. Traders should monitor key resistance levels and economic indicators to confirm the continuation of this upward trend.

Macro Distribution on BNB is about to play outBNB is showing clear signs of distribution on the Macro to those who know what to look for.
Big players are selling at the tops and loading off on retail. If we lose the $500 level we could head much lower.

BNB/USDT 1D chart Hello everyone, let's look at the 1D BNB chart to USDT, in this situation we can see how the price moves in a triangle where there is still space to keep the currently ongoing side trend. Going further, let's check the places of potential target for the price:
T1 = $ 599
T2 = $ 617
Т3 = $ 644
Let's go to Stop-Loss now in case of further declines on the market:
SL1 = $ 580
SL2 = $ 559
SL3 = $ 542
SL4 = 521 $
Looking at the MacD indicator, you can see an attempt to return to the upward trend, but here we do not have clear confirmation, which is why it is worth being careful.

IMXUSDT Forming Inverse Head and Shoulder
IMXUSDT is currently showcasing one of the most reliable bullish reversal patterns on the charts – the inverse head and shoulders. This formation typically signals a shift from a bearish to a bullish trend, and with the neckline nearing a potential breakout point, this setup is becoming increasingly attractive. The current price action reflects a strong bounce from a key support level, aligning perfectly with the right shoulder of the pattern.
Volume has started to rise significantly during this bounce, which further validates the possibility of a confirmed breakout once the neckline is breached. Such volume activity typically precedes large price movements, especially when it coincides with technical patterns like this. Traders and investors are beginning to recognize this potential and are showing renewed interest in IMX.
With an expected gain of 150% to 160% from current levels, this setup could be one of the most explosive moves in the altcoin space. The pattern targets suggest a move toward previous highs, making IMXUSDT a strong candidate for mid-term bullish trades. The broader market sentiment also supports altcoin rallies, adding fuel to the bullish thesis for this coin.
✅ Show your support by hitting the like button and
✅ Leaving a comment below! (What is You opinion about this Coin)
Your feedback and engagement keep me inspired to share more insightful market analysis with you!

TURBOUSDT Showing Bullish Breakout
TURBOUSDT has successfully bounced from a strong support zone, marked by extended consolidation and accumulation in the highlighted pink range. This critical area acted as a base for bullish interest and now the price is showing a breakout pattern with a surge in both volume and momentum. This is typically a strong sign of renewed bullish sentiment among retail and institutional traders.
As seen in the chart, Turbo is currently trading around 0.0055 and could be setting up for a major move towards the projected price target of approximately 0.013. That’s a potential gain of over 130%, which makes this trade highly attractive for short to mid-term swing traders. The volume confirmation adds further strength to the breakout, suggesting that demand is increasing and sellers are drying up.
Technically, the market structure has shifted with higher highs and higher lows, signaling trend reversal from the downtrend seen earlier in the year. If price holds above the breakout zone, we could witness rapid movement to the upside. Investors are taking interest in this low-cap gem, especially with current sentiment favoring altcoin breakouts.
✅ Show your support by hitting the like button and
✅ Leaving a comment below! (What is You opinion about this Coin)
Your feedback and engagement keep me inspired to share more insightful market analysis with you!

BNB Ready for PUMP or what ?Currently, BNB is forming an ascending triangle, indicating a potential price increase. It is anticipated that the price could rise, aligning with the projected price movement (AB=CD).
However, it is crucial to wait for the triangle to break before taking any action.
Give me some energy !!
✨We spend hours finding potential opportunities and writing useful ideas, we would be happy if you support us.
Best regards CobraVanguard.💚
_ _ _ _ __ _ _ _ _ _ _ _ _ _ _ _ _ _ _ _ _ _ _ _ _ _ _ _ _ _ _ _
✅Thank you, and for more ideas, hit ❤️Like❤️ and 🌟Follow🌟!
⚠️Things can change...
The markets are always changing and even with all these signals, the market changes tend to be strong and fast!!

BNBXBT. Bullish Cross and 71% locally.Testing the moving average as support after a bounce from a long downtrend and here right now is a good entry point. AI-Agents is quite new and here on BNB chain it makes a lot of sense as the chain is in top5 in the market (liquidity, TVL). It is difficult to find a more suitable place for this, both for investment and for tech.

GBPJPY DETAILED TECHNICAL AND FUNDAMENTALSGBPJPY is currently trading around the 191.00 zone, and price action is forming a classic bullish flag pattern on the 4H chart. This follows a strong impulse leg, suggesting a potential continuation to the upside. The consolidation is tight and healthy, showing market participants are preparing for a breakout. My upside target stands at 193.000, which aligns with the descending trendline resistance.
From a fundamental perspective, the British Pound remains supported by recent hawkish signals from the Bank of England, which is facing persistent inflation pressures. Meanwhile, the Japanese Yen continues to weaken across the board due to the Bank of Japan’s ultra-loose monetary stance and its defense of yield curve control, which makes it less attractive in a high-interest environment.
Technically, this setup aligns with key momentum indicators and market structure. If price breaks above the flag pattern with volume confirmation, we can expect buyers to take control, pushing price toward the 193.000 resistance zone. This level also coincides with a key liquidity area where prior sellers may be trapped.
Overall, GBPJPY continues to offer a solid bullish bias in the short term. The pair is fundamentally and technically aligned for a push higher. Breakout traders should monitor closely as the price approaches the upper trendline of the flag. This is one of the most watched JPY pairs right now—momentum is building.

Open Edu Surged 20% Today Gearing to Reclaim $100 Mln Mkt CapOpen Edu ( NYSE:EDU ) native token spike 20% today amidst breaking out of key resistant point setting the coast to reclaim the $100 million market cap.
Built on the BNB chain, The Open Campus Protocol is a decentralized solution for educators, content creators, parents, students, and co-publishers designed to address the major challenges in education today. Despite the critical role of educators in shaping the future generation, they are often undervalued and underpaid.
With growing interest in the world of web3.0 and NFT's, NYSE:EDU might just be a ticking time bomb that is setting the stage for a billion dollar in market cap.
As of the time of writing, NYSE:EDU is up 18% with build up momentum and RSI at 57, NYSE:EDU is gearing for a 50% breakout as conformation for the $100 million market cap sojourn.
Similarly, failure to break further above the resistant level could lead to a sell-off to the $0.096 support point.
Open Campus Price Data
The Open Campus price today is $0.153184 USD with a 24-hour trading volume of $69,244,194 USD. Open Campus is up 17.44% in the last 24 hours. The current CoinMarketCap ranking is #466, with a market cap of $62,914,963 USD. It has a circulating supply of 410,715,985 EDU coins and a max. supply of 1,000,000,000 EDU coins.

GBPUSD BULLISH OR BEARISH DETAILED ANALYSIS ??GBPUSD is looking extremely bullish on the daily timeframe, showing strong signs of continuation after a healthy pullback. Currently trading around 1.33000, the pair has respected key Fibonacci levels and is now building momentum to target 1.37000. The structure remains intact with higher highs and higher lows, indicating strong buyer control and potential for further upside movement.
From a fundamental perspective, the British pound continues to outperform as the Bank of England maintains a relatively hawkish tone amid sticky inflation pressures, while the US dollar shows signs of weakening with softer economic data and growing expectations of Fed rate cuts later this year. This divergence between the monetary policies is creating a favorable environment for GBPUSD buyers to dominate.
Technical analysis also supports the bullish bias as price action remains well above the 0.786 Fibonacci retracement level, holding strong support near 1.31650. If price maintains above this zone and breaks past minor resistance near 1.33500, it could ignite a fresh bullish rally toward the psychological level of 1.37000, offering excellent risk-reward opportunities for trend-following traders.
Overall, GBPUSD is positioned perfectly for a strong bullish wave. Traders should stay focused on potential breakout confirmations and capitalize on the momentum, as current market conditions and fundamentals are aligned with a profitable bullish move. This setup remains one of the most attractive trending opportunities on the board right now.

GBPJPY NEXT WEEK BULLISH OR BEARISH ??GBPJPY is setting up for a major breakout on the weekly timeframe. After weeks of consolidation under a clear descending trendline, price action is now approaching a decisive point where a bullish breakout could trigger a strong rally. With the current price holding firm at 191.00 and clear resistance overhead, a successful breakout could open the doors for a powerful bullish wave targeting 205.000 and beyond.
Fundamentally, the yen remains weak due to continued Bank of Japan dovishness and ongoing yield curve control policies. Meanwhile, the British pound is finding strength as the Bank of England maintains a relatively hawkish stance with the possibility of delaying rate cuts compared to other major central banks. This fundamental divergence between GBP and JPY heavily favors bullish momentum for GBPJPY.
Technically, the pair has formed a solid base of support and is squeezing toward the apex of a descending triangle. If the breakout confirms with strong bullish volume, GBPJPY could enter a fresh bullish cycle, offering a great risk-reward setup for medium to long-term traders aiming for the 205.000 area.
Overall, GBPJPY remains one of the hottest pairs on watch right now with excellent bullish potential. Traders should watch for a clean breakout above the trendline with strong candlestick confirmation to ride the wave higher. Staying patient and disciplined around this breakout zone could deliver highly profitable results.

HEIUSDT Falling Wedge Pattern Targets 150%-160% Gains!HEIUSDT is currently forming a strong falling wedge pattern, a classic bullish reversal signal. The price has been consolidating within this wedge for some time, and we are now starting to see a breakout attempt with good supporting volume. This setup is gaining attention among investors who are looking for promising opportunities in the altcoin market.
Volume has notably increased, suggesting strong buying pressure is building up. Historically, falling wedges often lead to explosive upward moves once a breakout is confirmed. In this case, the projected gain is around 150% to 160%, which makes HEIUSDT a very interesting pair to watch in the coming days and weeks.
Many traders are keeping a close eye on HEIUSDT due to the solid technical pattern and growing market interest. If momentum continues and broader crypto sentiment remains positive, this breakout could lead to substantial price appreciation. Risk management is key, but the potential reward here looks highly attractive.
✅ Show your support by hitting the like button and
✅ Leaving a comment below! (What is You opinion about this Coin)
Your feedback and engagement keep me inspired to share more insightful market analysis with you!
