USD/JPY Bearish Flag (30.06.2025)The USD/JPY Pair on the M30 timeframe presents a Potential Selling Opportunity due to a recent Formation of a Bearish Flag Breakout Pattern. This suggests a shift in momentum towards the downside in the coming hours.
Possible Short Trade:
Entry: Consider Entering A Short Position around Trendline Of The Pattern.
Target Levels:
1st Support – 143.40
2nd Support – 142.86
🎁 Please hit the like button and
🎁 Leave a comment to support for My Post !
Your likes and comments are incredibly motivating and will encourage me to share more analysis with you.
Best Regards, KABHI_TA_TRADING
Thank you.
Disclosure: I am part of Trade Nation's Influencer program and receive a monthly fee for using their TradingView charts in my analysis.
J-DXY

DXY 1D – Tipping Point: News or Price Action?Hey Guys,
The DXY index is currently moving within a downtrend. This trend is unlikely to reverse unless it breaks above the 98.950 level.
Sure, key fundamental data could shift the trend, but without those news catalysts, a reversal at this point doesn’t seem realistic.
Don’t forget—98.950 is a critical threshold for the DXY.
I meticulously prepare these analyses for you, and I sincerely appreciate your support through likes. Every like from you is my biggest motivation to continue sharing my analyses.
I’m truly grateful for each of you—love to all my followers💙💙💙

DXY USD Dollar Bearish Short term, then bullishI am not a financial advisor. This is not meant to be and does not constitute financial, investment, trading, or any other types of advice or recommendation.

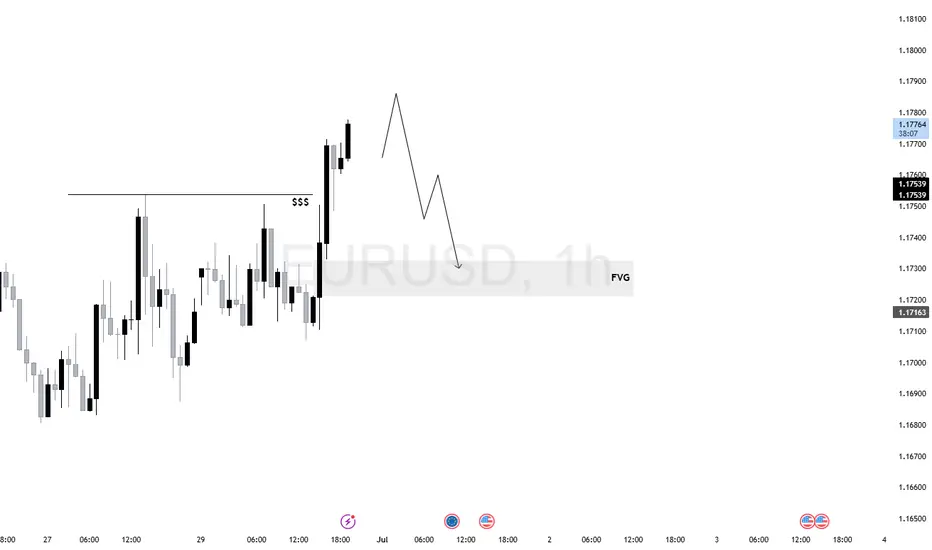
$EU (EURUSD) 1H AnalysisEURUSD swept short-term sell-side liquidity and printed a strong displacement above the relative equal highs.
Price is now in premium territory and likely hunting liquidity before rebalancing.
Bias remains bearish if price fails to form higher-timeframe continuation. Ideal setup would be a short from signs of rejection toward 1.17163 FVG zone.
Bearish drop?US Dollar Index (DXY) has reacted off the pivot, which has been identified as a pullback resistance and could drop to the 1st support.
Pivot: 97.80
1st Support: 95.40
1st Resistance: 99.36
Risk Warning:
Trading Forex and CFDs carries a high level of risk to your capital and you should only trade with money you can afford to lose. Trading Forex and CFDs may not be suitable for all investors, so please ensure that you fully understand the risks involved and seek independent advice if necessary.
Disclaimer:
The above opinions given constitute general market commentary, and do not constitute the opinion or advice of IC Markets or any form of personal or investment advice.
Any opinions, news, research, analyses, prices, other information, or links to third-party sites contained on this website are provided on an "as-is" basis, are intended only to be informative, is not an advice nor a recommendation, nor research, or a record of our trading prices, or an offer of, or solicitation for a transaction in any financial instrument and thus should not be treated as such. The information provided does not involve any specific investment objectives, financial situation and needs of any specific person who may receive it. Please be aware, that past performance is not a reliable indicator of future performance and/or results. Past Performance or Forward-looking scenarios based upon the reasonable beliefs of the third-party provider are not a guarantee of future performance. Actual results may differ materially from those anticipated in forward-looking or past performance statements. IC Markets makes no representation or warranty and assumes no liability as to the accuracy or completeness of the information provided, nor any loss arising from any investment based on a recommendation, forecast or any information supplied by any third-party.

GOLD - SHORT TO $2,800 (UPDATE)As expected last week Gold climbed into our 'Supply Zone' of $3,347 & rejected as I said it would on our video analysis. It even managed to close below our 'BOS' zone.
The game plan this week is to keep an eye on market structure for further sells. With every pump up we should be looking at how price can sell off again & how we can join the sell trend to profit off it.

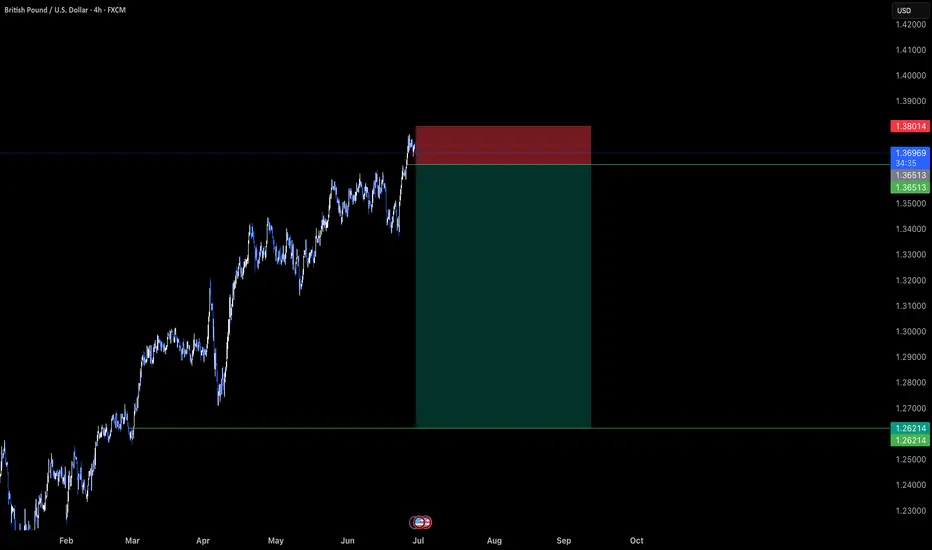
GBPUSD - OUTLOOK This is my technical perspective on GBPUSD.
Fundamentally expecting the Dollar to strengthen in the coming weeks
"May fortune attend thee, and thy trade prosper." .......L2Earned
Economic Red Alert: China Dumps $8.2T in US BondsThe Great Unwinding: How a World of Excess Supply and Fading Demand Is Fueling a Crisis of Confidence
The global financial system, long accustomed to the steady hum of predictable economic cycles, is now being jolted by a dissonant chord. It is the sound of a fundamental paradigm shift, a tectonic realignment where the twin forces of overwhelming supply and evaporating demand are grinding against each other, creating fissures in the very bedrock of the world economy. This is not a distant, theoretical threat; its tremors are being felt in real-time. The most recent and dramatic of these tremors was a stark, headline-grabbing move from Beijing: China’s abrupt sale of $8.2 trillion in U.S. Treasuries, a move that coincided with and exacerbated a precipitous decline in the U.S. dollar. While the sale itself is a single data point, it is far more than a routine portfolio adjustment. It is a symptom of a deeper malaise and a powerful accelerant for a crisis of confidence that is spreading through the arteries of global finance. The era of easy growth and limitless demand is over. We have entered the Great Unwinding, a period where the cracks from years of excess are beginning to show, and the consequences will be felt broadly, from sovereign balance sheets to household budgets.
To understand the gravity of the current moment, one must first diagnose the core imbalance plaguing the global economy. It is a classic, almost textbook, economic problem scaled to an unprecedented global level: a glut of supply crashing against a wall of weakening demand. This imbalance was born from the chaotic response to the COVID-19 pandemic. In 2020 and 2021, as governments unleashed trillions in fiscal stimulus and central banks flooded the system with liquidity, a massive demand signal was sent through the global supply chain. Consumers, flush with cash and stuck at home, ordered goods at a voracious pace. Companies, believing this trend was the new normal, ramped up production, chartered their own ships, and built up massive inventories of everything from semiconductors and furniture to automobiles and apparel. The prevailing logic was that demand was insatiable and the primary challenge was overcoming supply-side bottlenecks.
Now, the bullwhip has cracked back with a vengeance. The stimulus has faded, and the landscape has been radically altered by the most aggressive coordinated monetary tightening in modern history. Central banks, led by the U.S. Federal Reserve, hiked interest rates at a blistering pace to combat the very inflation their earlier policies had helped fuel. The effect has been a chilling of economic activity across the board. Demand, once thought to be boundless, has fallen off a cliff. Households, their pandemic-era savings depleted and their purchasing power eroded by stubborn inflation, are now contending with cripplingly high interest rates. The cost of financing a home, a car, or even a credit card balance has soared, forcing a dramatic retrenchment in consumer spending. Businesses, facing the same high borrowing costs, are shelving expansion plans, cutting capital expenditures, and desperately trying to offload the mountains of inventory they accumulated just a year or two prior.
This has created a world of profound excess. Warehouses are overflowing. Shipping rates have collapsed from their pandemic peaks. Companies that were once scrambling for microchips are now announcing production cuts due to a glut. This oversupply is deflationary in nature, putting immense downward pressure on corporate profit margins. Businesses are caught in a vise: their costs remain elevated due to sticky wage inflation and higher energy prices, while their ability to pass on these costs is vanishing as consumer demand evaporates. This is the breeding ground for the "cracks" that are now becoming visible. The first casualties are the so-called "zombie companies"—firms that were only able to survive in a zero-interest-rate environment by constantly refinancing their debt. With borrowing costs now prohibitively high, they are facing a wave of defaults. The commercial real estate sector, already hollowed out by the work-from-home trend, is buckling under the weight of maturing loans that cannot be refinanced on favorable terms. Regional banks, laden with low-yielding, long-duration bonds and exposed to failing commercial property loans, are showing signs of systemic stress. The cracks are not isolated; they are interconnected, threatening a chain reaction of deleveraging and asset fire sales.
It is against this precarious backdrop of a weakening U.S. economy and a global supply glut that China’s sale of U.S. Treasuries must be interpreted. The move is not occurring in a vacuum. It is a calculated action within a deeply fragile geopolitical and economic context, and it carries multiple, overlapping meanings. On one level, it is a clear continuation of China’s long-term strategic objective of de-dollarization. For years, Beijing has been wary of its deep financial entanglement with its primary geopolitical rival. The freezing of Russia’s foreign currency reserves following the invasion of Ukraine served as a stark wake-up call, demonstrating how the dollar-centric financial system could be weaponized. By gradually reducing its holdings of U.S. debt, China seeks to insulate itself from potential U.S. sanctions and chip away at the dollar's status as the world's undisputed reserve currency. This $8.2 trillion sale is another deliberate step on that long march.
However, there are more immediate and tactical motivations at play. China is grappling with its own severe economic crisis. The nation is battling deflation, a collapsing property sector, and record-high youth unemployment. In this environment, its primary objective is to stabilize its own currency, the Yuan, which has been under intense downward pressure. A key strategy for achieving this is to intervene in currency markets. Paradoxically, this intervention often requires selling U.S. Treasuries. The process involves the People's Bank of China selling its Treasury holdings to obtain U.S. dollars, and then selling those dollars in the open market to buy up Yuan, thereby supporting its value. So, while the headline reads as an attack on U.S. assets, it is also a sign of China's own domestic weakness—a desperate measure to defend its own financial stability by using its vast reserves.
Regardless of the primary motivation—be it strategic de-dollarization or tactical currency management—the timing and impact of the sale are profoundly significant. It comes at a moment of peak vulnerability for the U.S. dollar and the Treasury market. The dollar has been extending massive losses not because of China’s actions alone, but because the underlying fundamentals of the U.S. economy are deteriorating. Markets are increasingly pricing in a pivot from the Federal Reserve, anticipating that the "cracks" in the economy will force it to end its tightening cycle and begin cutting interest rates sooner rather than later. This expectation of lower future yields makes the dollar less attractive to foreign investors, causing it to weaken against other major currencies.
China’s sale acts as a powerful accelerant to this trend. The U.S. Treasury market is supposed to be the deepest, most liquid, and safest financial market in the world. It is the bedrock upon which the entire global financial system is built. When a major creditor like China becomes a conspicuous seller, it sends a powerful signal. It introduces a new source of supply into a market that is already struggling to absorb the massive amount of debt being issued by the U.S. government to fund its budget deficits. This creates a dangerous feedback loop. More supply of Treasuries puts downward pressure on their prices, which in turn pushes up their yields. Higher Treasury yields translate directly into higher borrowing costs for the entire U.S. economy, further squeezing households and businesses, deepening the economic slowdown, and increasing the pressure on the Fed to cut rates, which in turn further weakens the dollar. China’s action, therefore, pours fuel on the fire, eroding confidence in the very asset that is meant to be the ultimate safe haven.
The contagion from this dynamic—a weakening U.S. economy, a falling dollar, and an unstable Treasury market—will not be contained within American borders. The cracks will spread globally, creating a volatile and unpredictable environment for all nations. For emerging markets, the situation is a double-edged sword. A weaker dollar is traditionally a tailwind for these economies, as it reduces the burden of their dollar-denominated debts. However, this benefit is likely to be completely overshadowed by the collapse in global demand. As the U.S. and other major economies slow down, their demand for raw materials, manufactured goods, and services from the developing world will plummet, devastating the export-driven models of many emerging nations. They will find themselves caught between lower debt servicing costs and a collapse in their primary source of income.
For other developed economies like Europe and Japan, the consequences are more straightforwardly negative. A rapidly falling dollar means a rapidly rising Euro and Yen. This makes their exports more expensive and less competitive on the global market, acting as a significant drag on their own already fragile economies. The European Central Bank and the Bank of Japan will find themselves in an impossible position. If they cut interest rates to weaken their currencies and support their exporters, they risk re-igniting inflation. If they hold rates firm, they risk allowing their currencies to appreciate to levels that could push their economies into a deep recession. This currency turmoil, originating from the weakness in the U.S., effectively exports America’s economic problems to the rest of the world.
Furthermore, the instability in the U.S. Treasury market has profound implications for every financial institution on the planet. Central banks, commercial banks, pension funds, and insurance companies all hold U.S. Treasuries as their primary reserve asset. The assumption has always been that this asset is risk-free and its value is stable. The recent volatility and the high-profile selling by a major state actor challenge this core assumption. This forces a global repricing of risk. If the "risk-free" asset is no longer truly risk-free, then the premium required to hold any other, riskier asset—from corporate bonds to equities—must increase. This leads to a tightening of financial conditions globally, starving the world economy of credit and investment at the precise moment it is most needed.
In conclusion, the abrupt sale of $8.2 trillion in U.S. Treasuries by China is far more than a fleeting headline. It is a critical data point that illuminates the precarious state of the global economy. It is a manifestation of the Great Unwinding, a painful transition away from an era of limitless, debt-fueled demand and toward a new reality defined by excess supply, faltering consumption, and escalating geopolitical friction. The underlying cause of this instability is the deep imbalance created by years of policy missteps, which have left the world with a glut of goods and a mountain of debt. The weakening U.S. economy and the resulting slide in the dollar are the natural consequences of this imbalance. China’s actions serve as both a symptom of this weakness and a catalyst for a deeper crisis of confidence in the U.S.-centric financial system. The cracks are no longer hypothetical; they are appearing in the banking sector, in corporate credit markets, and now in the bedrock of the system itself—the U.S. Treasury market. The tremors from this shift will be felt broadly, ushering in a period of heightened volatility, economic pain, and a fundamental reordering of the global financial landscape.

SELL FIBERAfter yesterdays stop out we are at it again, we believe EURUSD bears will step in at current prices. Our sell entry is at 1.17100 our TIGHT stop loss is at 1.17500 and target is as low as 1.14500 . Use proper risk management and always risk what you can afford to loose. Cheers gang

Whats the Play for the week? Are we bullish?Looking for more bullish activity to continue. Just need to see price confirm if it is indeed ready to proceed. if we can find a solid entry we will rock with it. but not trying to force anything.

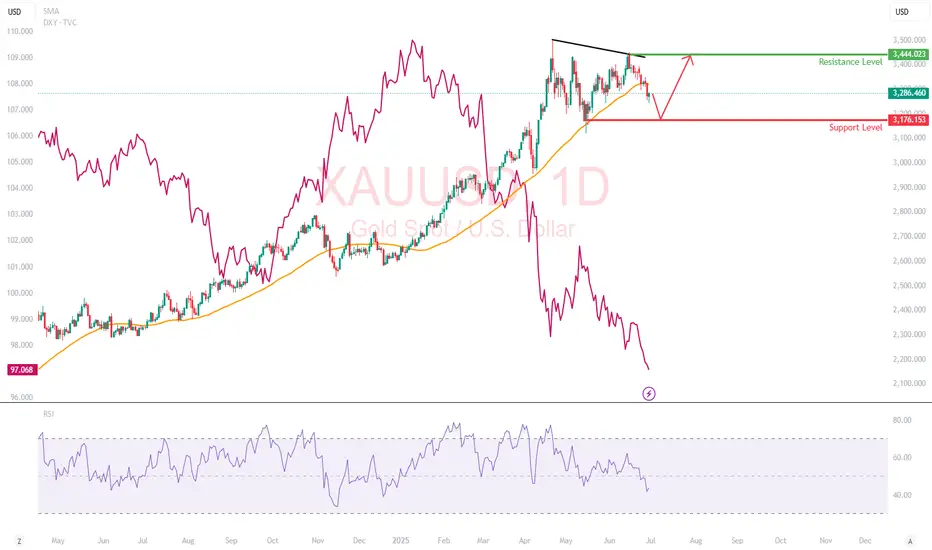
Gold in a Shifting Macro Landscape Fundamentals First: Why is Gold Falling While DXY is Too?
Normally, gold and the U.S. dollar share an inverse relationship (which means, when DXY weakens, gold rises). But recently, this correlation has broken down, and that divergence is a loud macro signal.
What’s Happening:
Trade Deal Optimism:
Headlines suggest the U.S. is nearing a resolution with China and other partners. With reduced geopolitical tension, investors are reallocating from safe-haven assets like gold into risk-on trades like equities and crypto.
Iran-Israel Ceasefire:
The temporary cooling of conflict has revived risk appetite. Traders are rotating out of war hedges (like gold and oil) and into tech, growth, and EM plays.
Real Yields Still Elevated:
Despite a softening Fed narrative, U.S. real yields remain positive, keeping pressure on non-yielding assets like gold. The fact that gold couldn't rally even as the 10-year note softened post-Moody's downgrade could be telling.
My Perspective:
This is the first clear signal in months that geopolitical hedging may have peaked. When gold decouples from its safe-haven narrative despite macro uncertainty, that often precedes a structural rotation phase, especially if institutional flows favor equities.
Technical Breakdown
Gold has broken below its 50-day SMA at $3,322 and is trading in the lower third of its 3-month range. While the daily candles show increasing selling pressure, especially on lower highs (a sign of weakening bullish momentum)
RSI : Falling toward 40, with no bullish divergence yet.
Support Level : $3,176: Previous swing low
Resistance Level : $3,444: previous swing high
What This Move Might Be Telling Us
When gold sells off on dollar weakness and geopolitical calm, the market isn’t just relaxing. It is rotating. The de-grossing of gold-heavy hedges: Some hedge funds may be taking profit on gold-heavy exposure from Q1’s rally.
Rise of risk appetite despite cracks: Markets are forward-pricing trade peace and earnings resilience, possibly too early. Gold might not be in trouble, but it’s on the bench. Unless something reignites fear (e.g., Fed policy mistake, Middle East flashpoint, or economic shock), capital may stay elsewhere.
Critical Channel Watch Begins on the 1-Hour Chart of USDJPY.Hey everyone,
📉 My Latest USDJPY Analysis:
USDJPY is currently moving within a downtrend. If the price breaks below the lower boundary of the parallel channel, our first target level will be 142.910. The most crucial factor here is the downward breakout of that channel—don’t overlook it.
Also, keep a close eye on key economic data releases on the fundamental side, as they could significantly influence your strategy.
I meticulously prepare these analyses for you, and I sincerely appreciate your support through likes. Every like from you is my biggest motivation to continue sharing my analyses.
I’m truly grateful for each of you—love to all my followers💙💙💙

Skeptic | Weekly Watchlist : DXY Triggers & Pro SetupsLast week, DXY played out our bearish scenario perfectly, breaking the short trigger at 98.530 and delivering a strong downward move . With Higher Wave Cycle (HWC) and Minor Wave Cycle (MWC) now bearish, I’m leaning heavier on short positions with tighter risk management. Let’s break it down with no FOMO, no hype, just reason. 📊
Daily Timeframe: The Big Picture
The key support at 98.801 was decisively broken, and we’ve confirmed below it—the major trend is now fully bearish. The next daily support lies at 96.478 , but I expect range-bound action early this week, especially after last week’s big move. Patience is key—let the market form a clear structure before jumping back in.
Key Insight: The bearish trend is locked in, but early-week consolidation is likely. Wait for the market to signal its next move.
4-Hour Timeframe: Long & Short Triggers
Zooming into the 4-hour chart, let’s pinpoint Low Wave Cycle (LWC) and triggers for long and short setups:
Short Trigger: Break below 4-hour support at 96.995 , confirmed by RSI re-entering oversold. Want to wield RSI like a pro? Check out my RSI Masterclass —it’s a game-changer! 😏
Long Trigger: Break above resistance at 98.215 . This is riskier since it’s against the bearish trend—set a wider stop-loss and take profits quickly. Why? HWC and MWC are bearish, so the first uptrend wave risks stop-loss hunts or fakeouts. I’ll drop an HWC/MWC/LWC guide soon to optimize entries, stops, and more—stay tuned!
Pro Tip: For longs, expect volatility in the first wave. Shorts align with the trend, so they’re the safer play—focus on 96.995.
Final Vibe Check
This Weekly Watchlist sets you up to trade smarter, not harder. DXY’s bearish momentum is our focus, but patience will unlock the best setups. I’ll keep you updated daily as markets evolve. Protect your capital—max 1%–2% risk per trade, no exceptions. Want the HWC/MWC/LWC guide or another pair? Drop it in the comments! If this watchlist sharpened your edge, hit that boost—it fuels my mission! 😊 Stay disciplined, fam! ✌️
💬 Let’s Talk!
Which setup are you eyeing this week? Share in the comments, and let’s crush it together!

“The Dollar Job: Break-In Strategy for 99+ Profits”💸 “DXY Heist Blueprint: Thieves’ Bullish Breakout Play” 🏴☠️
🌟Hi! Hola! Ola! Bonjour! Hallo! Marhaba!🌟
Welcome, Money Makers & Silent Robbers 🕶️💼✨
This is our next big Thief Trading Heist Plan targeting the 💵 DXY Dollar Index Vault. Armed with both technical precision 🔍 and fundamental insight 📊, we're ready to strike smart — not just fast.
🎯 THE MASTER HEIST PLAN:
🟢 ENTRY POINT – “Heist Entry Protocol”
🎯 Wait for price to break above Resistance @ 99.000 and candle to close ✅
💥 Plan A: Place Buy Stop Orders just above breakout
📥 Plan B: For Pullback Pros, use Buy Limit at recent swing low/high (15m–30m TF)
📌 Tip: Set alerts — don’t get caught napping while the vault opens! ⏰🔔
🛑 STOP LOSS – “Thief’s Escape Hatch”
🧠 Use 4H swing low at 98.100 as SL
⚖️ Adjust based on your lot size and number of open positions
🚨 Don't rush to set SL for Buy Stop entries before confirmation! Patience is part of the plan. 😎
🎯 TARGET – “Mission Objective”
💰 First Exit Target: 100.000
🏃♂️ Optional: Escape earlier near high-risk zones (Blue MA Line Trap Area)
⚔️ SCALPERS' CODE – Stay Sharp!
Only scalp on the Long side.
🔐 Use Trailing SL to guard your loot!
💸 Big wallets? Jump early.
🧠 Smaller stack? Follow the swing crew for coordinated execution.
🌐 MARKET OUTLOOK: WHY THE VAULT’S OPENING
💡 Currently seeing bullish momentum in the DXY
📈 Driven by macroeconomics, sentiment shifts, and intermarket pressure
📰 Want the full debrief? Check our analysis across:
COT Data
Geopolitics & News
Macro Trends & Sentiment
Fundamental Forces
📎🔗 See full breakdown
⚠️ TRADE MANAGEMENT ALERT
🚫 Avoid opening new trades during high-impact news
🔁 Always use Trailing Stops to lock in profits
❤️ Support The Heist – Boost the Plan!
Every boost powers our underground crew 🐱👤.
We rob the markets, not the people. 💼💰
Like & Boost to help grow the Thief Trading Gang 👊💥
Stay tuned, robbers – more heist plans dropping soon.
💸🚀📈🤑

DXY 4hour TF - June 29th, 2025DXY 6/29/25
DXY Bearish Idea
All significant timeframes (monthly,weekly,daily 4hr) appear bearish for now.
Last week on June 25th, 2025 we saw price action break through our 98.000 zone confirming more bearish movement. This week we have two likely options that we will wait for confirmation on.
Bearish Continuation - Ideally we keep with the trend and look for lower highs below 98.000 for further confirmation. If we can spot rejection from this zone it is likely we will see DXY continue bearish for the week ahead.
Reversal - This is less likely but still possible. Price action could punch back through the 98.000 resistance and begin retesting previous highs. If this happens look for candlestick confirmation above 98.000 and expect a more bullish DXY for the week ahead.

S&P 500 Outlook. Best Quarter Since 2023… But What Next?The S&P 500 just logged its best quarterly performance since Q4 2023 , surging on optimism around global trade negotiations and growing expectations that the Fed may begin cutting rates as early as September. US futures are green this morning, thanks to developments like Canada backing off digital taxes, ongoing dialogues with China ahead of the July 9 deadline, and risk-on sentiment is pushing yields and the dollar lower.
But as traders, we need to ask:
Are we witnessing a genuine economic inflection point? Or is this just a liquidity-driven rally that’s pricing in a best-case scenario?
Technical View
Support Zone: 6,150 was just broken through. And 6000, the round number level, coinciding with the 20-day EMA and previous swing level.
Resistance Levels: 6,235 is the next critical ceiling, a clean breakout could see price reach the extension level of 6,415.
Momentum Indicators: RSI remains elevated and is creeping toward the overbought. While momentum is strong, watch out for the possible development of a divergence.
Possible Scenarios
The 'Soft Landing’ Is Now the Base Case
Markets are trading as if the Fed has successfully engineered a soft landing. But that’s now fully priced in, and historically, the most dangerous trades are the ones everyone agrees on. If trade talks stall, inflation re-accelerates, or earnings disappoint, the reversal could be brutal and fast.
Risk-on Sentiment Without Volume Is a Yellow Flag
Despite the price strength, volume has been tapering off. The S&P’s recent leg up occurred on lighter-than-average participation, suggesting institutions may be watching, not chasing. That’s often the case in low-volatility summers, but it also implies that any negative catalyst could cause outsized downside moves.
Macro-Fundamentals May Not Justify Valuation Expansion
Yes, inflation is slowing, and the Fed might cut. But if they do, it’s likely because growth is weakening, not because the economy is roaring. So the very condition that triggers rate cuts could also cap earnings growth!
Projection
Bullish Scenario: A confirmed breakout above 6,280 could carry us toward 6,400–6,500 by mid-Q3, especially if the trade deals progress, July inflation comes in soft, and the Fed signals accommodation.
Bearish Risk: If price fails to hold above 6,120, especially if trade optimism fades, or inflation growth spikes or Fed rhetoric shifts hawkish again, this could then open a quick pullback toward 6,000 or lower, which also aligns with the 50-day SMA.
Key Events to Watch
July 9 Trade Talks Deadline: Any sign of stalling could bring volatility back fast.
June CPI Print (July 10): Crucial for confirming the Fed's next move.
Earnings Season Kickoff (mid-July): Tech-heavy expectations may not be easy to beat after such a strong run.
Conclusion
A record-setting quarter is impressive but not necessarily predictive. This quarter’s rally has been built more on relief and expectations than hard data. When expectations (not earnings) are doing the heavy lifting, any misstep from central banks or geopolitics could unravel gains rapidly.
A rate cut might be delayed, or inflation re-accelerates, or trade talks stall; any of these could leave equities hanging. Remember: the higher the climb without real earnings growth, the harder the fall when sentiment shifts. It's not just about the chart. It is about the narrative behind the price.
What’s your bias for Q3?
Are you buying this breakout or fading the optimism? Drop your thoughts below.

DXY Game Plan - USD IndexIt is important to watch the DXY to understand the strength of the USD across global markets.
The DXY is a key index that reflects the U.S. dollar’s dominance in foreign exchange. Therefore, tracking it can provide valuable insights into the potential direction of all major asset classes.
In this post, I’ll break down both technical and fundamental expectations.
Technical Analysis
DXY has been in a retracement phase (bearish) since January 2025. During this time, we’ve seen EUR and other major forex pairs form strong bullish trends.
Currently, the DXY is approaching a weekly bullish trendline, where I expect a potential bounce.
Additionally, DXY is trading within a discount zone (below the 0.5 Fibonacci level, also known as equilibrium). Personally, I’m watching for a deeper move into the maximum discount zone (around the 0.75 Fib level).
This area also aligns with key liquidity concepts. Ideally, I want to see a deviation below the bullish trendline, with a sweep of one of the weekly liquidity levels marked on the chart (two black horizontal lines).
I'm not relying on a clean triangle trendline retest, but it's a possibility.
Game Plan
DXY taps the bullish trendline
Deviates below it, running weekly liquidity (black lines)
Hits the max discount zone (~0.75 Fib)
Then shows signs of reversal and strength
Once that setup completes, I’ll be expecting strong USD performance, and will look to short risk assets — including stocks and major forex pairs.
Fundamental Analysis
The Federal Reserve is currently resisting pressure to cut interest rates, while Trump is vocally pushing for rate cuts.
The market is already pricing in a 79% probability of a September rate cut (source: CME FedWatch Tool), so if that happens as expected, I don’t anticipate major market reaction.
However, a surprise rate cut in July would likely trigger a flash crash in DXY/USD — though based on my game plan, I would expect a V-shaped recovery shortly afterward.
EUR, GBP, AUD, and CAD have also hit key resistance zones, so I believe we're likely to see USD strength for a while.

DXY: Local Bullish Bias! Long!
My dear friends,
Today we will analyse DXY together☺️
The market is at an inflection zone and price has now reached an area around 96.706 where previous reversals or breakouts have occurred.And a price reaction that we are seeing on multiple timeframes here could signal the next move up so we can enter on confirmation, and target the next key level of 96.819.Stop-loss is recommended beyond the inflection zone.
❤️Sending you lots of Love and Hugs❤️

Will Gold Break out for the New Month this week?I was anticipating these possible sweeps. with it being the end of the month I'm thinking I might need to do more watching for now than positioning. waiting for the market to show its hand on what it wants to do next.

Gold | Oil | Dollar | Silver | Natural Gas Price Forecast.Gold | Oil | Dollar | Silver | Natural Gas Price Forecast.
NYMEX:NG1! COMEX:GC1! AMEX:UNG COMEX:SI1!

DXY Swing Short! Sell!
Hello,Traders!
DXY keeps falling down
And the index broke the
Key wide horizontal level
Around 97.800 which is now
A resistance and the breakout
Is confirmed so we are very
Bearish biased and we will
Be expecting a bearish
Continuation on Monday
Sell!
Comment and subscribe to help us grow!
Check out other forecasts below too!
Disclosure: I am part of Trade Nation's Influencer program and receive a monthly fee for using their TradingView charts in my analysis.

RSI Flashes Warning on EURUSD: Critical Level Under Watch!Good morning traders,
If the EURUSD pair breaks below the 1.16729 level due to an RSI divergence, the next potential target could be around 1.16093.
Keep in mind that a break below 1.16729 may also signal a potential trend reversal.
I've marked the pivot points for you on the chart for better clarity.
Additionally, it's crucial to keep an eye on current economic data and news releases as part of your fundamental analysis.
I meticulously prepare these analyses for you, and I sincerely appreciate your support through likes. Every like from you is my biggest motivation to continue sharing my analyses.
I’m truly grateful for each of you—love to all my followers💙💙💙

Elliott Wave Analysis for EUR/USD - Bullish OutlookPEPPERSTONE:EURUSD
This analysis is based on the application of Elliott Wave principles for the EUR/USD market on a weekly timeframe.
💡 Wave Identification:
Corrective Cycle (ABC): After a peak marked by wave B, the market completed a 5-wave downward structure (waves 1 to 5), forming wave C, signaling a possible end of the correction.
Potential Reversal Zone (2/B): The current point is a strategic level where a bullish rebound is anticipated.
📊 Projection:
A bullish impulse is expected from point C. The initial target lies in the 1.1140 - 1.1217 zone, corresponding to key resistance levels and Fibonacci projections.
🧠 Conclusion:
A breakout above 1.0440 could confirm a significant bullish impulse, suggesting buyers are regaining control.
⚠️ Disclaimer : This analysis is not financial advice. Always conduct your own research before investing.
