Market Closed, Breaking Down Gold Outlook...While the market is closed you take the time to clear you thoughts and reset, preparing for a new week. making notes on what I'm thinking we can expect from Gold the coming week. I'm thinking they want to move bullish but I need to see how they want to play it Monday. Monday needs to break levels and hold above those levels to give more confidence hat they want to push bullish. We should find a entry after seeing that.
J-DXY

Natural Gas | Oil | Dollar | Silver | Gold Price ForecastNatural Gas | Oil | Dollar | Silver | Gold Price Forecast
NYMEX:NG1! CAPITALCOM:NATURALGAS COMEX:GC1! COMEX:SI1!

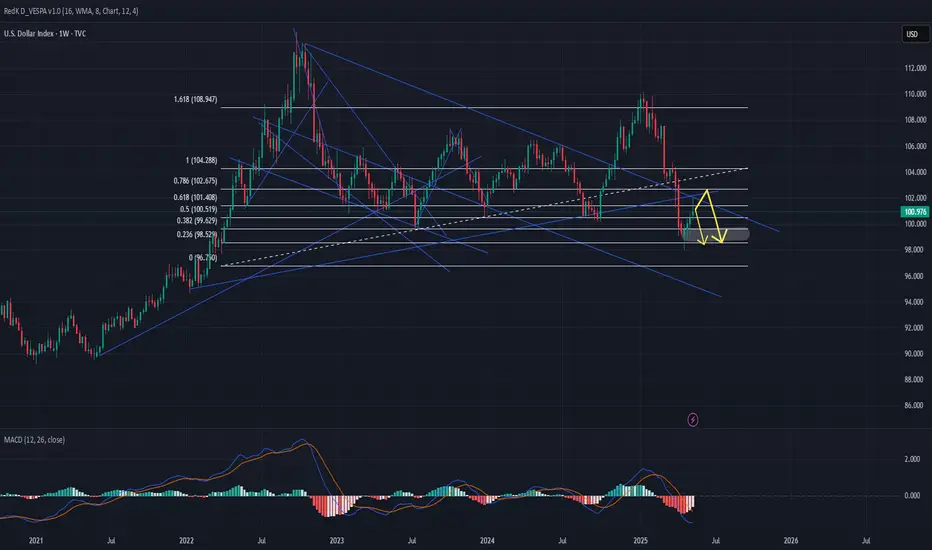
DXY - Dollar Index AnalysisThe U.S. Dollar Index (DXY) remains in a bearish zone, as indicated by the current weekly chart. There is potential for further downside movement toward the 99.70 level, which serves as a strong support area. If this level is breached, the next key support could be found near 98.56.
Alternatively, the index may experience a short-term correction to the upside. A breakout above 101.40 could trigger a move toward the 102.40 resistance level. However, this upward movement is likely to be limited, and the broader trend suggests a probable return to bearish momentum, potentially driving the index back down toward 98.56.
EurAud..Daily Volume Imbalance fillGood day traders, I’m back with another great idea on EurAud and what I like about this setup, is that we can also learn from it.
On our daily TF we have a clear volume imbalance since price opened on Monday with a gap and it failed to fill the gap last week meaning it might happen this week where price can fill the gap. On the chart I’m showing you the high/low of the volume imbalance but you can add the midpoint of that gap too if you wish to do so. Price tried filling that gap but we can see it failed to do so because price did not even get to the midpoint of the VI, after it touched the lower quarter of the VI, it pushed lower showing weakness in price.
Jumping to the present TF 4H here we can see that we have a bullish flow in price but out structure remain bearish. Going into the new week we wanna see price continue in its original structure to Atleast our first presented FVg that has been noted on the chart. Currently price is inside an inverted FVG which again supports our narrative. We can expect price to fill the 1st.PFVG on Tuesday the latest before it can move higher and for the week we want to see price close above the volume imbalance.

DXY weekly outlookWeekly analysis for DXY: the broader bias remains bullish. I expect price to respect the stacked 3‑hour demand zones, with the lower zone likely providing the stronger reaction.
After that bounce, a short‑term bearish pullback could unfold from the 4‑hour supply zone. Although I don’t trade the dollar directly, I track DXY for its correlations with other pairs to add confluence and strengthen my setups.

STRAP IN FOR A TURBULENT WEEK DXY- USD INDEX FORECAST Q2 W21 Y25DXY USD INDEX FORECAST Q2 W21 Y25
Professional Risk Managers👋
Welcome back to another FRGNT chart update📈
Diving into some Forex setups using predominantly higher time frame order blocks alongside confirmation breaks of structure.
✅ U.S. dollar index is a measure of the value of the dollar against a basket of six foreign currencies.
✅The currencies are the Euro, Swiss franc, Japanese yen, Canadian dollar, British pound, and Swedish krona.
💡Here are some trade confluences📝
✅ Break an d close below July 2023 key 100.00 levels.
✅ Foresee a pull back to, weekly imbalance, daily order block, daily 50ema, weekly order block and or weekly 50 ema.
✅ Awaiting to identify a significant break of structure bullish to use the DXY as confluence for our trading week 18 of Q2 toward key points of interest mentioned above.
✅ Forecasting continued bearish pressure long term.
✅Initially bullish outlook however upon price turn around. DXY to break 100.000 level again.
🔑 Remember, to participate in trading comes always with a degree of risk, therefore as professional risk managers it remains vital that we stick to our risk management plan as well as our trading strategies.
Pairs to look out for -
EURUSD
USDCHF
USDJPY
USDCAD
GBPUSD
Simply an opinion -
We always trade what we see and not what were think BUT, with that said it just feels... Unnatural to place too many bets against the USD. For that reason, our points of interest are not based on order black from too far in the distant weeks and month. We have identified more conservative targets for the DXY for the week 21 in Q2.
We foresee that with the deals that have been brokered alongside the steadiness of USD market sentiment, THE DXY MAY RISE AGAIN.
We forecast continued bearish sentiment of the DXY to the key points of interest area 98.000, weekly lows/daily lows BEFORE creating a monthly higher high inline with USD strength and Trumps seeks to sure up US ambitions.
📈The rest, we leave to the balance of probabilities.
💡Fail to plan. Plan to fail.
🏆It has always been that simple.
❤️Good luck with your trading journey, I shall see you at the very top.
🎯Trade consistent, FRGNT X

DOLLAR INDEXNews played a big part in the dollar tapping into that monthly fair value gap , looking for a rally up from the dollar index for the new week .

BTCUSD…relative equal lowsGood day traders, I’m back with another setup and this time we looking at the cryptocurrency (BTCUSD). This setup up is a short term trade, looking at the 1H TF we can clearly see the equal lows lows and one of lows that make up those relative lows is also our minutes TF’s low.
For the day our narrative is that internal liquidity and we also can expect price to push past that external liquidity. The 2 ray lines make up the volume imbalance that’s once price rebalances we can expect lower price for the rest of the day or maybe even rest of the week.

Ethereum is Approaching an Important Support Zone!!Hey Traders, in today's trading session we are monitoring ETH/USDT for a buying opportunity around 2,520 zone, Ethereum is trading in an uptrend and currently is in a correction phase in which it is approaching the trend at 2,520 support and resistance area.
Trade safe, Joe.

EURUSDHello Traders! 👋
What are your thoughts on EURUSD?
EUR/USD entered a corrective phase after its recent bullish rally and a test of the resistance zone.
Despite the short-term pullback, the mid-term trend remains bullish.
We expect the price to complete its correction near the identified support zone, and then resume its upward movement toward the specified target level.
This pullback may provide a buying opportunity in line with the broader trend.
Don’t forget to like and share your thoughts in the comments! ❤️

EUR/USD - Triangle Formation (16.05.2025)The EUR/USD pair on the M30 timeframe presents a Potential Buying Opportunity due to a recent Formation of a Triangle Pattern. This suggests a shift in momentum towards the upside and a higher likelihood of further advances in the coming hours.
Possible Long Trade:
Entry: Consider Entering A Long Position around Trendline Of The Pattern.
Target Levels:
1st Resistance – 1.1321
2nd Resistance – 1.1376
🎁 Please hit the like button and
🎁 Leave a comment to support for My Post !
Your likes and comments are incredibly motivating and will encourage me to share more analysis with you.
Best Regards, KABHI_TA_TRADING
Thank you.

USD/JPY - Trendline Breakout (14.05.2025)The USD/JPY Pair on the M30 timeframe presents a Potential Selling Opportunity due to a recent Formation of a Trendline Breakout Pattern. This suggests a shift in momentum towards the downside in the coming hours.
Possible Short Trade:
Entry: Consider Entering A Short Position around Trendline Of The Pattern.
Target Levels:
1st Support – 145.34
2nd Support – 143.81
🎁 Please hit the like button and
🎁 Leave a comment to support for My Post !
Your likes and comments are incredibly motivating and will encourage me to share more analysis with you.
Best Regards, KABHI_TA_TRADING
Thank you.

Solid Trend on Gold. How will we close the week?Looking for the bullish activity to continue as we close out the week. but being that it is Friday we must keep expectations low. Friday is notorious for doing whatever it wants. Patience! Wait for Killzones.

Bullish bounce?US Dollar Index (DXY) has bounced off the pivot and could rise to the 1st resistance.
Pivot: 100.27
1st Support: 99.06
1st Resistance: 101.91
Risk Warning:
Trading Forex and CFDs carries a high level of risk to your capital and you should only trade with money you can afford to lose. Trading Forex and CFDs may not be suitable for all investors, so please ensure that you fully understand the risks involved and seek independent advice if necessary.
Disclaimer:
The above opinions given constitute general market commentary, and do not constitute the opinion or advice of IC Markets or any form of personal or investment advice.
Any opinions, news, research, analyses, prices, other information, or links to third-party sites contained on this website are provided on an "as-is" basis, are intended only to be informative, is not an advice nor a recommendation, nor research, or a record of our trading prices, or an offer of, or solicitation for a transaction in any financial instrument and thus should not be treated as such. The information provided does not involve any specific investment objectives, financial situation and needs of any specific person who may receive it. Please be aware, that past performance is not a reliable indicator of future performance and/or results. Past Performance or Forward-looking scenarios based upon the reasonable beliefs of the third-party provider are not a guarantee of future performance. Actual results may differ materially from those anticipated in forward-looking or past performance statements. IC Markets makes no representation or warranty and assumes no liability as to the accuracy or completeness of the information provided, nor any loss arising from any investment based on a recommendation, forecast or any information supplied by any third-party.

USDJPY: FVG Then Bullish Overflow?It has been a significant week for USD/JPY. Following a break of structure (BOS) on the 4-hour timeframe, price moved away from equilibrium, leaving behind a Fair Value Gap (FVG). As the new week begins, we may observe a false move designed to induce traders into premature short positions before a potential bullish reversal—or vice versa. Additionally, given the recent BOS, price may temporarily stall to facilitate order accumulation. Next week will be pivotal in determining the pair’s next direction.
Watch out for the key levels

DXY (US Dollar): Bullish Order FlowA bullish order block has been identified on the H1 timeframe, situated below the Asian session range. With the US Dollar maintaining steady strength, there is potential for price to retrace into this order block for mitigation. Should this occur, a continuation of the bullish trend is anticipated, with price likely to rally and break above the recent structural high.

GBPUSD: Bearish OverflowWe got this potential Deep Crab Pattern that aligns with FVG on the Daily timeframe. It's possible we'll continue to break structure to the low if the Dollar continues to rises.

DXY 1W Forecast until the end of MAY 2025Up-trend will resume and last until the end of February 2025 topping no higher than 114. Current bottom is in at 105.9
Hence, it shouldn't fall below.
After February a consolidation period of 1,5 months will trap price action between the bottom of 122.16 and upper level of 114.9
The spring squeezed during consolidation will provide enough energy for further upwards movement starting in the end of April 2025. This will ignite a chain of devaluation of national currencies followed by epidemic inflation across the globe. This will finish/cool-down at DXY reaching the mark of 148.
New reality after May 2025?

DXY: Absolute Price Collapse Ahead! Short!
My dear friends,
Today we will analyse DXY together☺️
The in-trend continuation seems likely as the current long-term trend appears to be strong, and price is holding below a key level of 100.450 So a bearish continuation seems plausible, targeting the next low. We should enter on confirmation, and place a stop-loss beyond the recent swing level.
❤️Sending you lots of Love and Hugs❤️

DXY Bullish Rebound Expected! Buy!
Hello,Traders!
DXY is making a local
Bearish correction towards
The horizontal support level
Around 100.200 but we are
Locally bullish biased so
After the retest we will be
Expecting a local bullish rebound
Buy!
Comment and subscribe to help us grow!
Check out other forecasts below too!
Disclosure: I am part of Trade Nation's Influencer program and receive a monthly fee for using their TradingView charts in my analysis.

EUR/USD Triangle Breakout (15.05.2025)The EUR/USD Pair on the M30 timeframe presents a Potential Selling Opportunity due to a recent Formation of a Triangle Breakout Pattern. This suggests a shift in momentum towards the downside in the coming hours.
Possible Short Trade:
Entry: Consider Entering A Short Position around Trendline Of The Pattern.
Target Levels:
1st Support – 1.1085
2nd Support – 1.1030
🎁 Please hit the like button and
🎁 Leave a comment to support for My Post !
Your likes and comments are incredibly motivating and will encourage me to share more analysis with you.
Best Regards, KABHI_TA_TRADING
Thank you.


US Dollar Index (DXY) – Bullish Setup in PlayThe market has spoken and it’s whispering a potential bullish breakout .
As seen in the chart, the US Dollar Index (DXY) recently broke out from a short-term consolidation zone after forming a solid base near the 99.00 region. Currently, it's retesting a minor support level (highlighted by the yellow horizontal line).
Key Observation:
Price is holding above this support zone with strength. If this level holds, I anticipate a continuation to the upside as marked by the white arrow.
Target: The next major resistance zone lies near the 103.00 area, where price previously reversed. This becomes the logical next stop if the bullish momentum continues.
What I’m Watching:
Reaction from the current support zone
Strength of buyers stepping in
Any fundamental catalysts from USD-related news/events
In trading, it's not about predicting, it's about preparing. This chart reflects a classic "break-and-retest" scenario often seen before major moves.
Let’s see how this plays out over the coming days.
