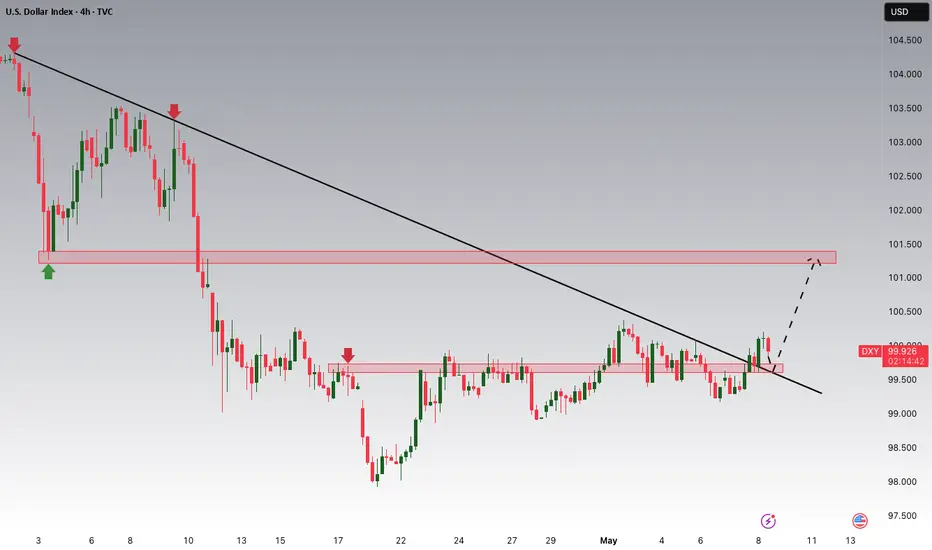
Why I'm Bullish on the DXY: A Fundamental Approach!Powell continues to take a cautious tone, emphasizing a wait-and-see approach while acknowledging rising inflation risks, which suggests there's no urgency to cut rates. This leans slightly hawkish, especially compared to the market’s more dovish expectations, and could support some near-term Dollar strength. However, a more sustained move in the USD likely hinges on progress in upcoming trade discussions—particularly with China. Today's FOMC outcome is just one part of the broader picture; the next key signal may come with developments in the coming days. For now, the bias remains USD bullish heading into the London session.
Technically, the DXY has broken its downtrend, signaling a potential shift in momentum. I’ll be watching for a possible retracement toward the 99.700 area, which could serve as a key support level before any further upside continuation.
J-DXY
GBP/USD is setting the stage for a deep correction — Don’t chaseA Smart Money trap is unfolding as price enters a major supply zone. Prepare for a sharp move.
GBP/USD is now testing a critical supply zone near 1.3300–1.3500, where institutional sellers are likely to activate.
According to Smart Money Concept (SMC) and Market Structure, we are anticipating a liquidity grab followed by a deep corrective move towards the 1.2500–1.2300 demand zone.
Key Insights:
– Major Supply Zone: 1.3300–1.3500 is the key area for potential reversals
– Expected Move: Short-term bullish exhaustion → Strong sell-off towards 1.2500
– Mid-Term Outlook: After the correction, bullish continuation possible but only from lower demand zones
– Strategy: Wait for bearish confirmation at supply zone before selling | Look for buying opportunities closer to 1.2300 if structure shifts bullish
Smart traders wait for clean entries

DXY is entering the Smart Money play — Are you ready Temporary selling pressure is unfolding, but a powerful bullish reversal zone is on the horizon! Don’t miss this key USD cycle setup
The US Dollar Index (DXY) is currently breaking down for a temporary selling phase, approaching a high-probability demand zone between 96.40–98.00.
According to the Smart Money Concept, institutional players are clearing liquidity before driving price back towards the higher supply zone (106–110).
Key Insights:
– Temporary Sell-Off: Price is moving toward the demand zone
– Bullish Reversal Expected: Watch for signs of accumulation around 96.40–98.00
– Next Target: Supply zone near 106+ levels
– Strategy: Monitor for bullish confirmation before longing
Stay ahead with clean Smart Money setups —

GOLD - WAVE 4 CORRECTION TO $2,800 (UPDATE)We've seen a nice 850 PIPS drop on Gold today, after rejecting our 0.365% zone as anticipated. Expecting a continuation lower. Still aware we are in a Wave 4 correction, so being patient with choppy price action.

GOLD - WAVE 4 CORRECTION TO $2,800 (UPDATE)We've seen a nice 850 PIPS drop on Gold today, after rejecting our 0.365% zone as anticipated. Expecting a continuation lower. Still aware we are in a Wave 4 correction, so being patient with choppy price action.

"DXY is building a textbook bullish flag — here’s exactly where For Traders (technical + confident)
DXY bulls gearing up for a double-leg rally”
1. Context & Market Structure:
After a sharp impulsive drop (green falling wedge), DXY has begun corrective accumulation in an ascending channel.
Current price 99.531 is consolidating inside a broadening bullish flag pattern.
Key Zones:
Major supply zone: 100.500 – 101.000 (highlighted yellow box)
Short-term resistance: 99.700
Short-term support: 98.8Projected Path (2 bullish legs):
First push (red path): Minor pullback → break to ~100.100
Second push (blue path): Consolidation → breakout towards 100.500–101.000 (target zone)
00–98.500
Bias:
Short-term bullish → Targeting supply zone around 100.5–101.0
Invalidation level: Clear break below 98.500 (would negate bullish setup)
>
Trade Idea:
Buy on dips within the ascending flag, targeting 100.100 and 100.500
Watch reaction near supply zone for possible reversal or continuation

XAUUSD - Gold trend after FOMC!Gold is trading above EMA200 and EMA50 on the 4-hour timeframe and is trading in its descending channel. A downward correction in gold will lead to buying opportunities from demand zone.
Barclays Bank has issued a warning that the likelihood of an economic recession in the United States is increasing. According to the bank, ongoing uncertainty in U.S. trade negotiations has weakened business confidence and reduced investment activity, which could potentially steer the economy toward contraction.
In a note to its clients, Barclays stated: “The longer this uncertainty drags on without tangible progress in negotiations, the greater the risk of a recession becomes.” While the bank still considers a mild recession to be the most likely scenario, it emphasized that this outcome could be avoided if trade tensions ease.
Barclays also pointed to challenges facing the U.S. stock market, warning that further gains in equity prices will be difficult. The bank cited downgraded corporate earnings forecasts and President Trump’s unpredictable policy decisions as major obstacles to continued market growth.
Meanwhile, investment bank Goldman Sachs reaffirmed its bullish stance on gold, forecasting that the price per ounce could reach $3,700 by the end of 2025 and rise to $4,000 by mid-2026. In the event of a U.S. recession, increased capital inflows into exchange-traded funds (ETFs) could push gold as high as $3,880. Additionally, in risk-heavy scenarios—such as shifts in U.S. reserve policy or concerns about the Federal Reserve’s independence—gold could surge to $4,500 by year-end 2025.
Analysts at CPM Group noted in their assessment that the U.S. government has recently pulled back from some of its tariff threats while also facing legal resistance and declining public support. They added that the release of weaker-than-expected economic data in recent days has raised speculation that the White House may backtrack on some of its more costly economic and political initiatives.
Nevertheless, the firm cautioned that this reduction in perceived risk is likely temporary. “The recent price drop may prove short-lived, as it seems unlikely the government will completely abandon its plans. Rather, those policies may be restructured and pursued with a new approach. As such, the latest dip in gold prices—or any near-term decline—could present a strategic buying opportunity,” they said.
CPM Group bases this outlook on the assumption that the geopolitical and economic forces that have supported gold and silver demand in recent months remain largely intact. Although some recent signals point to easing tensions, there are also indications that conditions could become more volatile later this year.
Finally, the analysts added a seasonal perspective, stating: “We expect gold prices to peak between March and May, followed by a corrective phase through August—a pattern that could pave the way for new highs later in the year. Therefore, another rally in May is plausible, and purchasing during pullbacks—or even at current levels—could be a rational decision in the very short term.”

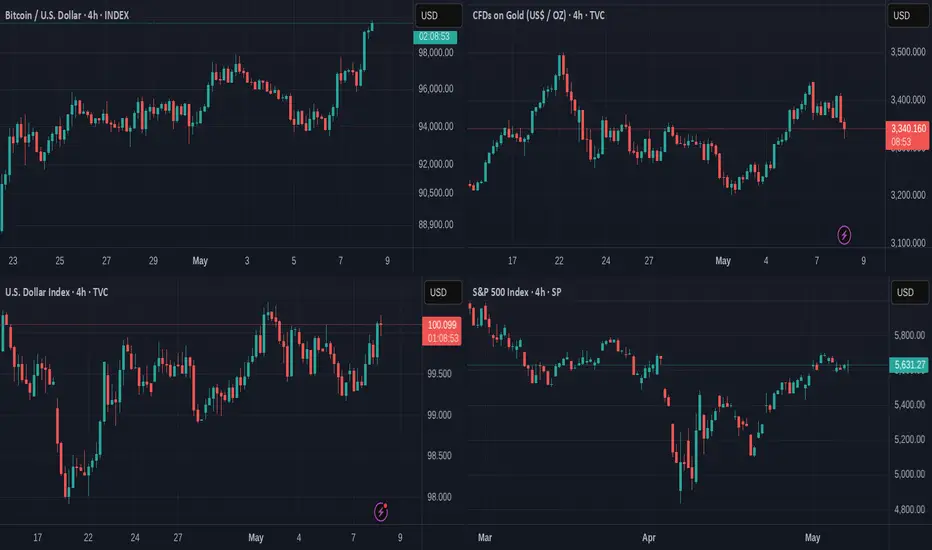
Bitcoin showing itself to be the STRONGEST ASSET right nowThsi is a VERY Bold statement but there is a saying that we need to understand
CHARTS NEVER LIE
This chart is the 4 hour charts of
Bitcoin - Gold
DXY $ - S&P500
There are a number of things to see here.
The First and strongest sign is simply that Bitcoin has risen over the last 36 hours alongside the $ Rising.
This in itself is a huge sign. 80% of the time, these 2 assets go in opposite directions. To me, this is showing a weakness in Faith in the $,
With Lower interest rates, less return on Holding. However, the USa will not want to see the $ drop much further and so I imagine it is being bought up to safeguard its price.
Next week, on the 13th, we have inflation figures published.
We need to watch that Closely.
The $ is currently Lower than it has been for a long time and while this can be seen as a Negative, it has also made American goods cheaper to buy to Foreign Markets, while it has increased the value of other Currencies.
Making the $ cheaper is potentially a Good idea.
At the same time, we see the Global traditional "Safe Haven" Selling off.
The Daily CFD on Gold chart above it has formed a double Top, that usualy creates a draw down.
It is also overbought on a daily after its recent pushes higher.
But more than anything, with interest rates remainiiiiiiiiiiiiiiiiiing static, this has released pressure of investers and so Risk appetite is returning.
Again, we need to watch what happens around the 13th when USA inflation figures are released.
And then the S&P500
Overall, it has been dropping since Feb
This Daily chart shows us It made a recovery but this may not be to go to ATH again but more part of the ABC correction.
There is a possibility it could be forming an inverse Head and Shoulders...so, again, we watch
So, over all, what we see is BITCOIN taking on all the markets and making the biggest gains
It has certainly been the least volatile with Dips and Troughs shallower than the $ and S&P500 which is Stunning if you have ridden Bitcoin for the last 10 years....
Bitcoin has Matured in to a REAL Asset Class..
For me, it is NOT Crypto anymore.
.IT IS BITCOIN
EURUSDThe third and final trade of the day will be on EURUSD.
Following the significant depreciation of the Euro during the U.S. and Asian sessions yesterday, I expect this downward trend to continue today as well. That’s why I’m opening a sell trade on the 15-minute chart (as always, using a short-term timeframe).
🔍 Criteria:
✔️ Timeframe: 15M
✔️ Risk-to-Reward Ratio: 1:2
✔️ Trade Direction: Sell
✔️ Entry Price: 1.12932
✔️ Take Profit: 1.12743
✔️ Stop Loss: 1.13028
🔔 Disclaimer: This is not financial advice. It's a trade I’m taking based on my own system, shared purely for educational purposes.
📌 If you're also interested in systematic and data-driven trading strategies:
💡 Don’t forget to follow the page and subscribe to stay updated on future analyses.

US500 - Which way will the stock market go?!The index is trading above the EMA200 and EMA50 on the four-hour timeframe and is trading in its ascending channel. If the index moves down towards the specified demand zone, one can look for further S&P buy positions with a good risk-reward ratio.
In its meeting last night, the U.S. Federal Reserve decided to keep the federal funds rate steady within the 4.25% to 4.50% range. This decision comes amid growing concerns about simultaneous rises in inflation and unemployment, particularly driven by the tariff policies of the Trump administration.
This marks the third consecutive time this year that the Fed has held rates unchanged, reflecting mounting economic uncertainty and fears of stagflation.Fed Chair Jerome Powell warned that the combination of high inflation, slow economic growth, and rising unemployment could lead the economy into stagflation. He noted that newly imposed tariffs could delay the disinflation process for up to a year or more.
The Trump administration has introduced steep tariffs, including a 145% levy on imports from China. These measures have contributed to rising prices and slower economic growth, placing additional strain on monetary policymakers.
Following the Fed’s announcement, stock markets exhibited volatility. The S&P 500 initially fell but ended the day higher. Bond yields declined, while the U.S. dollar strengthened.
Powell emphasized that future monetary policy decisions will be heavily data-dependent, and the central bank stands ready to act swiftly if necessary. He acknowledged that the economic outlook remains uncertain, requiring cautious and adaptive policy management.
Faced with escalating uncertainty and inflationary pressures stemming from new trade measures, the Fed has adopted a cautious stance. Given the current mixed economic indicators, the central bank is expected to maintain its interest rate policy until the economic picture becomes clearer.
Economists at Goldman Sachs have issued a warning that U.S. inflation is on the rise and may reach 3.8% by the end of 2025. According to their analysis, the weakening of the U.S. dollar and the implementation of tariff policies are the main drivers of increased inflationary pressure. Additionally, changes in import demand could elevate production costs and further intensify price increases.
The Wall Street Journal reported that new tariffs may raise the prices of smartphones and laptops by up to 30%. Contrary to popular belief, this inflationary impact may not be temporary and could result in sustained upward pressure on prices.
Meanwhile, ahead of the FOMC meeting, Alphabet (Google’s parent company) saw its stock plunge over 8%, falling to $149.50. Eddy Cue, a senior executive at Apple, disclosed that for the first time in April, user activity on browsers and search engines had declined. In response, Apple is exploring the integration of AI-powered search into its browsers—a move that could pose a serious threat to Google’s advertising revenue.
Simultaneously, President Trump announced he would not enforce the AI content restriction law, initially introduced during the Biden administration and scheduled to take effect on May 15. This decision comes just before his trip to the Middle East, where countries like Saudi Arabia and the UAE have voiced frustration over chip access restrictions.
Trump administration officials are currently drafting new legislation aimed at tightening control over the export of advanced chips. This initiative may form part of a broader agreement, as the UAE has pledged to invest up to $1.4 trillion in U.S. technology and infrastructure over the next decade.

DXY Rebounds on Fed Pause and Trade Deal Hopes.Macro approach:
- DXY edged higher, recovering earlier losses as the Fed held rates and Powell was cautious.
- Jun cut hopes faded, though markets expect three cuts this year, potentially lifting DXY short-term.
- A potential US-UK trade deal also helps ease bearish sentiment on the dollar.
Technical approach:
- DXY is hovering around the key resistance at around 100.200, confluence with EMA21, indicating a potential short-term correction.
- If DXY closes above the resistance at 100.200, the price may continue to claim to retest the following resistance at 101.800.
- Conversely, closing below the current trendline may lead DXY to retest the swing low at around 98.000.
Analysis by: Dat Tong, Senior Financial Markets Strategist at Exness

USDJPYHello Traders! 👋
What are your thoughts on USDJPY?
On the USD/JPY chart, we observe a breakdown of the ascending channel, which could signal a potential trend reversal and growing bearish momentum.
Currently, the price is pulling back to the broken level.
Given the overall bearish structure, we expect the downtrend to resume after the pullback completes, potentially targeting lower support levels in the sessions ahead.
Don’t forget to like and share your thoughts in the comments! ❤️

FINALLY SOME SENTIMENT AFTER FED FUND RATES!! BULLISH DXY BABY!Want to see the dollar trade higher and all foreign currency Pairs to trade lower. After new release price is really starting to show us its hand making it easier for us to look for a bias.

Gold Should complete the Retrace before giving another DirectionWas expecting the pullback. Now I just need to wait for it to finish before trying to buy it. Price should give us a solid confirmation when its finally ready. want to see them take out some lower levels first. If price gives up a entry during Asia session we could see a nice short.

Bullish bounce?US Dollar Index (DXY) is falling towards the pivot and could bounce to the 1st resistance.
Pivot: 99.61
1st Support: 99.36
1st Resistance: 100.03
Risk Warning:
Trading Forex and CFDs carries a high level of risk to your capital and you should only trade with money you can afford to lose. Trading Forex and CFDs may not be suitable for all investors, so please ensure that you fully understand the risks involved and seek independent advice if necessary.
Disclaimer:
The above opinions given constitute general market commentary, and do not constitute the opinion or advice of IC Markets or any form of personal or investment advice.
Any opinions, news, research, analyses, prices, other information, or links to third-party sites contained on this website are provided on an "as-is" basis, are intended only to be informative, is not an advice nor a recommendation, nor research, or a record of our trading prices, or an offer of, or solicitation for a transaction in any financial instrument and thus should not be treated as such. The information provided does not involve any specific investment objectives, financial situation and needs of any specific person who may receive it. Please be aware, that past performance is not a reliable indicator of future performance and/or results. Past Performance or Forward-looking scenarios based upon the reasonable beliefs of the third-party provider are not a guarantee of future performance. Actual results may differ materially from those anticipated in forward-looking or past performance statements. IC Markets makes no representation or warranty and assumes no liability as to the accuracy or completeness of the information provided, nor any loss arising from any investment based on a recommendation, forecast or any information supplied by any third-party.

DXY / EURUSD Daily signal/setupHey Guys, Made this quick video showing you actual support and resistance and correlation between pairs.
Also a small buy/sell signal for you to take a look!
Have a great day!
PS. Our last video trade hit for 80 Pips!

GOLD - WAVE 4 CORRECTION TO $2,800 (UPDATE)Gold climbed higher, but very swiftly rejected our 0.365% zone, melting back down 740 PIPS. Should see a continuation to the downside.
But as I said yesterday, if we see a breach of $3,465 then we'll create an alternate analysis which'll show Gold leading towards a new ATH, creating a 'redistribution phase' at higher prices.

Weak Low in Trading RangeVery weak low in this range shown at the horizontal ray. I expect this to be taken out at some point to "grab" liquidity. Fairly large HVN also though which could suggest a bounce as buyers defend.
When this range breaks I am unsure if it will break up or down. EUR/USD trading fairly high and dollar sentiment seems to be picking up a little, so I think it will break low, however the technical outlook says it will break up.
As mentioned previously, on the daily/weekly chart we have one half of a very clean head and shoulders and the exact mirror image on the DXY chart. So lets see.

EURUSDHello everyone.
I'm here to share a new EURUSD signal and also explain the reasoning behind this trade.
Normally, this strategy is designed for mid- to higher-timeframe trading. However, I noticed a signal from this strategy aligning perfectly with my own system on the 15M chart, which made the setup appear twice as strong.
That said, there's one caveat: the delta value is currently positive, which adds a bit of risk to this trade. Please take that into consideration.
🔍 Criteria:
✔️ Timeframe: 15M
✔️ Risk-to-Reward Ratio: 1:2
✔️ Trade Direction: Sell
✔️ Entry Price: 1.13636
✔️ Take Profit: 1.13473
✔️ Stop Loss: 1.13717
🔔 Disclaimer: This is not financial advice. It's a trade I’m taking based on my own system, shared purely for educational purposes.
📌 If you're also interested in systematic and data-driven trading strategies:
💡 Don’t forget to follow the page and subscribe to stay updated on future analyses

Price currently Bullish...But will it continue for the week?This is bullish price action i was expecting. Im just now waiting for a solid area for entry. Just have to wait for the killzones and things to line up inside of the killzone. cause outside of the killzones its nothing but chop and impulsive action that can throw you off.

GOLD - WAVE 4 CORRECTION TO $2,800 (UPDATE)Gold has climbed higher into our 0.365% zone, which I highlighted on yesterday's analysis. We will keep a close eye out to see if price action offers any rejection around this zone, for sellers to kick in. However, the closer it gets to the ATH, the higher chance of it creating a new ATH.

AUDUSD READY TO LAUNCH: HTF Bias + OB + FVG + PRIME SETUPBias:
We’re operating within a clear bullish higher time frame bias, confirmed by previous swing structure and continuous displacement to the upside. Price has consistently made higher highs and higher lows on the 4H and Daily chart.
Entry Zone:
✅ 4H Fair Value Gap (FVG) — a clean imbalance from prior bullish displacement. Price has now retraced into this inefficiency, a key area where smart money typically looks to re-accumulate.
✅ 1H Order Block (OB) — precisely overlapping the 4H FVG, strengthening the setup. This is the last bearish candle before the bullish move that created a market structure shift, now acting as a support zone.
This dual confluence—FVG + OB at a retracement level—marks a premium setup.

EURUSD EURUSD presents another buy opportunity, and I've just activated the trade.
I wanted to share it with you as well. This trade has three different Take Profit levels, which are:
1.13455 / 1.13563 / 1.13786
However, I personally plan to close the trade at 1.13455 in order to stick to my game plan.
This will be the last trade of the day for me.
🔍 Criteria:
✔️ Timeframe: 15M
✔️ Risk-to-Reward Ratio: 1:1.50 / 1:2.50 / 1:4.50
✔️ Trade Direction: Buy
✔️ Entry Price: 1.13290
✔️ Take Profit: 1.13455
✔️ Stop Loss: 1.13180
🔔 Disclaimer: This is not financial advice. It's a trade I’m taking based on my own system, shared purely for educational purposes.
📌 If you're also interested in systematic and data-driven trading strategies:
💡 Don’t forget to follow the page and subscribe to stay updated on future analyses.
