EURUSDHello everyone!
I'd like to share an ideal **Buy opportunity** on the **EURUSD** pair with you. The trade is currently **active** on my side.
🔍 **Criteria:**
✔️ Timeframe: 15M
✔️ Risk-to-Reward Ratio: 1:1.17
✔️ Trade Direction: Buy
✔️ Entry Price: 1.13204
✔️ Take Profit: 1.13335
✔️ Stop Loss: 1.13092
🔔 **Disclaimer:** This is not financial advice. It's a trade I’m taking based on my own system, shared purely for educational purposes.
📌 If you're also interested in systematic and data-driven trading strategies:
💡 Don’t forget to follow the page and subscribe to stay updated on future analyses.
J-DXY

USD/CAD - Wedge Breakout (06.05.2025)The USD/CAD pair on the M30 timeframe presents a Potential Buying Opportunity due to a recent Formation of a Wedge Breakout Pattern. This suggests a shift in momentum towards the upside and a higher likelihood of further advances in the coming hours.
Possible Long Trade:
Entry: Consider Entering A Long Position around Trendline Of The Pattern.
Target Levels:
1st Resistance – 1.3893
2nd Resistance – 1.3928
🎁 Please hit the like button and
🎁 Leave a comment to support for My Post !
Your likes and comments are incredibly motivating and will encourage me to share more analysis with you.
Best Regards, KABHI_TA_TRADING
Thank you.

Bullish Breakout for Gold???Waiting to see what they want to do. Price was bullish all day yesterday and Im trying to see if they want to give a pullback before continuing with the action. I know its best to just wait for the killzone to get the best entry.

GOLD H1 / 3285 USD & 3155 USD key BUY/SELL Levels🏆 Gold Market Mid-Term Update
📊 Technical Outlook Update
🏆 Market Overview
▪️correction in progress
▪️3285 USD overhead resistance
▪️Multiple waves of selling in progress
▪️Rejection at 3500 USD key S/R
▪️3155 USD logical next target short-term
▪️flagging on lower timeframe
▪️waves of profit taking pulling prices down
▪️3285 USD a good level to SHORT
▪️3145/3155 USD will be targeted by BEARS
▪️BULLS wait to BUY/HOLD low later
▪️Once the pullback/correction is over
📊 Gold Market Summary – May 5, 2025
🟡 Current Price: $3,266.20 (+0.82%)
📉 Weekly Close: $3,247.40 (flat for the week after sharp swings)
🇺🇸 US Jobs Data: 177K jobs added in April, earnings growth slowed to 0.2%. Market now watching Fed for rate cut signals.
🏦Fed Outlook: Mixed data fuels speculation on policy shift. Analysts see gold’s pullback as a new buying opportunity.
🌏Asian Demand: China and India remain key forces in price direction, alternating as major buyers.
📦Tariff Watch: Ongoing U.S.-China trade tension continues to weigh on risk sentiment, keeping gold in play.
🛑Geopolitics: No major updates on Iran-U.S. talks, India-Pakistan, or Russia-Ukraine ceasefire yet. These remain key risk triggers.
📈 Market Sentiment: Despite volatility, investor outlook stays bullish. Analysts eye mid-term targets above $4,000 if conditions align.

GOLD - WAVE 4 CORRECTION TO $2,800 (UPDATE)Gold starting the week with some bullish momentum. We've seen a 'BOS' to the downside, which is now being followed by a retest of a supply zone. This zone can either be around $3,317 (0.618% Fib) or higher around $3,400 zone (0.365% Fib).
Don't forget we're in a 'Wave 4 Correction' of the Elliott Wave Theory strategy. Wave 4 always has choppy price action to trap in late buyers & early sellers.

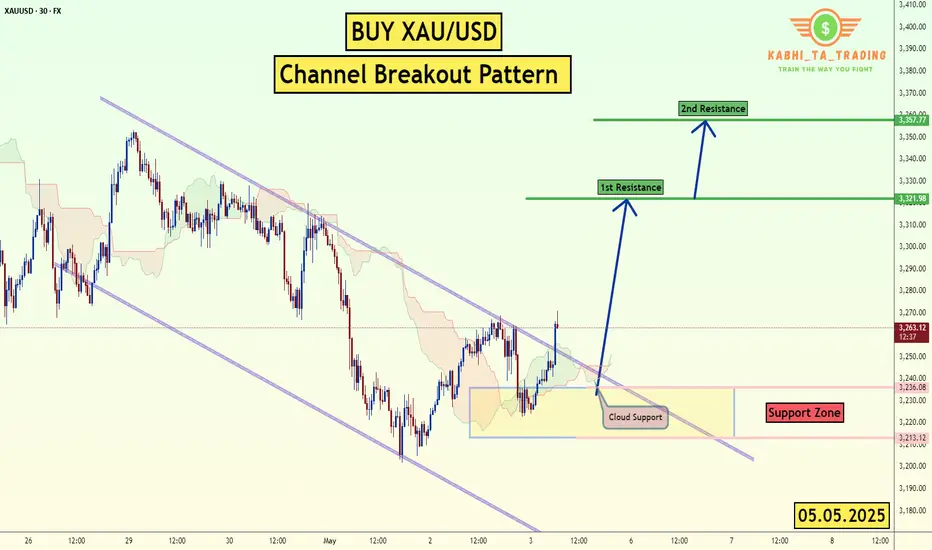
XAU/USD - Channel Breakout (05.05.2025)The XAU/USD pair on the M30 timeframe presents a Potential Buying Opportunity due to a recent Formation of a Channel Breakout Pattern. This suggests a shift in momentum towards the upside and a higher likelihood of further advances in the coming hours.
Possible Long Trade:
Entry: Consider Entering A Long Position around Trendline Of The Pattern.
Target Levels:
1st Resistance – 3321
2nd Resistance – 3357
🎁 Please hit the like button and
🎁 Leave a comment to support for My Post !
Your likes and comments are incredibly motivating and will encourage me to share more analysis with you.
Best Regards, KABHI_TA_TRADING
Thank you.
XAUUSD - Gold Trend Before FOMC!Gold is trading above its EMA200 and EMA50 on the 4-hour timeframe and is trading on its uptrend line. A continued upward move in gold will put it in the supply zone, where it is possible to look for short positions. A downward correction in gold will also open up long positions.
Gold traders endured another turbulent week, marked by the second consecutive decline in prices—once again underscoring the market’s acute sensitivity to economic news and developments.
Adrian Day, CEO of Adrian Day Asset Management, offered a cautiously humorous take on the situation by likening it to the Peggy Lee song that asks, “Is that all there is?” He pointed out that gold has pulled back by over 7% from its recent high in less than two weeks.Although this correction is notable, it hasn’t been deep enough to flush out all short-term traders or weak-handed investors from the market.
Day added that rising fears of a U.S. recession—which typically exert early downward pressure on gold—alongside the possibility of easing U.S.-China trade tensions, may limit investment demand for gold in the short term. Concluding his comments, he maintained a cautious stance, saying that further downside remains likely and that his outlook for the coming week is bearish.
Meanwhile, U.S. President Donald Trump, in a new interview with NBC, addressed several key economic and political issues. He stated that if necessary, the deadline for selling TikTok would be extended, and some tariffs on Chinese goods might become permanent. Nevertheless, he indicated that he is also considering reducing certain tariffs in the future.
Trump emphasized that small businesses do not require additional assistance and that the Federal Reserve should cut interest rates. He confirmed that Jerome Powell will remain Fed Chair through the end of his term in 2026. He also mentioned potential successors for his own position, naming Vance and Rubio as possibilities.
After a week dominated by employment data, the upcoming week will be entirely focused on monetary policy. The centerpiece will be the May FOMC meeting, the Fed’s rate decision, and Jerome Powell’s press conference on Wednesday. While markets broadly expect the Fed to hold rates steady, Powell’s official remarks and answers to press questions—especially following his sharp tone earlier in April—will be under close scrutiny.
It is widely expected that the Federal Reserve will leave its key interest rate unchanged on Wednesday, as policymakers assess how President Trump’s tariffs gradually impact various sectors of the economy. Markets are currently pricing in a potential rate cut starting in July. The Fed’s dual mandate is to maintain low inflation and high employment, and it may face a dilemma if tariffs negatively affect both indicators, as many economists now warn.
Immediately following the Fed meeting, senior policymakers including Barr, Kugler, Waller, and Cook will travel to Iceland to attend the Reykjavik Economic Conference. On Friday, they will participate in panels discussing artificial intelligence, labor market trends, and monetary research—topics that could offer insights into the Fed’s long-term policy direction.
Simultaneously, traders are also awaiting two key reports: the ISM Services Index for May, due today, and weekly jobless claims figures set for release on Thursday. Together, these reports will help complete the picture of the U.S. economy as critical monetary policy decisions approach.

GBPUSD The second trade of the day comes from the GBPUSD pair.
Even though I'm not a big fan of this pair, I believe it's worth taking advantage of the signal.
However, for this pair, I recommend slightly reducing your lot size and overall risk.
🔍 Criteria:
✔️ Timeframe: 15M
✔️ Risk-to-Reward Ratio: 1:3
✔️ Trade Direction: Buy
✔️ Entry Price: 1.32793
✔️ Take Profit: 1.33054
✔️ Stop Loss: 1.32706
🔔 Disclaimer: This is not financial advice. It's a trade I’m taking based on my own system, shared purely for educational purposes.
📌 If you're also interested in systematic and data-driven trading strategies:
💡 Don’t forget to follow the page and subscribe to stay updated on future analyses.

Oil on high time frame
"Regarding WTI oil, the price trend on high time frames is bearish, especially on the daily chart. After completing its pullback on the 4-hour chart, there are indications of further downside potential.
The market's volatility may be influenced by geopolitical tensions and political factors between Iran and the USA, as well as tariff issues. Despite these fluctuations, candle formations suggest the potential for prices to drop towards the $58 zone."
If you require more assistance or have any specific questions, feel free to ask!

Whats the direction for the Week? We should wait to see...Looking for price to go Bullish...But i need to allow Monday to play out first to give us a solid direction. They could go bullish early or they could pull back to give a lower entry first.

Bearish reversal?US Dollar Index (DXY) is rising towards the pivot and could reverse to the 1st support.
Pivot: 100.51
1st Support: 97.85
1st Resistance: 101.83
Risk Warning:
Trading Forex and CFDs carries a high level of risk to your capital and you should only trade with money you can afford to lose. Trading Forex and CFDs may not be suitable for all investors, so please ensure that you fully understand the risks involved and seek independent advice if necessary.
Disclaimer:
The above opinions given constitute general market commentary, and do not constitute the opinion or advice of IC Markets or any form of personal or investment advice.
Any opinions, news, research, analyses, prices, other information, or links to third-party sites contained on this website are provided on an "as-is" basis, are intended only to be informative, is not an advice nor a recommendation, nor research, or a record of our trading prices, or an offer of, or solicitation for a transaction in any financial instrument and thus should not be treated as such. The information provided does not involve any specific investment objectives, financial situation and needs of any specific person who may receive it. Please be aware, that past performance is not a reliable indicator of future performance and/or results. Past Performance or Forward-looking scenarios based upon the reasonable beliefs of the third-party provider are not a guarantee of future performance. Actual results may differ materially from those anticipated in forward-looking or past performance statements. IC Markets makes no representation or warranty and assumes no liability as to the accuracy or completeness of the information provided, nor any loss arising from any investment based on a recommendation, forecast or any information supplied by any third-party.

EURUSD Bulls Reloading — Big Week Ahead? FOMCEURUSD has been riding the uptrend for a while now, but we’ve finally hit a bit of a pause. Recently, the pair posted one of its biggest up-days since 2009 — a huge bullish signal — and momentum carried it even higher! 🔥
Now, price has pulled back slightly from the highs, with last week showing a modest dip as the dollar regained some strength. I do expect we could see a little more pullback in the short term… but overall, my bias remains bullish. I believe the uptrend is still intact, and we could see EURUSD push higher again this week! 📈
What’s your view? Are you buying the dip or expecting a deeper correction?
Drop your thoughts below — and if you found this analysis useful, a boost or follow is always appreciated! 🙌

GOLD - Is this the end of the Bull Run?Gold has once again followed my previous analysis — turning bearish right at key levels! 🚩 After an incredible bull run where price kept making new highs, signs are now pointing to a possible top. We could be entering a short-term bearish phase here, with potential for a deeper correction if momentum builds.
Right now, I’m holding a bearish bias. I’ll be watching for solid sell setups, especially around those well-defined resistance zones. There’s also an unfilled gap below that could attract price action — keep an eye on that level (chart shows the zone clearly 🔎).
I’ll be looking for confirmation through structure breaks and clean retests before entering shorts.
What’s your take — are we seeing a reversal brewing, or is this just a dip before the next leg up? Drop your thoughts below!
If this analysis helps, a boost or follow would mean a lot — and keeps you in the loop for the next moves! 🚀

Natural Gas | Oil | Dollar | Silver | Gold Price ForecastPrice action, multi time frame, trend analysis on
NYMEX:NG1! PEPPERSTONE:NATGAS AMEX:UNG | Oil | Dollar | Silver | Gold Price Forecast

DXY Will Go Up! Buy!
Here is our detailed technical review for DXY.
Time Frame: 5h
Current Trend: Bullish
Sentiment: Oversold (based on 7-period RSI)
Forecast: Bullish
The market is approaching a significant support area 100.036.
The underlined horizontal cluster clearly indicates a highly probable bullish movement with target 100.899 level.
P.S
The term oversold refers to a condition where an asset has traded lower in price and has the potential for a price bounce.
Overbought refers to market scenarios where the instrument is traded considerably higher than its fair value. Overvaluation is caused by market sentiments when there is positive news.
Disclosure: I am part of Trade Nation's Influencer program and receive a monthly fee for using their TradingView charts in my analysis.
Like and subscribe and comment my ideas if you enjoy them!

DXY (US Dollar Index) – Bullish Setup📊 DXY (US Dollar Index) – Bullish Setup from FVG & Trendline Confluence
Price tapped into a well-defined Fair Value Gap (FVG UP) aligning with bullish trendline support. I'm anticipating a small retracement toward the 99.88–99.81 area before continuation upward.
📍 Entry Zone: 99.88 – 99.81 (FVG + Trendline)
🛑 Stop Loss: 99.71
🎯 Target (TP): 100.32
📐 RR: Approx. 1:3
Confluences:
Bullish market structure
FVG filled & respected
Ascending trendline support
Liquidity taken below previous lows
🔔 Watching for bullish reaction after the minor pullback for confirmation.

US INDEX (DXY) TIME TO BUY !!!HELLO TRADERS
As i can see this chart created a harmonic pattren and it crystal clear showing the levels till it hold above our design Stop Loss Trade War Talks and NFP results with slowing down the inflation shows us that $ will recover from this zone if not break SL make a proper research befor taking any trade we appriciate your cooments and support us Stay Tuned for more updates ...

The Bitcoin Illusion: Why $300K or $1M Is a Pipe DreamBitcoin enthusiasts love throwing around wild price predictions—$300K, $1M, even $5M per BTC—as if these numbers are inevitable. But let’s break down the math and expose the delusion behind these claims:
Bitcoin at $300K or $1M? Let’s Do the Math
- $300,000 is a number pulled out of thin air by Michael Saylor and Robert Kiyosaki, either deliberately misleading or financially illiterate. They fail to grasp that this would require a market cap of $6 trillion.
- $1 million, as Cathy Wood foolishly claims, would require Bitcoin’s market cap to exceed $20 trillion—more than the entire GDP of the United States.
- The idea that Bitcoin will magically absorb trillions in global wealth is pure delusion.
Now, let’s put this into perspective:
- Bitcoin reaching $100K was relatively easy because it required a market cap of just $2 trillion—a fraction of global liquidity.
- But pushing Bitcoin to $300K or beyond requires trillions more, which is mathematically impossible without a massive influx of new capital—capital that simply does not exist.
Your $100K to $1M Fantasy—Let’s Run the Numbers
- Some Bitcoin holders believe their sub-$100K investment will make them multimillionaires.
That's a lie and delusional:
- If you bought 100k worth of Bitcoin at 83K per BTC, it would need to hit $830K per coin for you to even reach $1M.
- That’s not financial genius—it’s blind faith in an impossible scenario.
You’re Living in "The Matrix" of Crypto Lies
- You’re not stacking wealth—you’re stacking HOPIUM.
State Adoption Won’t Skyrocket the Price
- Even if six U.S. states were considering Bitcoin treasuries, those purchases would be OTC (over-the-counter)—meaning they wouldn’t significantly impact market price.
- Governments negotiate deals strategically; they don’t flood markets like retail investors hoping for price surges.
The End of Bitcoin’s Accumulation Phase
Bitcoin’s early adopters—the billionaires who pumped it up—have already made their money. The accumulation phase is over.
- To push Bitcoin higher, these whales would need to inject substantial amounts of new capital—but they are overleveraged and drowning in debt.
- Borrowed money must be repaid, and we're already past Bitcoin’s peak mainstream adoption which means there are no new waves of buyers to sustain the illusion.
- Bitcoin is now entering a distribution phase, where early holders cash out, leaving retail investors holding the bag.
The Rise of ETFs and Real Investments
The world is moving on. Investors are waking up to the fact that:
- ETFs offer real projects with actual purpose, unlike Bitcoin.
- ETFs pay dividends, generate revenue, and contribute to real economic growth.
- Newer crypto projects—like Stamps, art collections, gaming tokens, and smart contracts—are gaining traction and pulling capital away from Bitcoin.
Bitcoiners will get left behind, holding worthless, declining bags of old-school crypto, while the future thrives in better technologies.
The Harsh Reality: Bitcoin’s Future Is Bleeding Out
Bitcoin isn’t the future—it’s a fading illusion.
- The crypto cartel thrives on believers, feeding them fantasy while they cash out.
- The idea that Bitcoin will replace fiat, become the global payment rail, and make every holder rich is a marketing illusion designed to keep people holding bags.
- The longer people ignore reality, the harder the crash will be for them.
Many think they’re ahead of the curve, but they’re just loyal believers in an unsustainable illusion. When this unravels, it won’t be Bitcoin’s future collapsing—it will be theirs.

USD/CHF: Bearish ForecastPrice is likely to retrace into the 0.83593 – 0.85750 demand zone or push higher into the FVG (0.8700 – 0.8800) before facing rejection. As long as price holds below these zones, the downtrend should continue, targeting new lows below 0.8100.
Bearish momentum remains intact unless price breaks above the FVG.

NFP Analysis: More Bullish Order Flow?The Dollar has broken structure to the upside and is now pulling back into equilibrium. From this discounted level, I'm looking to capitalise on any valid bullish setups, as break-of-structure moves often lead to continuation towards previous highs.

XAUUSD BuyHello traders!
There’s an ideal buying opportunity on XAUUSD right now. I’ve activated a Buy position to take advantage of this setup.
The TP target is **3262.58** and the SL level is **3242.65**.
Make sure to adjust your lot size and risk according to your trading plan, and enter the trade with discipline.
🔔 I post detailed trade ideas and daily market analysis like this every day on my TradingView profile.
👉 Follow me to get notified and read the full breakdowns.

De-Dollarization Debunked: Why BRICS Can’t Dethrone the USD!The Dollar’s Throne—Shaky or Rock-Solid?
Picture this: a gang of economic rebels—Brazil, Russia, India, China, South Africa, and their new BRICS+ pals—plotting to topple King Dollar from its global throne. The headlines scream “De-Dollarization!” as if the U.S. dollar is about to be dethroned by a shiny new BRICS currency, backed by gold, blockchain, or sheer ambition. Sounds like a blockbuster, right? Except, here’s the twist: the dollar’s throne isn’t just solid—it’s practically welded to the global economy. So, why does the BRICS crew think they can pull off this heist? And why are they doomed to trip over their own ambitions? Buckle up for a 5,000-word joyride through the wild world of global finance, where the dollar reigns supreme, BRICS dreams big, and the numbers tell a story funnier than a sitcom.
Act 1: The Dollar’s Superpower—Why It’s Still King
Let’s start with a jaw-dropping stat: the U.S. dollar accounts for 88% of international transactions through the SWIFT system and 59% of global central bank reserves as of 2024. That’s not just dominance; it’s the financial equivalent of the dollar flexing its biceps while other currencies watch from the sidelines. The euro? A distant second at 20% of reserves. China’s yuan? A measly 2.3%. The dollar’s grip is so tight, it’s practically giving the global economy a bear hug.
Why does the dollar rule? It’s not just because Uncle Sam prints greenbacks like they’re going out of style (though the U.S. debt is a whopping $34 trillion in 2025). The dollar’s superpower lies in trust, liquidity, and infrastructure. The U.S. has deep, liquid financial markets, a stable (ish) legal system, and no capital controls—things no BRICS nation can match. Want to trade oil? Dollars. Settle a cross-border deal? Dollars. Hide your cash from your dictator boss? You guessed it—dollars. The greenback is the world’s financial comfort food, and everyone’s got a craving.
But here’s where it gets juicy: BRICS thinks they can crash this party. At the 2024 Kazan Summit, Russia’s Vladimir Putin called the dollar a “weapon,” while China’s Xi Jinping pushed for a BRICS “Unit” currency. Sounds spicy, but let’s unpack why this plan is less Ocean’s Eleven and more Three Stooges.
Act 2: BRICS’ Big Dream—And Bigger Problems
The BRICS Fantasy: A Currency to Rule Them All
BRICS (Brazil, Russia, India, China, South Africa, plus newbies like Iran, Saudi Arabia, and the UAE) wants to ditch the dollar for a new currency or a basket of their own—maybe even a gold-backed “Unit.” The pitch? Reduce reliance on the dollar, dodge U.S. sanctions, and flex their collective muscle (they represent 28% of global GDP and 44% of crude oil production). In 2023, one-fifth of oil trades sidestepped the dollar, a shift driven by Russia and China settling in rubles and yuan. That’s a bold move, right?
Except, here’s the punchline: creating a BRICS currency is like herding cats while riding a unicycle and juggling flaming torches. Let’s break down why their dream is a logistical nightmare.
Problem #1: No Trust, No Party
BRICS nations don’t exactly exchange friendship bracelets. India and China? They’ve got border disputes so tense, their soldiers once threw rocks at each other. Russia and China might cozy up to dodge sanctions, but Brazil and India aren’t thrilled about Beijing calling the shots. A common currency needs trust—think the eurozone, where Germany and France (mostly) play nice. BRICS? It’s more like a reality show where everyone’s secretly voting each other off the island.
X posts sum it up: “BRICS replacing the dollar? Mutual distrust and weak legal systems will kill any shared currency initiative.” Without trust, no one’s pooling their reserves or agreeing on who controls the money printer.
Problem #2: The Yuan’s Not Ready for Prime Time
China’s yuan is the closest BRICS has to a dollar rival, but it’s got stage fright. Only 7% of foreign exchange trading involves the yuan, and China’s capital controls keep it on a tight leash. Want to invest your yuan globally? Good luck—Beijing’s not keen on letting cash flow freely. Morgan Stanley’s strategists put it bluntly: “China would need to relax control of its currency and open the capital account. That’s not happening soon.”
Plus, China’s economy isn’t exactly inspiring confidence. Consumer demand is sagging, and the property crisis is dragging on like a bad soap opera. The yuan’s share in global payments via SWIFT is up to 6.4% in 2024, but that’s still pocket change compared to the dollar’s dominance.
Problem #3: Oil’s Not Enough
BRICS+ produces 44% of global crude oil, so why not price it in their currencies? Saudi Arabia’s riyal is pegged to the dollar, and even their flirtation with yuan-based oil deals hasn’t gone far. Why? Oil is only 15% of global trade, and the dollar’s used for everything else—tech, cars, coffee, you name it. Even if BRICS prices oil in rubles or rupees, the rest of the world’s still paying for iPhones in dollars.
And here’s a kicker: at the 2024 BRICS Summit, Russia advised attendees to bring dollars and euros because local banks preferred them over rubles. Talk about an own goal
Act 3: The Dollar’s Kryptonite—Does It Exist?
Let’s play devil’s advocate. Could BRICS pull off a miracle? They’ve got some tricks up their sleeves: blockchain-based payment systems like BRICS Bridge, gold-backed reserves (BRICS+ holds 42% of global FX reserves), and a push for local currency trade. Russia and China already settle 95% of their trade in rubles and yuan. That’s not nothing.
But here’s the reality check: these moves are like bringing a water gun to a tank fight. The dollar’s dominance isn’t just about transactions; it’s about network effects. The greenback’s infrastructure—SWIFT, Wall Street, Treasury bonds—is a fortress. BRICS’ alternative, like the mBridge CBDC platform, is promising but embryonic. It connects China, Hong Kong, Thailand, the UAE, and Saudi Arabia, but it’s nowhere near replacing SWIFT’s global reach.
And gold? BRICS loves it—gold’s 10% of their reserves, half the global average—but it’s not a currency. You can’t pay for Netflix with gold bars, and central banks aren’t keen on lugging bullion around. The Atlantic Council’s 2024 “Dollar Dominance Monitor” says it best: “The dollar’s role as the primary global reserve currency is secure in the near and medium term.”
Act 4: Trump’s Tariffs and the De-Dollarization Drama
Enter Donald Trump, stage right, with a megaphone and a tariff hammer. In 2025, he’s threatening 100% tariffs on BRICS nations if they push de-dollarization. “Any BRICS state that mentions the destruction of the dollar will lose access to America’s markets,” he thundered. Sounds like a plan to keep the dollar king, right?
Wrong. Here’s the irony: Trump’s aggressive tactics might accelerate de-dollarization. Sanctions and tariffs make BRICS nations double down on alternatives. China’s been diversifying reserves and pushing yuan trade for years, partly because of U.S. pressure. As one analyst put it, “Trump’s threats are a rallying cry for BRICS to act.”
But don’t hold your breath. Tariffs hurt BRICS economies (China’s exports to the U.S. are 15% of its total), but they don’t solve BRICS’ internal chaos. India’s External Affairs Minister S. Jaishankar said it plainly: “India has never been for de-dollarization.” Brazil’s also lukewarm, fearing a China-dominated BRICS. Without unity, their currency dreams are just hot air.
Act 5: The Numbers Don’t Lie—Dollar’s Here to Stay
Let’s crunch some numbers to seal the deal:
SWIFT Transactions: Dollar: 88%. Euro: 20%. Yuan: 7%.
Global Reserves: Dollar: 59%. Euro: 20%. Yuan: 2.3%.
Oil Trade: 80% in dollars in 2023, down from 100%.
Global Trade: 50% dollar-denominated.
BRICS GDP: $28.5 trillion (28% of global). U.S.: $25.5 trillion (24%).
The dollar’s share is slipping—reserves dropped from 72% post-WWII to 59%—but it’s still laps ahead. BRICS’ push for local currencies is gaining traction (Russia-China trade is 80% non-dollar), but scaling that globally is a pipe dream. The euro flopped as a dollar rival; the yuan’s too controlled; and a BRICS “Unit”? It’s a concept, not a currency.
Act 6: Thought-Provoking Twist—What If BRICS Succeeds?
Let’s indulge in a wild “what if.” Imagine BRICS pulls it off: a gold-backed Unit currency, blockchain payments, and oil priced in yuan. The dollar crashes, inflation spikes, and Americans pay $10 for a coffee. Scary, right? Former White House economist Joe Sullivan warned BRICS could swing an “economic wrecking ball” at the dollar.
But here’s the catch: a BRICS win hurts BRICS too. Their economies rely on dollar-based trade—China holds $3 trillion in U.S. Treasury bonds. A dollar collapse tanks their assets. Plus, who trusts a BRICS currency when China’s calling the shots? As Ray Dalio noted, de-dollarization is “financial risk management,” not a revolution. BRICS wants options, not chaos.
Act 7: The Funny Finale—BRICS’ Comedy of Errors
Picture BRICS at a poker table, bluffing with a bad hand. Russia’s got rubles nobody wants. China’s yuan is chained to Beijing’s whims. India’s like, “I’m just here for the snacks.” Brazil’s dreaming of free trade, and South Africa’s wondering why they RSVP’d. Meanwhile, the dollar’s dealing cards, smirking, “You sure you wanna bet against me?”
The de-dollarization saga is a comedy of errors—big talk, small results. BRICS’ heart is in it, but their heads are in the clouds. The dollar’s not perfect (hello, $34 trillion debt), but it’s the only game in town. As Morgan Stanley’s James Lord said, “When global markets fall, you want dollars.”
Epilogue: Keep Your Eyes on the Dollar
So, what’s the takeaway? De-dollarization is a catchy buzzword, but BRICS can’t dethrone the dollar anytime soon. The greenback’s too entrenched, BRICS too divided, and the world too hooked on dollar-based trade. Will BRICS chip away at the edges? Sure—expect more yuan trades and blockchain experiments. But a dollar-free world? That’s science fiction, not finance.
For traders, here’s a tip: watch DXY’s inverted head-and-shoulders pattern. A breakout above 100 could signal another dollar rally. For everyone else, laugh at the BRICS hype, stash some dollars under your mattress, and enjoy the show. The dollar’s throne isn’t going anywhere—yet.

EUR/USD - Channel Breakout (02.05.2025) FX:EURUSD The EUR/USD pair on the M30 timeframe presents a Potential Buying Opportunity due to a recent Formation of a Breakout Pattern. This suggests a shift in momentum towards the upside and a higher likelihood of further advances in the coming hours.
Possible Long Trade:
Entry: Consider Entering A Long Position around Trendline Of The Pattern.
Target Levels:
1st Resistance – 1.1387
2nd Resistance – 1.1430
🎁 Please hit the like button and
🎁 Leave a comment to support for My Post !
Your likes and comments are incredibly motivating and will encourage me to share more analysis with you.
TVC:DXY
Best Regards, KABHI_TA_TRADING
Thank you.
