EURUSD m15 SellThere’s another Sell opportunity on EURUSD.
I've set the RRR to 1:1.50, with a TP level at 1.13694.
I opened three short positions at: 1.13795 / 1.13802 / 1.13834.
EURUSD is one of the four pairs I trade the most and trust the most.
🔔 If you want to catch setups like this daily, make sure to follow me.Hello everyone. There's a
🔔 I post detailed trade ideas and daily market analysis like this every day on my TradingView profile.
J-DXY

NZDCHF m15 BuyHello everyone.
There's a perfect buy opportunity on NZDCHF right now.
You can even set your RRR to 1:4, but those who prefer a shorter target can close at RRR 1:2.
I expect the pair to reach the 0.49225 level during the day.
Wishing everyone profitable trades!
🔔 I post detailed trade ideas and daily market analysis like this every day on my TradingView profile.
👉 Follow me to get notified and read the full breakdowns.

30.04.25 Morning ForecastPairs on Watch -
GBP / AUD
AUD / JPY
GBP / JPY
EUR / USD
A short overview of the instruments I am looking at for today, multi-timeframe analysis down to what I will be looking at for an entry. Enjoy!

DXY Technical Analysis – Bearish BiasDXY Technical Analysis – Bearish Bias
Market Structure: The price attempted a recovery but failed to break above a strong supply/resistance zone around 99.30–99.40.
Price Action: A rounded bottom (U-shape) move formed, but instead of continuation, the price rejected the resistance and started to fall.

SHORT ON GBP/USDGBP/USD Has bearish divergence on the 4hr timeframe.
This is a bearish reversal indication. Price is also over brought on GU.
The Dollar (dxy) Looks like it will start to rise from its demand area.
I will be selling GU looking to catch over 300-400 pips to the previous swing low /demand zone.

DXY: Will Go Up! Long!
My dear friends,
Today we will analyse DXY together☺️
The market is at an inflection zone and price has now reached an area around 98.933 where previous reversals or breakouts have occurred.And a price reaction that we are seeing on multiple timeframes here could signal the next move up so we can enter on confirmation, and target the next key level of 99.097.Stop-loss is recommended beyond the inflection zone.
❤️Sending you lots of Love and Hugs❤️

DXY Will Go Higher! Buy!
Please, check our technical outlook for DXY.
Time Frame: 9h
Current Trend: Bullish
Sentiment: Oversold (based on 7-period RSI)
Forecast: Bullish
The market is approaching a key horizontal level 99.288.
Considering the today's price action, probabilities will be high to see a movement to 100.788.
P.S
We determine oversold/overbought condition with RSI indicator.
When it drops below 30 - the market is considered to be oversold.
When it bounces above 70 - the market is considered to be overbought.
Disclosure: I am part of Trade Nation's Influencer program and receive a monthly fee for using their TradingView charts in my analysis.
Like and subscribe and comment my ideas if you enjoy them!

Gold (XAUUSD) Take Profit📉 Gold (XAUUSD) Trade Update
A few hours ago, I shared a short setup on gold — it has successfully hit the target and closed with a solid profit.
Looking ahead, there's still room for further downside. In the medium term, gold could decline towards the $3020 level.
🔔 I post detailed trade ideas and daily market analysis like this every day on my TradingView profile.
👉 Follow me to get notified and read the full breakdowns.

Is EURUSD getting ready for another 600 pips bull run?🏆 EURUSD Market Update
📊 Technical Outlook
🔸Short-term: mixed/range
🔸Mid-term: BULLS 2000
🔸Status: accumulation in range
🔸previously x2 waves +600 pips
🔸clearly strong uptrend in progress
🔸Price Target Bears: range
🔸Price Target BULLS: 2000
🔸strategy: accumulate in range
🔸TP1 +200 TP2 +400 pips
🔸SL 60 pips / below accum range
📈 EUR/USD Bullish Drivers
🏦 ECB staying cautious on rate cuts while Fed signals easing
📉 Weak U.S. job and manufacturing data pressuring the dollar
🌍 U.S. trade policy uncertainty pushing investors toward euro
📊 Technicals show strong support, RSI confirms bullish momentum
🔮 Outlook
⏳ Short-term: Targeting 1.1500 if U.S. data stays soft
📆 Medium-term: 1.20 possible on policy divergence and EU fiscal boost

The Monthly Transition for GoldLooking for price to retrace and take out lows before it proceeds to be bullish. Waiting for Killzones.

USD/JPY 1H Chart AnalysisStructure: Bullish, with higher highs (H1) and higher lows consistently forming.
Key Zone: A demand zone around 143.00 – 143.20. Price could pull back here for liquidity before continuing higher.
Current Price: Consolidating near 143.70 after a strong impulse.
Bias: Bullish, as long as price holds above 143.00. Watching for a possible dip into demand before resuming the uptrend toward 144.20 highs.

USDCHF | 15M | Needs to break for uptrendHey there my friend;
I’ve prepared my analysis of USD/CHF for you. For USD/CHF to move into an upward trend, it needs to break out of the parallel channel. Once it breaks out of the parallel channel, I’ll share the target levels with you.
Dear friends, your likes are always my biggest source of motivation for me to share analysis. For this reason, I would like to ask each and every one of my followers; please do not miss your likes.
I sincerely thank everyone who supports me with their likes.

GBPNZD | 4H | SWING TRADEHey there my dear friends;
SIGNAL ALERT
BUY GBPNZD / 2,23220
🟢TP1: 2,23952
🟢TP2: 2,24909
🟢TP3: 2,27946
🔴SL: 2,20905
Enter low lot because it is high risk 🔽
RR / 2,00
Dear friends, your likes are always my biggest source of motivation for me to share analysis. For this reason, I would like to ask each and every one of my followers; please do not miss your likes.
I sincerely thank everyone who supports me with their likes.

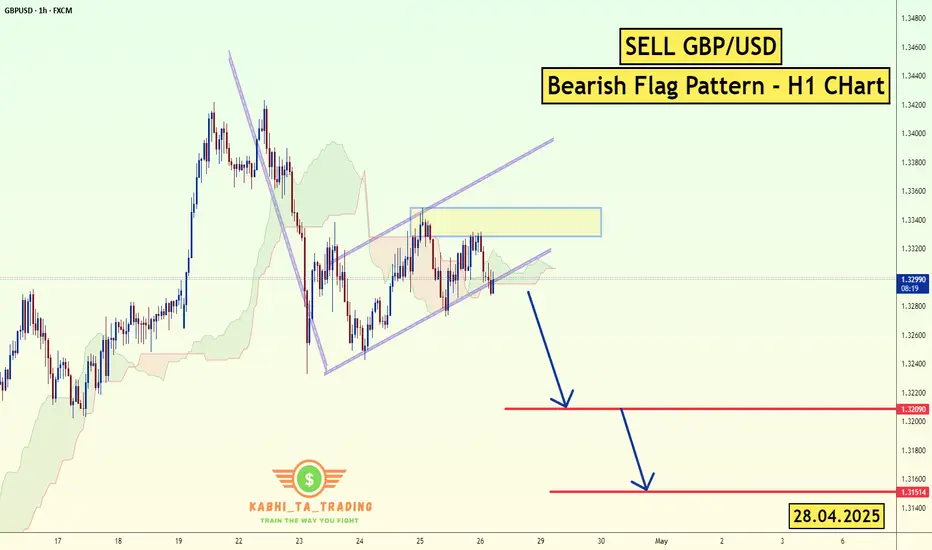
GBP/USD - H1 - Bearish Flag (28.04.2025)FX:GBPUSD The GBP/USD Pair on the H1 timeframe presents a Potential Selling Opportunity due to a recent Formation of a Bearish Flag Pattern. This suggests a shift in momentum towards the downside in the coming hours.
Possible Short Trade:
Entry: Consider Entering A Short Position around Trendline Of The Pattern.
Target Levels:
1st Support – 1.3209
2nd Support – 1.3151
🎁 Please hit the like button and
🎁 Leave a comment to support for My Post !
Your likes and comments are incredibly motivating and will encourage me to share more analysis with you.
Best Regards, KABHI_TA_TRADING
Thank you.
Fundamental Update :
on Monday as the trade tensions between the U.S. and China provided some relief to investors, while a stronger dollar further weighed on prices.
The U.S. dollar TVC:DXY rose 0.2% against a basket of currencies, making bullion more expensive for overseas buyers. TVC:DJI SP:SPX NASDAQ:IXIC also rising .
Is the US Dollar Preparing for a Bullish Comeback?The DXY is currently maintaining a bullish setup amid trade negotiations, election developments, and anticipation of key leading U.S. economic indicators this week.
An inverted head-and-shoulders formation is visible on the 4-hour time frame. A decisive catalyst and a breakout above the 100.00 and 100.30 levels are needed to confirm a more sustained bullish bounce from multi-year lows, with targets at 102.00, 103.30, and 104.70 — reversing recent strength in major global currencies.
On the downside, a breach of the 97.00 level could trigger a decline toward the lower boundary of the long-term uptrend channel established since 2008, aligning with the 92.00 zone, and potentially lifting gold and major currencies globally.
Several key events this week could challenge or reinforce the current bullish setup amid ongoing Trump–China trade negotiations:
U.S. Advance GDP & Core PCE — Wednesday
BOJ Rate Decision & U.S. ISM PMI — Thursday
U.S. Non-Farm Payrolls — Friday
Mega Cap Earnings — Wednesday/Thursday
While long-term signals remain bearish, short-term charts suggest a potential bullish recovery, with trade negotiations likely to tip the balance.
Written by Razan Hilal, CMT

GBPUSD SELL NOW BUY LATER!Our previous idea played out perfectly once again! Currently, GBPUSD is showing signs of a pullback within a mini bearish trend. However, I still believe the overall structure remains bullish. I'll be watching for buying opportunities once this pullback completes. Stay patient and wait for confirmation!

XAUUSD - Gold trend reversed?!Gold is trading below the EMA200 and EMA50 on the hourly timeframe and is in the specified pattern. The continuation of gold's movement depends on the breakdown of one of the two established trend lines, and after a valid breakdown, we expect to reach the established targets.
In recent weeks, gold prices have experienced significant volatility. This precious metal, long regarded as a safe-haven asset during periods of economic uncertainty, faced a decline in Monday’s trading session. The primary reason behind this drop was signs of easing trade tensions between the United States and China, leading to decreased demand for safe assets. This decline occurred while investors awaited clarity regarding ongoing trade negotiations between the two countries.
Last week, media reports indicated that China exempted some American imports from 125% tariffs, signaling a reduction in bilateral tensions. In response, Donald Trump stated that trade talks were underway; however, this claim was rejected by China. Additionally, the U.S. Treasury Secretary announced that he was unaware of any active negotiations, further fueling market doubts.
According to a recent Federal Reserve survey, participants cited the outflow of foreign capital from U.S. assets and a decline in the dollar’s value as potential new economic shocks. Some respondents believed that increased tariffs might only cause limited market disruptions. The survey indicated that despite market turmoil in April, prices remained elevated relative to fundamental indicators.
Meanwhile, investors were closely awaiting key U.S. economic data set to be released over the coming week. While the previous week was relatively quiet in terms of economic indicators, market focus has shifted toward a series of critical U.S. employment reports. These include the Job Openings and Labor Turnover Survey (JOLTS) on Tuesday, the ADP private-sector employment report on Wednesday, and weekly jobless claims on Thursday—all paving the way for the most crucial event of the week: the April Non-Farm Payrolls (NFP) report, to be released Friday morning.
Beyond these reports, several major events are scheduled in the economic calendar: Canada’s federal election on Monday, the U.S. Consumer Confidence Index on Tuesday, preliminary first-quarter GDP data, pending home sales figures, and the Bank of Japan’s monetary policy decision on Wednesday, followed by the U.S. ISM Manufacturing PMI on Thursday—all of which could impact market sentiment.
On another front, the China Gold Association reported that gold consumption fell by 5.96% in the first quarter of 2025, reaching 290,492 tons. Although gold jewelry demand declined by 26.85%, investment-related gold demand surged by 29.81%, reflecting investors’ pursuit of safe assets amid economic and geopolitical uncertainty.
Domestic gold production in China increased by 1.49%, and assets held in gold ETFs rose sharply by 327.73%, indicating heightened financial caution among Chinese consumers in 2025.
A recent report from Goldman Sachs suggests that the downward trend of the U.S. dollar is far from over and that the currency remains significantly overvalued. Jan Hatzius, the bank’s chief economist, stated that despite the dollar’s recent 5% drop, it still stands roughly two standard deviations above its long-term real average since 1973. Historically, such levels have marked the beginning of multi-year correction cycles for the dollar.
Similar patterns occurred during the mid-1980s and early 2000s when the U.S. dollar experienced declines of around 25% to 30% following such valuations. Based on this, Goldman Sachs expects a similar scenario to unfold in the coming years.
One of the key structural factors fueling this anticipated correction is the portfolio composition of global investors. Specifically, non-U.S. investors hold about $22 trillion worth of assets in the United States, roughly one-third of their total portfolios.Half of these investments are unhedged against currency risk, which could lead to sharp fluctuations in the currency markets if investor sentiment shifts.
Goldman Sachs analysts believe that even a modest reallocation of global capital away from U.S. assets could significantly lower the dollar’s value. Therefore, they view the dollar’s gradual yet sustained decline not as a temporary fluctuation, but as a long-term structural trend.

Skeptic | EUR/USD 4H Range Breakout: Key Long & Short TriggersEUR/USD on the 4-hour timeframe is currently trapped in a consolidation box, where a breakout above the ceiling or below the floor could provide excellent trading opportunities. I’m Skeptic , and in this analysis, we’ll dive into EUR/USD across multiple timeframes to identify key long and short triggers. Stick with me until the end for a complete breakdown! 🚀
Daily Timeframe: Uptrend Context 🟢
On the daily chart, EUR/USD remains within an uptrend channel , maintaining a bullish major trend. Recently, after hitting the channel’s upper resistance, the pair corrected toward the midline, a critical support zone within the channel. However, the reaction at the midline lacked strong bullish momentum, leading to a 4-hour range consolidation . This could signal the end of the correction, potentially setting the stage for a continuation of the downmove toward the lower channel boundary.
4-Hour Timeframe: Range Dynamics 🔍
On the 4H chart, EUR/USD is oscillating between 1.13904 (resistance) and 1.13153 (support) . A key observation: after the initial bounce from the 1.13153 support to 1.13904, subsequent tests of this support failed to push back to 1.13904. This indicates waning buyer strength at the 1.13153 support, increasing the likelihood of a breakout below. Additionally, while bullish candles in this range are larger, we’re seeing smaller, frequent green candles, suggesting buyer exhaustion within the box.
For traders eyeing a short setup , this weakening support at 1.13153 offers a compelling opportunity. You can take on slightly higher risk by placing a sell-stop order below 1.13153 instead of waiting for a confirmed breakout candle (this is my personal approach). A short trigger would be validated by a break below 1.13153, with RSI entering oversold as a strong confirmation. Short targets: 1.12692, with a potential extension to 1.12006.
For a long setup , a breakout above 1.13904 could signal a resumption of bullish momentum, targeting the upper channel boundary on the daily chart. Wait for a confirmed breakout before entering long to avoid false signals.
DXY Correlation: Additional Confirmation 📈
Let’s also consider the US Dollar Index (DXY). After a recent rally, DXY has entered a time-based correction, visible as a pullback to a descending yellow trendline. A break below DXY’s support at 99.195 would reinforce our EUR/USD long setup, while a breakout above the trendline and 99.876 would strengthen our EUR/USD short setup. Both scenarios offer sharp price movements with attractive risk-to-reward (R/R) ratios, making these triggers highly actionable.
Final Thoughts 🙌
Thanks for joining me in this detailed EUR/USD analysis! I’m Skeptic, and I share daily forex and crypto insights. If you found this useful, please follow for more content! 🔥

NAS100 - Stock Market Waiting for a New Stimulus?!The index is trading above the EMA200 and EMA50 on the four-hour timeframe and is trading in its ascending channel. If the index continues to move upwards towards the specified supply zone, one can look for further Nasdaq short positions with a risk-reward ratio.
Last week, financial markets experienced a brief sigh of relief as U.S. President Donald Trump appeared to ease tensions by signaling a limited retreat in the tariff war with China, sparking hopes for reduced friction. However, this optimism quickly faded once it became clear that Trump’s retreat was neither substantial nor impactful.
From Beijing’s perspective, the trade war has transcended economic concerns, becoming an issue of national pride and sovereignty. As a result, China, the world’s second-largest economy, is not retreating as easily as Trump anticipated. This stance has evolved into a significant challenge for the White House. U.S. officials indicated that tariffs of 145% could be reduced within two to three weeks if an agreement is reached.
Nonetheless, according to Chinese authorities, negotiations have yet to even begin, raising doubts about Trump’s negotiation tactics. Additionally, other concessions, such as reducing tariffs on American automakers, remain uncertain, and Trump has even threatened to raise tariffs on Canadian car imports.
This environment not only fails to clarify U.S. trade policy but also deepens uncertainty for domestic businesses. Although the White House claims it is monitoring markets closely and Trump is eager to strike deals with key partners, these assurances have not alleviated concerns about the future of the U.S. economy.
In the upcoming week, critical economic data could either intensify or ease current worries. On Tuesday, the Consumer Confidence Index for April and the JOLTS job openings data for March will be released. The highlight, however, will be the preliminary estimate of GDP growth, scheduled for Wednesday.
The Atlanta Fed’s GDPNow model forecasts a 2.2% annualized contraction in the U.S. economy for Q1 2025. Meanwhile, a Reuters survey of economists projects a modest 0.4% growth rate, a significant slowdown from Q4’s 2.4% growth.
Accompanying these reports, the ADP private-sector employment data and the Personal Consumption Expenditures (PCE) index will be published. The core PCE for March is expected to show a monthly increase of 0.1% and an annual rise of 2.5%, down from 2.8% previously. Personal spending is anticipated to maintain its 0.4% monthly growth, reflecting resilient household expenditures.
Additionally, on Wednesday, the Chicago PMI and pending home sales figures will be released. Thursday will bring the Challenger layoffs data for April, but market focus will be on the ISM manufacturing PMI, expected to drop from 49 to 47.9.
The week’s main event will be Friday’s release of the Nonfarm Payrolls (NFP) report. Forecasts suggest job growth will slow from 228,000 in March to 130,000 in April, while the unemployment rate is expected to remain at 4.2%. Wages are projected to rise by 0.3%.If NFP and PCE data come in weaker than expected, market expectations for a 25-basis-point rate cut by the Fed in June could intensify, although the likelihood of a cut in May will remain low. Such data would likely be bearish for the U.S. dollar but could support equity markets if recession fears do not dominate sentiment.
Some Federal Reserve officials have suggested that if economic conditions deteriorate significantly, rate cuts could start as early as June. Currently, the Fed has maintained high rates to combat inflation but may lower them to support growth and prevent a sharp rise in unemployment if necessary.
Trump’s trade wars pose a dual risk of increasing inflation while hurting employment, complicating the Fed’s monetary policy strategy. Presently, the Fed is in a “wait-and-see” mode, but several officials indicated last week that cuts could begin if economic data worsens.
Beth Hammack, President of the Cleveland Federal Reserve Bank, told CNBC on Thursday that the Fed might lower rates starting in June if signs of economic weakening due to Trump’s sporadic tariffs appear.
Christopher Waller, a Fed Board member, stated on Bloomberg TV that he could foresee rate cuts if the labor market collapses but does not expect such a scenario before July.
On Thursday, Waller remarked, “It would not be surprising to see an increase in layoffs and a higher unemployment rate, especially if major tariffs return. I would expect faster rate cuts once signs of severe labor market deterioration emerge.”
These comments highlight the Fed’s current dilemma as it awaits clearer evidence of significant economic fallout from Trump’s trade wars.
The Federal Reserve’s mandate is to maintain low inflation and unemployment levels. Its primary tool, the federal funds rate, influences borrowing costs across the economy. The Fed can stimulate growth by lowering rates or curb inflation by raising them.
Economists warn that Trump’s tariffs present the risk of simultaneously driving up inflation while damaging employment, forcing the Fed to prioritize which challenge to address first.

Bitcoin: Will Bitcoin reach $100,000?!Bitcoin is above the EMA50 and EMA200 on the four-hour timeframe and is in its ascending channel. The continuation of Bitcoin's upward movement towards the supply zone will provide us with its next selling position with an appropriate reward to risk. In case of Bitcoin's downward movement towards the specified demand zone, we can look for its next buying positions.
It should be noted that there is a possibility of heavy fluctuations and shadows due to the movement of whales in the market and compliance with capital management in the cryptocurrency market will be more important. If the downward trend continues, we can buy in the demand range.
During the recent trading week, from April 21 to April 25, U.S. spot Bitcoin ETFs recorded over $3 billion in capital inflows. This figure marks the second-largest weekly inflow in the history of these ETFs, following the $3.4 billion inflow recorded in November 2024.
Thanks to this momentum, Bitcoin managed to climb above the $95,000 mark for the first time since February. Data reveals a notable increase in market participants’ optimism, with bullish posts on social media reaching their highest level since the night of Trump’s election victory on November 5, 2024.
More than 7,000 Bitcoins, worth over $500 million, were withdrawn from the Coinbase exchange. This trend could signal institutional accumulation and reflect a strongly bullish sentiment in the market.
During the 2018 trade tariff war, Bitcoin experienced a sharp 84.5% collapse, plunging from around $19,400 in December 2017 to approximately $3,000 by December 2018. This price decline coincided with intensifying global trade tensions.
However, Bitcoin’s price later rebounded following the Federal Reserve’s interest rate cuts and an improvement in liquidity conditions. The attached price chart clearly illustrates Bitcoin’s steep decline between December 2017 and December 2018.
According to data released in March 2025, major global corporations have significantly strengthened their presence in the digital asset market. At the top of the list stands MicroStrategy, holding over 500,000 BTC — far surpassing other companies.
Following MicroStrategy, companies such as Marathon, Galaxy Digital, Tesla, Coinbase Global, Hut 8 Mining, Riot Platforms, Block, CleanSpark, and Metaplanet respectively hold the largest Bitcoin reserves. This group of key players from technology, mining, and financial services sectors view Bitcoin as a critical part of their long-term strategies.Moreover, between April 7 and April 13, MicroStrategy purchased 3,459 Bitcoins at an average price of $82,618 per coin, totaling $285.8 million.

Heading into pullback resistance?US Dollar Index (DXY) is rising towards the pivot which is a pullback resistance and could reverse to the 1st support which acts as a pullback support.
Pivot: 100.27
1st Support: 98.32
1st Resistance: 101.77
Risk Warning:
Trading Forex and CFDs carries a high level of risk to your capital and you should only trade with money you can afford to lose. Trading Forex and CFDs may not be suitable for all investors, so please ensure that you fully understand the risks involved and seek independent advice if necessary.
Disclaimer:
The above opinions given constitute general market commentary, and do not constitute the opinion or advice of IC Markets or any form of personal or investment advice.
Any opinions, news, research, analyses, prices, other information, or links to third-party sites contained on this website are provided on an "as-is" basis, are intended only to be informative, is not an advice nor a recommendation, nor research, or a record of our trading prices, or an offer of, or solicitation for a transaction in any financial instrument and thus should not be treated as such. The information provided does not involve any specific investment objectives, financial situation and needs of any specific person who may receive it. Please be aware, that past performance is not a reliable indicator of future performance and/or results. Past Performance or Forward-looking scenarios based upon the reasonable beliefs of the third-party provider are not a guarantee of future performance. Actual results may differ materially from those anticipated in forward-looking or past performance statements. IC Markets makes no representation or warranty and assumes no liability as to the accuracy or completeness of the information provided, nor any loss arising from any investment based on a recommendation, forecast or any information supplied by any third-party.

GOLD / XAUUSD | 15M | PENDING SELL ORDERHey there my dear friends;
SIGNAL ALERT
PENDING SELL ORDER - GOLD / XAUUSD > 3334,0
🟢TP1: 3328,0
🟢TP2: 3314,0
🟢TP3: 3296,0
🔴SL:3358,0
RR / 1,70
Dear friends, your likes are always my biggest source of motivation for me to share analysis. For this reason, I would like to ask each and every one of my followers; please do not miss your likes.
I sincerely thank everyone who supports me with their likes.

Price Action + Fundamentals Point to Dollar StrengthThe current market environment presents compelling evidence for a bullish move in the US Dollar Index (DXY). While some patience is required, the setup is increasingly favorable for the dollar to appreciate in the coming weeks and months.
Key Factors Supporting a Bullish Move:
Monthly Close Above 100.160:
A critical technical level to monitor is the monthly close above 100.160. If achieved, it would signal a strong bullish breakout, setting the stage for a continuation higher. Given current price action and market dynamics, this scenario looks highly probable. However, if the price fails to close above 100.160 and instead breaks below it, we could potentially start looking for short opportunities.
Bond Market Strength (30Y, 10Y, 5Y):
This past week, we witnessed notable strength across the US bond market. Yields declined as prices rose, typically a positive signal for the dollar as it reflects capital inflows into US assets.
COT Report Insights:
The Commitment of Traders (COT) report reveals a critical shift: commercial traders, often considered the "smart money," are beginning to accumulate long positions in the dollar. This change in positioning historically precedes significant bullish moves.
Seasonal Patterns:
Seasonality also favors the dollar during this period. Historically, the dollar tends to strengthen in the mid-year months, aligning perfectly with the current technical and fundamental landscape.
Targets:
Initial Target: 106.120
Given the accumulation signs and supportive macro backdrop, a move towards 106.120 seems very realistic.
