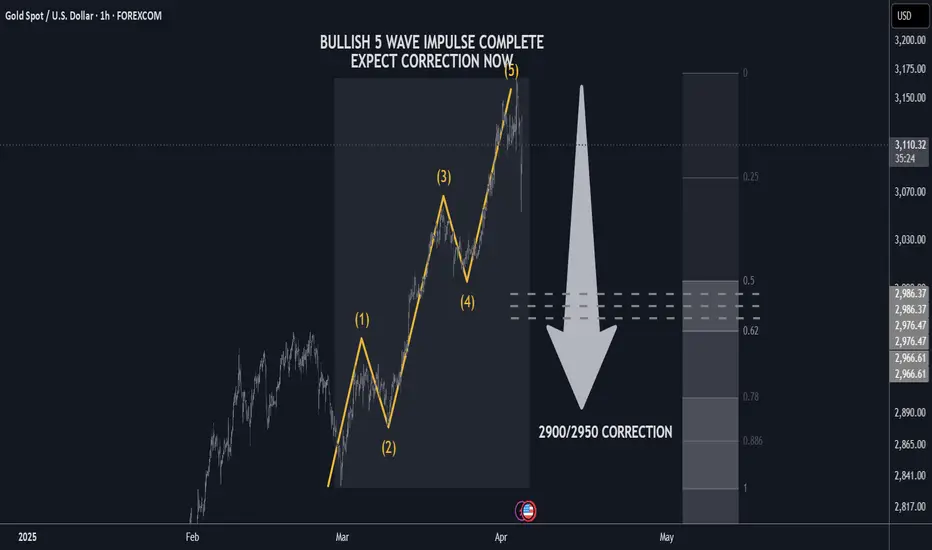
GOLD H1 Update: Expect correction 2900/2950 USD🏆 Gold Market Update (April 3rd, 2025)
📊 Technical Outlook Update
▪️5 wave impulse completed
▪️Expect correction now
▪️Tariffs already priced in
▪️Profit taking in progress now
▪️Price Target BEARS 2900/2950 USD
▪️Strategy: SHORT SELL rips/rallied
▪️target is 2900/2950 USD
📢 Gold Market Update – April 2025
📈 Gold Hits All-Time High!
🚀 Price spiked to $3,167.84/oz after Trump announced sweeping tariffs (10–34%) on global imports.
🌎 Investors rushed to safe-haven assets amid rising trade war fears.
📉 Volatility Followed
💸 Sharp pullback after the surge as markets reacted to global uncertainty.
🔁 Analysts expect more swings as tensions evolve.
🏦 Central Banks Buying More Gold
🛡️ A move to protect against currency risks & inflation fears.
J-DXY
4.8 Gold Bollinger Bands bearish signal appearsRecently, the spot gold price once fell below the psychological barrier of $3,000, triggering technical concerns in the market about whether the gold bull market has reached its peak. On Monday (April 7) in the North American session, spot gold is currently trying to recover to around $3,030, but the technical indicators have shown obvious divergence.
Fundamental analysis
The market's concerns about US inflation continue to ferment, and the intensification of global trade frictions is driving the market's concerns about economic stagflation. The Fed's policy stance has also undergone subtle changes. The market has begun to price in five possible interest rate cuts this year. The CME FedWatch tool shows that the probability of the Fed's interest rate cut in May has soared from 33.3% last Friday to 49.3%.
At present, traders are turning their attention to the US inflation data to be released this week, which will provide important clues for assessing the US economic situation.
Technical analysts' interpretation:
Bollinger band breakthrough signal indicates a short-term correction
On the daily chart, gold prices have formed a clear upward channel since mid-March, but recently touched the upper track of the Bollinger band and began to fall. It is worth noting that the middle track of the Bollinger Band 3006.13 has become a key support level. After breaking through the historical high of 3167.60, the price has shown a typical upward exhaustion pattern. The MACD indicator shows DIFF: 43.46, DEA: 48.65, MACD: -10.39, and the green kinetic energy column has begun to expand, indicating that the short-term downward momentum is accumulating.
RSI indicator shows overbought correction
The 120-minute chart shows that the RSI indicator has fallen from the overbought area to a neutral level of 40.37. At the same time, the CCI indicator has dropped to -45.05, further confirming the trend of short-term overbought correction.
Key support and resistance level analysis
The current gold price faces multiple technical resistances, among which 3055.00 and 3085.00 constitute the main resistance range for short-term rebound. The lower support levels are mainly concentrated at $3005.00 and $2971.31, and these two levels will determine whether the gold price can remain above the psychological level of $3,000. In particular, the $2971.31 level, as a recent low, may trigger a deeper adjustment if it is lost.
From the long-term daily chart, gold prices formed an accelerated upward channel after breaking through $2950.00. The recent high of $3167.60 is just at the upper track of the channel. This trend of peaking and falling is in line with the classic channel trading theory.
Outlook
Bull Outlook: If the US inflation data exceeds expectations, the market's expectations for a more aggressive rate cut by the Federal Reserve will be further strengthened, and gold prices are expected to re-challenge the high of $3167.60 after a correction. Technically, gold prices need to return to above $3055.00 to reactivate upward momentum. The widening of the Bollinger Band width indicates that volatility is increasing, which provides potential trading opportunities for bulls.
Bear Outlook: In the short term, the downward divergence of the upper track of the Bollinger Band indicates that gold prices may face further corrections. The MACD histogram turned green and continued to expand, suggesting that downward momentum is accumulating. If the gold price falls below the key support of $2,971.31, it may trigger a deeper adjustment, and the next target will be $2,950.00 or even $2,920.00.

LONG ON NZD/USDNZD/USD has been oversold since last week.
It has finally given a change of character (choc) on the lower timeframe witching to bullish.
it is currently in the pullback/retracement phase of the new change.
With the dollar in a overall downtrend and getting ready to fall, this correlation should cause the NZD/USD pair to rise.
I have brought NZD/USD looking to make 200-300 pips this week.

EUR/USD Triangle Breakout (07.04.2025)The EUR/USD Pair on the M30 timeframe presents a Potential Selling Opportunity due to a recent Formation of a Triangle Breakout Pattern. This suggests a shift in momentum towards the downside in the coming hours.
Possible Short Trade:
Entry: Consider Entering A Short Position around Trendline Of The Pattern.
Target Levels:
1st Support – 1.0825
2nd Support – 1.0719
🎁 Please hit the like button and
🎁 Leave a comment to support for My Post !
Your likes and comments are incredibly motivating and will encourage me to share more analysis with you.
Best Regards, KABHI_TA_TRADING
Thank you.

4.7 Interpretation of gold short-term operation ideas! US market4.7 Interpretation of gold late trading operation ideas:
Falling more than 70 points in the morning, it quickly rebounded and reversed! How will gold evolve tonight?
This V-reversal market frequently appears in these three trading days. It is difficult for us to encounter it once or twice a month. This increases the risk of trading. Once you make a mistake, it will be a reversal of dozens of points! When trading, you must strictly use the "stop loss".
We note that the three V-reversals in this stage have common characteristics. The stop in the last trading intensive period means that "3130" can be used as a reference for stage support and pressure. Then these three are: 3130, 3050, 2970---2980
The decline caused by the backlog of sell orders and insufficient liquidity! For gold, it will cause multiple stimulations, panic selling, and funds leaving the market for a short time to avoid risks. Selling gold to fill the gap in other markets and many other factors, and the central banks around the world that intend to reserve gold will not wait! They will still buy strategically, so the trend determines that the decline is limited.
2880 and 2630 are the two main observation positions.
After the small-cycle funds rebounded in the morning, the market entered a triangular consolidation state, the highs were gradually decreasing, and the lows were flattening. This is an obvious sign of market wait-and-see sentiment. The probability of a V-reversal phase or a continuous unilateral trend in the evening increased! If you follow this logic, gold should be under pressure around 3035-3038 during the rebound phase of 16-18 points!
And then continue to fall. Of course, if the EU further expresses its tariffs! It may cause the short-term volatility of the market to intensify!
Any unilateral trend needs to be confirmed in the US market. In the evening, whether it is a V-reversal from north to south or a continuation of the Asian and European market, it is normal. The overall framework will not deviate from the framework of 3130, 3050, 2980!
We will update regularly every day to introduce to you how we manage active ideas and settings. Thank you for your likes, comments and attention. Thank you very much

DeGRAM | DXY continues to growDXY is in a descending channel between trend lines.
The price is moving from the lower boundary of the channel.
During the momentum corrections, the chart successfully maintained the structure and held the 50% retracement level.
We expect the upward movement in the channel to continue.
-------------------
Share your opinion in the comments and support the idea with like. Thanks for your support!

DeGRAM | DXY dollar in the turbulence zoneDXY is in a descending channel under the trend lines.
The price is moving from the upper boundary of the channel.
After breaking the trend line, the chart went sharply lower amid the announcement of trade duties, after which it formed a gap.
On the main timeframes indicators have gone into the oversold zone.
We expect that the index will seek to close the gap after testing the lower boundary of the channel.
-------------------
Share your opinion in the comments and support the idea with like. Thanks for your support!

DXY Bearish trend continues on SSL and Bearish ORDER BLOCKDXY is known for extreme liquidity grabs especially after Trump's tariff announcements. Until we see countries remove tariffs and companies changing factory locations DXY will still be week. A decent pullback this week?? Probably not, Next? Maybe STAY SHARP!!

Bitcoin Lost 50 SMA overnight, what next ? - still BULLISH.In a week where I am still expecting the beginnings of a bounce, we saw a Major Drop overnight.
This has pushed PA below the 50 SMA that I was hoping PA would bounce off, as it had previously.
So, Whats Next ?
It is not as bad as it may appear but CAUTION is a Very Very good idea.
There are a number of lines of support below and if we do not find any soon, 73K is the next line of Support. then down to 71K and ultimately, the long term line at 64K, though I still doubt we will get that low.
But FEAR is BIG...be a Vulture..Buy the remains of people Fear...Bitcoin IS a Scarce asset and people Still want it.
The Weekly MACD
The MACD is now in the bounce Zone. Yes, it may drop below neutral if this "Tariff Fear" continues. But Technically, We now have the ability to bounce once sentiment turns
On a slightly more bearish side is the fact that Histogram has dived deep and Red. The Bears are biting and has momentum
The RSI Relative Strength Index
Like the MACD, the RSI is now in an area where it has bounced in the past and yet, it can still drop further before we reach Neutral ( 30 line ) . It has to be said, the RSI is a bit behind the MACD in that it has a later date when it could reach Neutral. There is no guarantee that Neutral will hold RSI up....
Other Markets are struggling also
The DXY $ has had a sustained drop but is near an area of support. I am watching this closely.
Normaly, we see DXY and BTC move in opposite directions but we have seen both Recover at the same time, The lines between the teo are getting blurred.
GOLD - has been doing well for some omnths
However, in th elast 2 weeks, Gold has been selling off also and saw a steep drop towards the end of last week. Will be very interesting to see where this goes this week
The fact that Gold was selling, shows that investors were comfortable to leave a safe haven.
Lets see if that changes this weel
Conclusion for BITCOIN HOLDERS
This could all sound a little scary for Bitcoin and it should be taken as a HUGE Warning that we Lost the 50 SMA Support. This does open up the possibility of further drops and it may well happen
We are currently heading towards major support at 73K
This is an area I said we could hit a few weeks back and so I am not in a bad state of mind just yet.
If we Loose 71K, I will get uncomfortable.
The Lower timeframes are very much heading to OVERSOLD and so we shold get some support here and then we wait to see if Fear takes hold further.
This week, we Get the FOMC minutes and then Inflation data coming out of the USA
Thsi could Tip the balance either way, depending on the data
For me, I am NOT Selling Just yet.
I imagine many Short term holders will be and these coins will be snapped back up
We wait to see how today plays out
BUY THE DIP

EURUSD: Beginning of the week TrapBeginning of the week trap on EURUSD, seems like price is pulling back towards the previous high. However, I believe EU is still bearish and could get some bearish pushes.

Golden Horizons on the PrecipiceGold on the Brink of a Downturn: A Shift in Market Sentiment
Gold, once a shining symbol of financial security and prosperity, now finds itself on the cusp of a significant bearish turn. The precious metal, which has long been a safe haven for investors during times of economic uncertainty, is entering a new phase that could see its value dwindle in the face of shifting global financial conditions.
The Russian central bank, historically one of the major players in the gold market, is currently at the forefront of this market retreat. By liquidating a significant portion of its gold reserves, Russia is not just participating in the market shift, but may be sending a signal to other nations and financial institutions. Their decision to sell is not an isolated move; it could well be the beginning of a broader trend.
As the Russian central bank offloads its holdings, it's highly probable that other central banks, which have long viewed gold as an essential asset for economic stability, may soon follow suit. These institutions, often holding vast quantities of the precious metal, could begin liquidating their reserves in an effort to take advantage of the currently elevated prices. The global economic landscape is constantly in flux, and with many countries facing mounting fiscal pressures, the temptation to cash in on gold's recent price surge could become too great to resist.
Hedge funds and private investors, always looking for opportunities to capitalize on price movements, may also jump on the bandwagon. They have the flexibility and agility to react swiftly to market shifts, and with a growing consensus that gold may have reached its peak, it would not be surprising if they decide to sell off their positions in the metal. With such a large portion of the market potentially pulling away from gold, the selling pressure could intensify, leading to a sharp drop in prices.
If this trend gains momentum, we could witness a rapid and dramatic decline in gold’s value. The metal, which has been the go-to asset for many investors during times of economic uncertainty, could soon lose its appeal as a safe haven. The factors driving this potential downturn are multifaceted, ranging from shifting monetary policies and global inflationary pressures to geopolitical tensions and central bank strategies.
The impact of this market shift could be far-reaching. Not only would it affect the price of gold, but it could also send shockwaves through the broader commodities and financial markets. If the sell-off gathers pace, it could have a cascading effect, causing investors to rethink their positions in other assets traditionally viewed as safe havens, such as silver or even government bonds.
The question on many investors’ minds is whether this bearish trend is a temporary correction or the beginning of a longer-term downturn. Only time will tell, but one thing is certain: the dynamics of the gold market are shifting, and the once steady climb of the metal may now be facing a downward spiral.
For those who are closely following the market, it is essential to stay updated on the latest developments. A deeper analysis of the factors driving this potential gold sell-off and the broader market implications can offer valuable insights into the direction of this volatile asset.
As we continue to monitor the situation, I encourage you to stay informed and consider how these developments could impact your own investments. While gold may still hold value in the eyes of many, its future trajectory is now uncertain, and the risk of significant price fluctuations looms large.
Thank you for your attention, and I wish you the best of luck navigating these turbulent financial waters!

We Have direction. We wait on confirmation! GOLD!Looking for price to give is a little more indication that it wants to continue bullish. We have areas to fill on larger time frames before it gives us a stronger play for bigger moves. Just have to be patient and wait for price to give us more solid indication. As Always #NOFOMO!

Bearish continuation?US Dollar Index (DXY) is rising towards the pivot an could drop to the 1st support.
Pivot: 103.26
1st Support: 101.79
1st Resistance: 104.68
Risk Warning:
Trading Forex and CFDs carries a high level of risk to your capital and you should only trade with money you can afford to lose. Trading Forex and CFDs may not be suitable for all investors, so please ensure that you fully understand the risks involved and seek independent advice if necessary.
Disclaimer:
The above opinions given constitute general market commentary, and do not constitute the opinion or advice of IC Markets or any form of personal or investment advice.
Any opinions, news, research, analyses, prices, other information, or links to third-party sites contained on this website are provided on an "as-is" basis, are intended only to be informative, is not an advice nor a recommendation, nor research, or a record of our trading prices, or an offer of, or solicitation for a transaction in any financial instrument and thus should not be treated as such. The information provided does not involve any specific investment objectives, financial situation and needs of any specific person who may receive it. Please be aware, that past performance is not a reliable indicator of future performance and/or results. Past Performance or Forward-looking scenarios based upon the reasonable beliefs of the third-party provider are not a guarantee of future performance. Actual results may differ materially from those anticipated in forward-looking or past performance statements. IC Markets makes no representation or warranty and assumes no liability as to the accuracy or completeness of the information provided, nor any loss arising from any investment based on a recommendation, forecast or any information supplied by any third-party.


USDCHF OUTLOOKHappy New Year!
Hope you had a good break during the holiday season. Let's go again this year!
The USD has been extremely bullish in the last few months of 2024 , with current economic climate and market seasonality, I will be expecting a bearish Dollar this year, I will update this idea with time.
Hence, this is my this current outlook on USDCHF.
"May fortune attend thee, and thy trade prosper." .......L2Earned

U.S. Dollar Index (DXY) - Bearish Breakdown or Reversal?📊 U.S. Dollar Index (DXY) - 4H Chart Analysis
🔵 Supply Zone (104.400 - 104.683)
🟦 Resistance area where sellers may step in 📉
🟡 Key Level (~104.200)
🟧 Decision point – price struggling to hold this level
📉 Trend Line (Broken) 🔻
❌ Previous uptrend is broken, signaling potential bearish momentum
🟢 Demand Zone (103.200 - 103.400)
🟩 Support area where buyers may get active 📈
🚀 Potential Market Movement:
1️⃣ Bearish Breakdown Expected ⬇️
🔹 Price broke below trendline ➡️ selling pressure increasing
🔹 Possible pullback to key level (~104.200) before more downside
🔹 Targeting demand zone (~103.200-103.400) 🎯
2️⃣ Invalidation/Stop-Loss 🚫
🔺 If price moves back above 104.683, bearish setup is invalid
🔺 Stop-loss placed at 104.683 for risk management
🎯 Trading Strategy:
✅ Short Entry: After pullback near 104.200
🎯 Target: 103.200 demand zone
⚠️ Stop Loss: Above 104.683

Gold | Oil | Dollar | Silver | Natural Gas Price ForecastGold | Oil | Dollar | Silver | Natural Gas Price Forecast

DXY PULLBACK EXPECTED|SHORT|
✅DXY surged again to retest the resistance of 103.400
But it is a strong key level
So I think that there is a high chance
That we will see a bearish pullback and a move down
SHORT🔥
✅Like and subscribe to never miss a new idea!✅
Disclosure: I am part of Trade Nation's Influencer program and receive a monthly fee for using their TradingView charts in my analysis.
DXYWe are expecting this week for the dollar to give us reaction towards 103.5 level and above.
Disclosure: We are part of Trade Nation's Influencer program and receive a monthly fee for using their TradingView charts in our analysis.

U.S. Dollar Index (DXY) – Weekly Outlook | Elliott Wave Analysis
This DXY weekly chart highlights a potential (A)-(B)-(C) corrective structure unfolding after a completed 5-wave impulsive rally. Wave A bottomed out around the 100 level, followed by a retracement in Wave B which tested the 111.893 supply zone. Currently, price is reacting strongly from that level, suggesting a possible move toward completing Wave C.
Current Market Structure:
Wave B faced strong rejection near the 111.893 resistance/supply zone.
Price is now hovering near a short-term support zone (light green) around 102–100, which could serve as a decision point.
Two scenarios are in play:
1. Bullish Rejection from Support: If buyers defend the support, a new bullish leg may begin, retesting 111.893 or even pushing slightly higher.
2. Break Below Support: A decisive breakdown could initiate a deeper decline toward the major demand zone (highlighted in beige) near 90.00–92.50, completing Wave C.
Key Technical Zones:
Resistance (Supply Zone): 111.893
Immediate Support: 100.00–102.00
Major Demand Zone (Wave C Target): 90.00–92.50
Current Price: 102.892
Elliott Wave View:
The ongoing move appears to be part of a Wave C correction, which will be confirmed only if price breaks below the current support. On the flip side, a higher low and bullish continuation could mean the correction ended early, transitioning into a fresh impulse.
Conclusion:
The DXY is at a critical juncture. Traders should monitor price action closely at the 100–102 zone. A bounce could trigger a bullish setup back toward resistance, while a breakdown would likely bring Wave C to completion in the 90–92.50 zone.
Stay tuned and trade with discipline.

USDJPY - 4H more fall expectedFX:USDJPY - 4H Update 🔻
If you've traded USDJPY in recent years, you're no stranger to the significance of the 150.00 zone. This level has historically acted as a critical resistance and psychological barrier.
Now, the pair is trading below this key level and has also broken the ascending channel support on the daily timeframe, signaling that bulls are likely out of the game. The recent drop to 147.00 and bounce toward 151.00 could be setting up the next short opportunity.
📌 What to watch for:
A liquidity grab above the 151.50–152.00 zone could occur before the next fall.
This aligns with institutional behavior, hunting stops before continuing the trend.
We're now in a sell-the-rally phase, watching for confirmations around the red zone.
Remember, I previously signaled a short from the 157 zone, which played out beautifully. We’re now gearing up for the next big short, and this setup might just be it.
📉 Stay cautious, wait for price action signals, and trust the structure.
💸 If you’ve missed previous entries, don’t miss what’s coming next!
🔔 Follow for real-time updates and live trade ideas!

Blueprint for Becoming a Successful Forex Trader in 2025🚀 Blueprint to Becoming a Successful Forex Trader in 2025: Leveraging ICT, Automation, and Prop Funding
Here’s a detailed, actionable blueprint designed to position you for success by carefully navigating broker selection, adopting advanced trading strategies, obtaining prop funding, and integrating automation and AI technologies into your trading.
🏦 Broker Selection (Actionable Steps)
🔍 Choose brokers with true ECN/STP execution
⚡ Ensure brokers offer low spreads (0.0-0.2 pip average) and fast execution to maximize ICT precision entries.
🛡️ Prioritize brokers regulated by ASIC, FCA, or FSCA with verified Myfxbook execution reports.
📊 Confirm broker compatibility with MetaTrader 4 (MT4) to seamlessly integrate Expert Advisors (EAs).
💳 Check for flexible withdrawal/deposit methods and swift payouts (Crypto, Wise, Revolut).
🎯 Trading Strategy (ICT Concepts & Supply-Demand Zones)
🧠 Master ICT Concepts: Liquidity sweeps, Order Blocks (OB), Fair Value Gaps (FVG), Market Structure Breaks (MSB).
📍 Combine ICT with Supply-Demand: Identify institutional supply-demand zones aligning with ICT Order Blocks & liquidity areas.
📐 Execute High-Probability Setups: Trade only after liquidity grabs at key daily/weekly ICT points, avoiding retail traps.
📈 Time & Price Theory: Trade London Kill Zones and New York Open exclusively, exploiting predictable ICT volatility.
📆 Weekly Preparation: Annotate D1/H4 charts on weekends marking liquidity points, order blocks, and premium/discount zones clearly.
💰 Getting Prop Funding (Actionable Approach)
🥇 Target reputable prop firms (FTMO, MyForexFunds, The Funded Trader, 8cap, etc) with clear and attainable evaluation objectives.
📑 Use ICT trading style for evaluation: lower-frequency, high-probability trades with clearly defined risks.
🎯 Implement strict risk management rules: never exceed 1% risk per trade, aiming for steady account growth (5-10% monthly target).
📊 Monitor performance closely using provided analytics dashboards (e.g., FTMO Metrics App) and adapt accordingly.
📚 Diversify funded accounts across multiple firms, compounding total available trading capital while reducing firm-specific risk.
⚙️ Automating & Executing Trades (MT4 EA & Bots)
🛠️ Hire experienced MQL4 developers to code custom ICT-based MT4 Expert Advisors
🤖 Develop EAs specifically around ICT logic (Order Block detection, liquidity grabs, market structure shifts) and or supply/demand logic
🤖 use advanced algo based breakout EAs for automation
📌 Automate trade management: EAs should handle entry precision, partial exits, break-even stops, and trail stops.
📡 Set EAs on VPS Hosting (NY4, LD4) for optimal latency and consistent execution (ForexVPS, AccuWeb Hosting).
📈 Regularly perform forward-testing and optimization of EAs on demo accounts before live deployment (at least quarterly optimization).
📲 Integrating Advanced Bots and Technology in 2025
📊 Combine your MT4 EAs with third-party analytics platforms for detailed trade performance insights.
🔮 Incorporate AI-based forecasting tools to refine ICT setups and trade signals.
🔔 Use automated bots for real-time alerts on ICT-based setups via Telegram or Discord channels.
🧑💻 Maintain manual oversight for discretionary ICT decisions—use automation for entry efficiency, not blind reliance.
🔄 Continuously retrain and update your bot’s logic monthly using the most recent trade data, ensuring adaptive execution.
🗓️ Daily Routine for Success
🌅 Pre-session (30 mins): Review annotated charts, ICT concepts (liquidity, OB, FVG), and supply-demand levels.
💻 During trading session: Monitor EA execution, manually adjust positions based on real-time ICT setups.
📝 Post-session (15 mins): Journal trades meticulously in detail, noting ICT reasoning behind wins and losses.
📆 Weekly review: Assess overall ICT & EA performance—adjust EA parameters as needed to match evolving market conditions.
📚 Continuous learning: Keep updated on advanced ICT framework,
supply demand zone trading.
📌 Final Actionable Advice for 2025
🔍 Specialize intensely on ICT & supply-demand concepts rather than multiple strategies—depth over breadth.
🚩 Always adapt and evolve your trading algorithms to ICT methodology—market dynamics continually change.
🧘 Maintain emotional discipline and patience, relying on high-probability setups to steadily compound your account.
💡 Stay ahead by embracing technology: automation, AI-driven forecasting, and custom ICT tools will provide a significant edge in 2025.

DXY Breaking Down?The US Dollar Index (DXY) may be entering a strong bearish wave. After completing wave B, the market has started impulsive wave C to the downside. Currently, wave 3 might be ending, with a potential short-term bounce for wave 4, followed by a drop into wave 5.
Key Bearish Outlook:
Resistance Zone (Wave 4): 104.924 – 104.932
Invalidation Level: 106.505
Final Wave 5 Target: Near 93.422
If price stays below the invalidation level, more downside is expected. Watch for shorting opportunities if wave 4 completes and reverses.
