DXY Update – Two Possible Scenarios! 📢 DXY Update – Two Possible Scenarios! 📢
1️⃣ Bearish Scenario: Looking for sell from the Bearish OB 🎯
2️⃣ Bullish Scenario: If price doesn’t reach the Bearish OB, we shift focus to the Bullish OB for a potential buy ✅
📌 Waiting for price to approach key zones & using confirmations for entry!
📊 Stay updated with our latest analysis – Follow our TradingView page! 🚀
J-DXY

Weekly FOREX Forecast Mar 24-28: Buy CAD, CHF, JPY vs USD!This is an outlook for the week of March 24 - 28th.
In this video, we will analyze the following FX markets:
USD Index
EUR
GBP
AUD
NZD
The USD Index is entering a Daily +FVG, which is nested in a Weekly +FVG. This is a bearish indication for the USD, which is a potential bullish situation for EURUSD, GBPUSD, AUDUSD and NZDUSD. This will be potentially bearish for the USDCAD, USDCHF, and USDJPY. Wait for the market structure shift going in the direction of your TP, and enter on the pullback.
Enjoy!
May profits be upon you.
Leave any questions or comments in the comment section.
I appreciate any feedback from my viewers!
Like and/or subscribe if you want more accurate analysis.
Thank you so much!
Disclaimer:
I do not provide personal investment advice and I am not a qualified licensed investment advisor.
All information found here, including any ideas, opinions, views, predictions, forecasts, commentaries, suggestions, expressed or implied herein, are for informational, entertainment or educational purposes only and should not be construed as personal investment advice. While the information provided is believed to be accurate, it may include errors or inaccuracies.
I will not and cannot be held liable for any actions you take as a result of anything you read here.
Conduct your own due diligence, or consult a licensed financial advisor or broker before making any and all investment decisions. Any investments, trades, speculations, or decisions made on the basis of any information found on this channel, expressed or implied herein, are committed at your own risk, financial or otherwise.

Weekly Market Analysis - 22nd Mar 2025Ok, here we go with another weekly market analysis!
So, what I'm feeling from my charting is that we may get a lower USD, but not before a little retracement first, particularly an iFVG on the 2W timeframe. After that, lower prices. This coincides with some of my analysis of other pairs, but not all of them. Whilst everything is not aligned yet, my instincts are usually pretty good. But, this not mean I am jumping into any trades yet. I have my own techniques for getting in and out of trades.
Check out the video and see if your own analysis flows with mine!
Analyzed pairs: DXY, EURUSD, NZDUSD, USDCHF, USDCAD, USDJPY, OIL, XPD, XPT, XAU, BTC.
Happy trading!
- R2F Trading

3.22 Gold Short-term Trend Analysis and SuggestionsTechnical analysis:
From the daily chart, technical indicators show signs of upward exhaustion and lose strength at extreme levels. At the same time, gold prices are holding above all bullish moving averages, with the 20-day simple moving average (SMA) providing dynamic pressure near 2941.70. From the 4-hour chart, the 100-period SMA and 200-period SMA continue to move higher, well below the above short-term moving averages. At the same time, the momentum indicator moves lower in the positive area but loses downward strength; while the relative strength index (RSI) corrects the overbought condition and then stabilizes near 61. Overall, Zhang Jinglin recommends wide fluctuations in gold operations today!
Short-term operation strategy:
SELL: Short near 3045 above, stop loss 3051, target near 3015, 3000.
We update regularly throughout the day and tell you how we manage active ideas and settings. Thank you for your likes, comments and attention, we are very grateful!

GBP/USD is heating up! A major shift is coming—are you ready?"Analysis:
The correlation between DXY & GBP/USD is playing out perfectly! As the Dollar Index (DXY) approaches key resistance in the 112-113 zone, GBP/USD is reacting inversely, showing signs of a potential drop toward 1.14.
Elliott Wave patterns confirm a high-probability reversal setup, aligning with macroeconomic factors and liquidity zones. If DXY gains strength, expect a bearish breakdown on GBP/USD.
📈 Key Levels to Watch:
GBP/USD Resistance: 1.32-1.34
GBP/USD Support: 1.14
DXY Resistance: 112-113
DXY Support: 102.5
💡 Will GBP/USD hold or break down? Drop your predictions below! 👇

Eurusd short term long 21 Mar 25Support holding and dxy falling, looking for a move back up for the short term
Good luck

$DXY is pulling back to a strong support zoneTVC:DXY is reaching a strong support zone and a pullback could end here of continue to 100. Key support level is being tested.

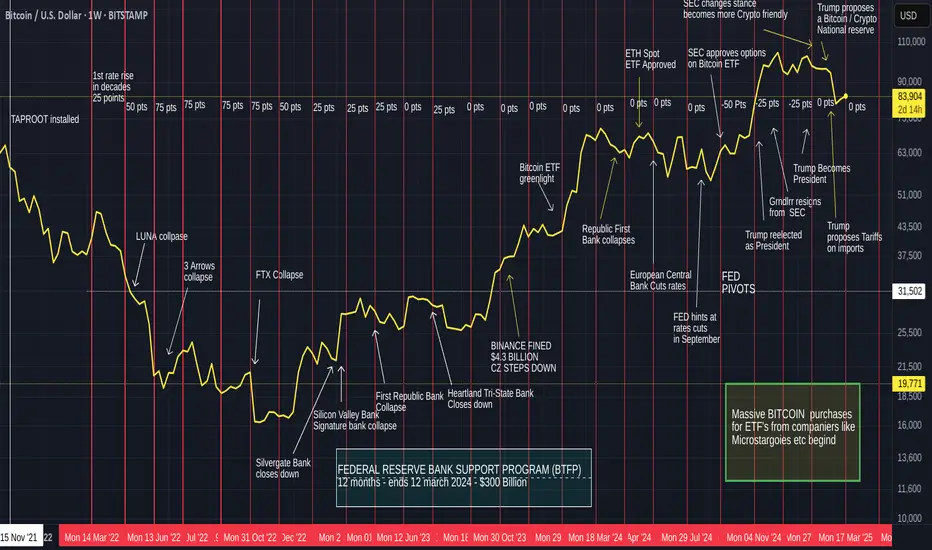
Bitcoin, interest rate effects, Macro events since 2021 - UPDATEThere is one very simple takeaway for me from this chart and that is simply that raises and Lowering of interest rates had Very little Effect on Bitcoin
It is more the effect it had on other organisations and the sentiment that followed Bitcoin and the traders.
For instance, From Jan 2023, when we saw Bitcoin begin its recovery, interest rates continued to rise.....and had NO effect on the Bitcoin recovery
And I think this continues to this day.
After the First push higher by Bitcoin in 2023, PA went into a Long range...in this time, interest rates began remaining at a static level. Bitcoin did not rise because of this.
When BTC was ready, it made a push higher again, interest rates were static and remained so while BTC entered another long range in 2024
It could be said that BTC PA rose once Rates were reduced but PA leveled out again even while the next rates decision was to reduce.
Bitcoin has its own agenda, it is NOT dependant on the USA to control its choices
On Each range, the MACD on the weekly timef rames was OVERBOUGHT.
And it is currently resetting having been overbought again.
This s NOTHING to do with interest rates.
MACRO events do have an impact though and we need to pay attention this this
But over all, Bitcoin is GOOD, BULLISH and getting ready for its next push
Have a Nice day now
DXY aka USD suspicious leading diagonalif price confirms it is a leading diagonal, we will see a corrective move down before another spike higher.
Am eagerly waiting for the confirmation to load up positions in eurusd gpb aud etc as DXY will show the way, it moves up mean USD bullish and hence eurusd gbpusd etc moves down.
Good luck.
PS: Give a boost if you like my sharing

DXY, bullish or bearish?Welcome back!
Today i'm posting a small idea on the DXY. Usually i cover crypto but the macro is important. A weak dollar correlates with more risk being taken and a strong dollar with less risk being taken. Hence my analysis of the DXY.
In the above chart a couple of things can be seen which makes the outlook hard to predict.
On one side there is a bullflag on the monthly timeframe with a target of 130!
On the other side, looking under we can see a bearish MACD cross and a bearish stoch RSI. On average it takes half a year to a year for a cross like this to recover.
This causes me to be bearish on the dollar and bullish on risk-on assets.
Thanks for reading


U.S. Dollar Index (DXY) – Bearish Outlook with Key Levels📉 Bearish Bias on U.S. Dollar Index (DXY) – 4H Chart
🔹 Resistance Zone & Stop Loss 🚫
📍 Resistance: 104.200 - 104.432
🛑 Stop Loss: 104.432 (Above resistance zone)
🔸 Support Zone 🛠️
📍 Intermediate Support: 103.300 (Possible bounce)
🔻 Target Point 🎯
📍 Target Price: 102.232 (Expected downside)
📊 Price Action Outlook:
✅ Bearish Scenario:
Price rejected from resistance 🔽
Lower highs forming ⚡
Breakdown expected toward 102.232 🎯
❌ Invalidation:
If price breaks above 104.432, bearish setup fails 🚫
🔥 Conclusion:
⬇️ Sell Bias below 104.200 targeting 102.232
❌ Cut losses if price closes above 104.432

Breakout on the DXY - Is the DXY going higher?What is the DXY?
The DXY (U.S. Dollar Index) measures the strength of the U.S. dollar relative to a basket of six major currencies. A rising DXY indicates a strengthening of the U.S. dollar. This can have significant effects on cryptocurrencies, particularly in the short- and medium-term. Here are some of the key impacts:
What does an increase in the DXY mean for crypto?
Negative Impact on Crypto Prices: As the dollar strengthens (rising DXY), the relative value of other assets, including cryptocurrencies, can decline. Many cryptocurrencies are priced in U.S. dollars, so when the dollar strengthens, the same amount of dollars may buy fewer crypto assets, leading to price declines for cryptocurrencies.
Safe-Haven Movement: When investors flock to the U.S. dollar due to its rising strength, they may move capital out of riskier assets like crypto and into the dollar or U.S. Treasury bonds, which are seen as safer. This can cause a decrease in demand for cryptocurrencies.
What can we conclude from the 4-hour DXY chart?
The DXY experienced a rapid decrease this month, resulting in a drop from 108 to 103. However, after this sharp decline, the price has shown some bullish signs.
First: The price action kept making lower lows while the RSI made higher lows, resulting in a bullish divergence.
Second: The price action formed a specific pattern commonly found at the end of a downtrend. This pattern shows that the price is making small lower lows and lower highs, suggesting market exhaustion and a possible upside move toward the resistance zone.
The resistance zone aligns with the golden pocket Fibonacci level, indicating it could be a strong rejection level.
It is highly probable that the DXY could make an upside move to the resistance zone and golden pocket after breaking this bullish chart pattern.
What do we see on the daily timeframe?
The price dropped rapidly from 108 to the support zone at 103. After consolidating at this level, the price made a slightly lower low, while the RSI made a higher low. This indicates a bullish divergence on the daily timeframe. Before this drop, the DXY formed a typical bearish chart pattern known as Head and Shoulders (H&S). The neckline of the pattern coincides with the resistance zone on the 4-hour timeframe and the golden pocket. This suggests that it may be a difficult level to break.
Thanks for your support.
- Make sure to follow me so you don't miss out on the next analysis!
- Drop a like and leave a comment!
Lets chat in the comment section. See you there :)

DXY: Starting a new Channel Up rally into Summer.The U.S. Dollar Index is near the oversold zone on its 1D technical outlook (RSI = 37.232, MACD = -1.040, ADX = 33.922) having reached the bottom of the 9 month Channel Up. The 1D RSI was oversold last week but is seen rebounding. This is exactly the kind of formation we had on the previous bottom of the Channel Up as well as the December 28th 2023 low.. The selling sequences that led to those lose have been almost the same as today's (-6.32% and -5.74%). The last Channel Up bullish wave reached exactly the 1.618 Fibonacci extension. Consequently we can go long here with an acceptable risk, targeting the top of the Channel Up (TP = 113.000).
## If you like our free content follow our profile to get more daily ideas. ##
## Comments and likes are greatly appreciated. ##

DXY SELL/SHORTBy utilizing Fibonacci retracement levels, historical patterns, , we can formulate a hypothesis that the market might follow a similar trajectory if bearish sentiment prevails.

Dxy aka usd short term bullishAs price broke above the ending diagonal strongly, my bias is now bullish for usd, it should rise higher before another leg lower.
Good luck

eurusd h4 pullback in progress buy dips target 1150🏆 eurusd Market Update
📊 Technical Outlook
🔸Mid-term: BEARISH OUTLOOK
🔸Status: pullback in progress
🔸Hit resistance at 0950
🔸0650/0660 normal pullback
🔸300 pullback off the recent highs
🔸BULLS still maintain control
🔸Price Target Bears: 0650/0660
🔸Price Target BULLS: 1100/1150
📊🔥 Latest EUR/USD & Fed Update
🛑 Federal Reserve Decision:
🏦 Fed Holds Rates Steady – No rate cuts yet, citing economic uncertainty. 📉⚖️
📊 Growth Forecasts Lowered – 2025 GDP outlook down to 1.7% as trade tensions weigh on the economy. 🌍📉
💸 Inflation Expectations Rise – Now at 2.7%, signaling persistent price pressures. 🔥💰
💱 EUR/USD Market Reaction:
💹 EUR/USD Steady at 1.0900 – Traders await ECB President Lagarde’s speech for further direction. 🏦🇪🇺
📉 USD Under Pressure – DXY drops to 103.40, as declining yields weaken the dollar. 💵🔻
📊 Market Cautious – Investors eye ECB policies & Fed rate-cut expectations for next moves. 🔍

$USINTR - U.S Interest Rates (March/2025)ECONOMICS:USINTR
March/2025
source: Federal Reserve
- The Fed keep the funds rate unchanged at 4.25%-4.5%,
but signaled expectations of slower economic growth and rising inflation.
The statement also noted that uncertainty around the economic outlook has increased, but officials still anticipate only two quarter-point rate reductions in 2025.

Setup #006 - AUDUSD - Long (Not the cleanest)Trade entered. I used the 5 min for entry but Tradingview doesn't let me post it on a small time frame.
We should find out if this is a winner or loser during the rest of US/UK overlap. I personally think price wants to drop more, but my strategy says to buy, so I'm listening to the strategy, plus there is a nice risk to reward for this trade.
Confluences:
✅ Bullish overall bias
✅ Bulllish demand zone
✅ Bullish ABCD on 15 min chart, bullish impulse crab on H4
✅ Bullish divergence in price reversal zone
✅ Buillish break of structure
✅ Entering NY open
✅ Break of structure confirmed
✅ Required risk:reward met

Gold 1H Intra-Day Chart 19.03.2025Our $3,035 buy target has been hit. So what's next?
Option 1: Gold drops lower towards $3,020 before pushing back up again.
Option 2: Gold pushes higher towards $3,042 before it DROPS lower.
Which option do you agree with more?

Gold at $3,000: The Ultimate Panic Buy or Just Another Bubble? 💰 Gold Hits Record Highs – Because the World is on Fire 🔥
Ah, gold—humanity’s favorite panic button. As of March 2025 , gold prices have skyrocketed past $3,000 per ounce . Why? Because the world can’t go five minutes without a crisis. 🌍💥
Trade wars? Check.
Geopolitical conflicts? Check.
The eternal struggle between "experts" predicting doom and moonboys screaming ‘buy the dip’? Check.
With the U.S. economy wobbling like a Jenga tower after a few tequila shots and global uncertainty at an all-time high, investors are piling into gold like it’s the last lifeboat on the Titanic. 🚢💨
🏦 Central Banks: The Ultimate Gold Hoarders
If you think you have a gold addiction, meet central banks. These guys have been buying over 1,000 metric tons per year —basically turning their vaults into dragon lairs. 🐉💰
Why? Because they definitely trust fiat currencies… just not enough to NOT hedge against their own policies. 😏
China, India, and Turkey are leading the charge, stacking gold like it’s a limited edition NFT.
The logic? If everything goes to hell, at least they’ll have something pretty to look at.
📈 What Do the ‘Smart People’ Think? (Spoiler: They Don’t Agree 🙄)
Let’s check what the big banks are saying—because if there’s one thing banks are great at, it’s being consistently wrong with their predictions.
JP Morgan Private Bank is feeling "constructive" about gold. Which is just a fancy way of saying "Eh, we have no clue, but it looks good." They think potential Fed rate cuts could send gold higher. 🚀
VanEck highlights how central banks and investors drove gold to new highs in 2024. Basically, everyone’s running for cover while pretending it’s a “strategic allocation.”
🤔 Should You Buy Gold or Just Watch the Chaos?
Pros: You get a shiny rock that everyone suddenly cares about during a crisis. 🌟
Cons: No dividends, no passive income, and you basically just hope some sucker will pay more than you did. 😬
Gold is a great hedge when the world is melting down, but let’s not pretend it’s some magical wealth generator. If you’re buying, just make sure it’s not because your Uber driver said it’s "going to the moon." 🚀🌕
(Not financial advice. But definitely sarcastic advice. 🤷♂️)
If you want the deeper breakdown (the one nobody’s telling you), drop a comment or DM me. Maybe I’ll let you in on the real insights. 👀🔥

If you don't have DXY, keep an eye on USDCHF.Today we are waiting for the Federal Reserve interest rate decision, where the Bank is expected to keep the rates unchanged. However, it's the press conference, which we are more bothered about. Keep your eyes on TVC:DXY , but if you don't have MARKETSCOM:DOLLARINDEX , then MARKETSCOM:USDCHF will be just as good.
Let's dig in.
FX_IDC:USDCHF
Let us know what you think in the comments below.
Thank you.
74.2% of retail investor accounts lose money when trading CFDs with this provider. You should consider whether you understand how CFDs work and whether you can afford to take the high risk of losing your money. Past performance is not necessarily indicative of future results. The value of investments may fall as well as rise and the investor may not get back the amount initially invested. This content is not intended for nor applicable to residents of the UK. Cryptocurrency CFDs and spread bets are restricted in the UK for all retail clients.

EUR/USD Analysis (4H & Weekly)Price broke liquidity above D candle → Now expected to drop to 4H FVG.
Waiting for 4H confirmation before entering a sell:
Break & Retest of key level.
Formation of FVG and retest.
Market Structure Break (MSB) in lower timeframe (15min).
Targets:
First: FVG Weekly Mitigation
