We shall Continue with Bullish activity on GOLD?Looking for a bullish play as I seen the Dollar broke its weekly level. Looking for it to continue but need to see a pullback for entry first. We must wait for the killzones for sure.
J-DXY

EurUsd ShortEUR/USD Short Idea
The EUR/USD pair is approaching the 1.09700--1.09940--1.10204 resistance level, which aligns with a significant supply zone and a potential area for bearish reversal.
Key Analysis:
Resistance Zone:
The 1.09700--1.09940--1.10204 levels marks a critical resistance where selling pressure has previously emerged.
Technical Indicators:
RSI is approaching overbought conditions, indicating limited upside potential.
Bearish divergence may form if momentum weakens near this level.
Fundamental Context:
A stronger USD due to hawkish Fed sentiment or economic data could pressure EUR/USD downward.
Eurozone economic uncertainties may add to bearish bias.
Entry: Short positions around 1.09700--1.09940--1.10204
This setup offers a favorable risk-reward opportunity in a high-probability reversal zone.

DXY (U.S. Dollar Index) Bearish Outlook – Key Levels & PredictioDXY (U.S. Dollar Index) Analysis – Daily Chart
🔹 Recent Downtrend:
The DXY has been in a strong decline ⬇️ after breaking key support around 104.5 📉.
The price dropped sharply, showing bearish momentum 🚨.
🔹 Key Zones Identified:
Resistance Zone (104.0 – 105.0) ❌📊 (Previously support, now acting as resistance)
Support Zone (100.5 – 101.0) ✅📉 (Potential target for further downside)
🔹 Expected Price Movement:
A possible short-term bounce 🔄 back toward the 104.0 - 104.5 resistance ⚠️.
If rejected ❌, the downtrend may continue toward the 100.5 – 101.0 level 🎯📉.
🔎 Conclusion:
✅ Bearish Bias – Trend favors further downside unless the price reclaims 105.0.
📌 Watch for a retracement before another drop 📉.
📊 Key Levels:
Resistance: 104.0 – 105.0 🚧
Support: 100.5 – 101.0 🛑

Gold Sell Off (1H UPDATE)As you’ve seen from the video analysis, Gold is currently creating a ‘Complex Triangle Correction’ made up of 5 Sub-Waves.
Potential Sell Zones:
⭕️Wave C High
⭕️Wave E High

Dollar Index(DXY) Rebounds from Key Support–Is a New High Cominghello guys.
Let's see what happened for us index and what will happen:
Uptrend Support:
The price has been respecting a long-term ascending trendline since 2011, indicating a strong bullish structure.
Recent price action suggests that the index retested this trendline and bounced off it.
Key Resistance & Breakout Potential:
The index is in a consolidation phase after reaching a local high.
If the price holds above the trendline and breaks the previous high (~13,250-13,400), it could trigger further upside movement.
The next potential target is near 13,500-13,800 based on historical price action and Fibonacci extensions.
-------------------------------------------------
Possible Scenario:
Bullish Case: If the price holds above the trendline and breaks the current range resistance, it could continue toward new highs.
Bearish Case: A breakdown below the 12,800 support level could lead to a deeper correction toward 12,400-12,000.
-------------------------------------------------
Consequences of This Move:
For USD Strength:
A bullish continuation in the Dollar Index means a stronger USD, which could negatively impact commodities (gold, oil) and emerging market currencies.
Forex pairs like EUR/USD and GBP/USD could decline as the USD gains strength.
For Global Markets:
A weaker DXY (if the support breaks) would typically support equity markets and commodities like gold and Bitcoin, as a weaker dollar makes them more attractive.
-------------------------------------------------
Conclusion:
The chart suggests bullish momentum, but confirmation is needed with a breakout above 13,250-13,400.
As long as the price respects the trendline and Fibonacci support, the uptrend remains intact.
Keep an eye on macroeconomic events (e.g., Fed rate decisions, inflation data), as they can impact this movement significantly.

U.S. Dollar Index (DXY) – Key Technical Levels & Market OutlookU.S. Dollar Index (DXY) Monthly Chart Analysis 📊💵
The U.S. Dollar Index (DXY) is currently navigating a critical price structure, with key supply and demand zones influencing market direction. Here’s a professional breakdown of the chart’s technical outlook:
📍 Key Technical Insights
✅ Supply & Demand Zones
Supply Zone (Resistance): 109 - 114 📈 – A key area where selling pressure has historically emerged. A decisive breakout above this level could signal further upside potential.
Demand Zone (Support): 100 - 103 📉 – A strong accumulation zone where buyers have stepped in previously. A breakdown below could indicate a shift in market sentiment.
✅ Market Structure & Momentum
A Break of Structure (BOSS) has been identified, signaling a shift in trend dynamics.
The market is currently ranging between major resistance (~109) and support (~100).
✅ 200-Month Moving Average 📊
The long-term moving average (red line) is acting as dynamic support, reinforcing the bullish bias unless decisively breached.
📊 Potential Scenarios
🔹 Bullish Outlook: If DXY maintains support above 100-103 and breaks past 109, the index could aim for 114+ in the coming months. 🚀
🔹 Bearish Risk: A sustained drop below 100 may open the door for further downside towards 95-89, signaling a broader correction. ⚠️
📌 Conclusion
The DXY remains in a consolidation phase, with key inflection points around 103 (support) and 109 (resistance). A breakout or breakdown from this range will determine the next major trend. Traders should monitor these levels closely for potential trading opportunities.

ADA on high time frame
"Hello traders, focusing on ADA on high time frames, the candle formations suggest a zone that may entice many to buy. However, as a holder, I believe it's prudent to await further price information. I will continue to monitor the situation and update my analysis accordingly."
If you need further assistance or have any specific questions, please feel free to let me know!

USDCHF BUY NOW!!Nice wyckoff distribution, we can see price now heading higher, structure indicate buying pressure is coming in the market!!!
Nice risk to reward!!! see you later

GBP/USD Double Top (11.03.2025)The GBP/USD Pair on the M30 timeframe presents a Potential Selling Opportunity due to a recent Formation of a Double Top Pattern. This suggests a shift in momentum towards the downside in the coming hours.
Possible Short Trade:
Entry: Consider Entering A Short Position around Trendline Of The Pattern.
Target Levels:
1st Support – 1.2784
2nd Support – 1.2724
🎁 Please hit the like button and
🎁 Leave a comment to support for My Post !
Your likes and comments are incredibly motivating and will encourage me to share more analysis with you.
Best Regards, KABHI_TA_TRADING
Thank you.

Waiting for GOLD to Act right!Looking for a bullish play but waiting for price to get the shakes out. It is stuck inside of rotational value on a much larger scale. Need to see it break outside of that Value.

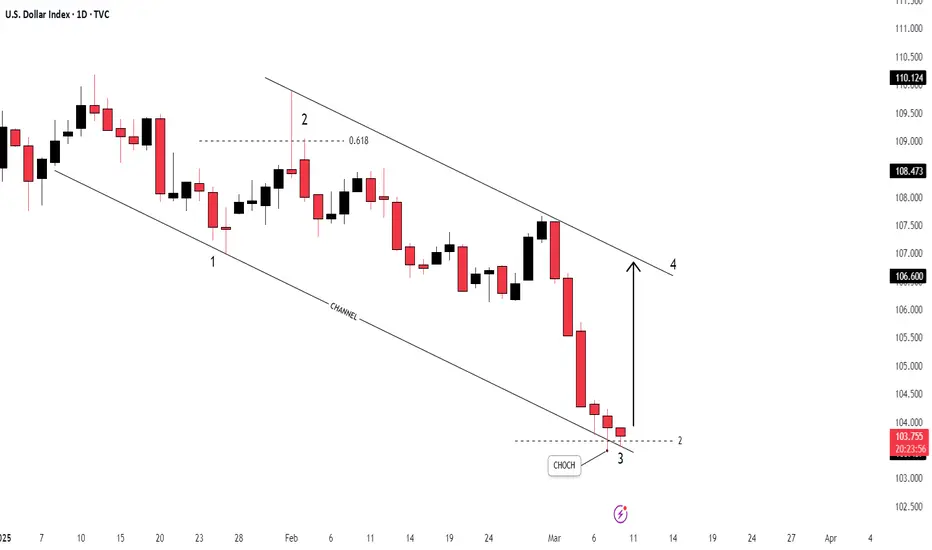
DXY Breakdown: Major Support in Play or More Downside Ahead?Welcome back, guys! 👋
I'm Skeptic , and let's kick off the week with a unique and exciting analysis of DXY.
🔍 Daily Time Frame Analysis
Starting with the daily time frame, DXY recently hit a significant peak at 109.655 , followed by a sharp decline, breaking below the critical support zone at 107.405 . This breakdown resulted in forming lower highs and lower lows, confirming a bearish structure. Afterward, DXY retraced sharply to the 0.618 Fibonacci level of its major uptrend, signaling a potential corrective phase.
Although the sentiment remains bearish for now, we must consider the possibility of a price reversal from this crucial support zone.
⏳ 4H Time Frame Analysis
Now, moving to the 4-hour time frame, as discussed in the previous analysis, we anticipated a breakdown of 104.235 , which indeed played out, hitting our target of 103.398 . Currently, the 104.235 level serves as a 4H resistance, while 103.303 acts as a daily support.
These two levels form our main triggers:
💚 Long Trigger: Above 104.259 (confirming a potential reversal)
🔴 Short Trigger: Below 103.303 (aligned with the short-term downtrend)
The short trigger has a higher win rate and risk-to-reward ratio since it aligns with the ongoing bearish trend.
💡 Final Thoughts
Thanks for sticking with me through this analysis! I hope your week ahead is profitable and insightful.
Remember, planning and executing trades with clarity is the key to long-term success.
Catch you on the next breakdown! 🚀

Gold looks ready for a sell off toward 2860Currently, the price of gold is at the Point of Control (POC) level, which suggests that we may see some weakness in the market. Based on my analysis, I expect a pullback towards the 2860 level. This is supported by a Wyckoff distribution pattern that indicates sellers are gaining strength, especially since we've observed a lower high around the 2906 level.
Stay tuned for more updates!

GBPUSD Holds Below 0.618 Fibonacci RetracementFollowing the DXY's decline, the British pound surged back above the trendline connecting lower highs between 2014 to 2021, aligning with a key resistance at the 0.618 Fibonacci retracement of the downtrend between the September 2024 high (1.3434) and the January 2025 low (1.2099) at 1.2945.
Current Market Setup:
RSI on the 3-day time frame is now overbought, aligning with the inverted head and shoulders target formed by the RSI trend near oversold levels, reinforcing reversal potential.
Further downside risks persist, with market sentiment hinging on growth data, trade war developments, and US inflation figures.
Key Levels to Watch:
A decisive close above 1.2850 could pave the way toward 1.3020, 1.3160, and 1.34.
Failure to hold gains could trigger a pullback toward key support zones at 1.28, 1.27, and 1.2570.
Key Events This Week:
US CPI
UK GDP
Trade War Developments
- Razan Hilal, CMT

SHORT ON GBPUSDGBPUSD has reached a key supply area and has given a change of character from up to down on the hour timeframe.
There is plenty imbalance/fvgs to the downside that I expect price to go and fill.
The Dollar Index is currently shifting to up from down, this should aid in this pair falling.
I will be selling GBPUSD to the next demand level for 300 pips.

Will the stock market turn positive again?!The index is trading below the EMA200 and EMA50 on the four-hour timeframe and is trading in its descending channel. If the index moves down towards the specified demand zone, we can look for further buying opportunities in Nasdaq. A break of the resistance range and the channel ceiling will also cause the Nasdaq to continue its short-term upward trend.
In February 2025, the U.S. labor market grew at a slower pace than anticipated. According to published data, non-farm employment increased by 151,000 jobs in January, while expectations were set at 160,000.This indicates that while job growth continues, its momentum has been weaker than projected.
The unemployment rate rose to 4.1% in February, slightly above the expected 4%. Meanwhile, labor force participation declined by 0.2 percentage points to 62.4%. Average hourly earnings increased by 0.3% during the month, aligning with forecasts. On an annual basis, wage growth reached 4%, slightly below the estimated 4.1%.
Among various sectors, the highest job gains were recorded in healthcare (52,000 jobs), finance (21,000 jobs), and local government (20,000 jobs). Employment also rose in construction, transportation, social assistance, and manufacturing.
Conversely, some industries experienced job losses. The hospitality sector shed 16,000 jobs, retail lost 6,000, and the federal government reduced employment by 10,000 positions. Additionally, temporary jobs declined by 12,000, signaling a potential slowdown in economic growth.
Overall, the report suggests that while the U.S. labor market remains stable, certain indicators, such as rising unemployment and a decline in full-time jobs, may point to a deceleration in economic expansion. Following the report’s release, the U.S. dollar weakened slightly, but the market reaction was muted due to prior concerns over a more significant decline.
Hassett, the White House economic advisor, stated that future reports are likely to show further reductions in government employment. He emphasized the administration’s plan to cut government jobs and spending while boosting employment in the manufacturing sector. He also confirmed that tariffs are inevitable, arguing that such measures will support the expected 3% to 4% economic growth. Hassett expressed doubt that President Trump would grant exemptions for steel tariffs.
As investors try to adjust to Trump’s evolving trade policies, the U.S. Consumer Price Index (CPI) report for February is set to be released on Wednesday. Given the recent Personal Consumption Expenditures (PCE) index data from January, it is possible that CPI could be entering a new downward trend.
The Federal Reserve’s battle against inflation remains challenging, and the recent rise in price pressures has undoubtedly been frustrating for policymakers. However, signs indicate that U.S. inflation may be shifting course, with expectations of a decline in the coming months.
One major uncertainty remains: tariffs. Trump’s decision to impose a 25% tariff on Canadian and Mexican imports and a 20% increase on Chinese goods, along with additional sector-specific and retaliatory tariffs still under discussion, could undermine the Fed’s efforts to bring inflation down to 2%.
In January, the overall CPI climbed to 3%, marking its highest level since June 2024. Core inflation also reached 3.3%. However, February’s data is expected to ease months of concern about inflationary resurgence, with projections indicating a decline in overall CPI to 2.9% and core inflation to 3.1%. Monthly estimates for both indices stand at 0.3%.
Later in the week, Thursday’s Producer Price Index (PPI) for February will provide further insights into inflationary pressures, while on Friday, investors will closely monitor the University of Michigan’s preliminary consumer sentiment survey for March. Last month’s survey raised alarms, as consumer inflation expectations climbed to their highest level in 30 years.

XAU/USD (Gold) Trendline Breakout (10.03.2025)The XAU/USD Pair on the M30 timeframe presents a Potential Selling Opportunity due to a recent Formation of a Trendline Breakout Pattern. This suggests a shift in momentum towards the downside in the coming hours.
Possible Short Trade:
Entry: Consider Entering A Short Position around Trendline Of The Pattern.
Target Levels:
1st Support – 2877
2nd Support – 2860
🎁 Please hit the like button and
🎁 Leave a comment to support for My Post !
Your likes and comments are incredibly motivating and will encourage me to share more analysis with you.
Best Regards, KABHI_TA_TRADING
Thank you.

Bearish drop?US Dollar Index (DXY) is rising towards the pivot which has been identified as a pullback resistance and could drop to the 1st support which is an overlap support that aligns with the 161.8% Fibonacci extension.
Pivot: 104.42
1st Support: 102.65
1st Resistance: 105.26
Risk Warning:
Trading Forex and CFDs carries a high level of risk to your capital and you should only trade with money you can afford to lose. Trading Forex and CFDs may not be suitable for all investors, so please ensure that you fully understand the risks involved and seek independent advice if necessary.
Disclaimer:
The above opinions given constitute general market commentary, and do not constitute the opinion or advice of IC Markets or any form of personal or investment advice.
Any opinions, news, research, analyses, prices, other information, or links to third-party sites contained on this website are provided on an "as-is" basis, are intended only to be informative, is not an advice nor a recommendation, nor research, or a record of our trading prices, or an offer of, or solicitation for a transaction in any financial instrument and thus should not be treated as such. The information provided does not involve any specific investment objectives, financial situation and needs of any specific person who may receive it. Please be aware, that past performance is not a reliable indicator of future performance and/or results. Past Performance or Forward-looking scenarios based upon the reasonable beliefs of the third-party provider are not a guarantee of future performance. Actual results may differ materially from those anticipated in forward-looking or past performance statements. IC Markets makes no representation or warranty and assumes no liability as to the accuracy or completeness of the information provided, nor any loss arising from any investment based on a recommendation, forecast or any information supplied by any third-party.

AUD vs DXY: Analysis of Both ChartsWE can see a clean bearish intent on DXY right now so we may be able to get a good long going against the DXY rn 🔑
If we stick to our closes being our guiding light, we will await the close to get our entry after if this bulls take a fib correction into buyside 🎯
Share with a friend 🙏🏾

dxyDXY - U.S Dollar Index
Key Points in this Chart :
1. Change of Characteristics ( CHOCH )
2. Bearish Channel
3. Elliot Waves
4. RSI - Divergence
5. Support / Resistance
DXY|LONG UPDATEHello to everyone checking out this post!
Drop your thoughts in the comments! My outlook on the Dollar Index (DXY) is bullish. I believe it could start its upward move from the current level and continue its rally over the next few weeks. 📈🔥
Let me know what you think! 👇

Gold | Oil | Dollar | Silver | Natural Gas Price ForecastFutures Commodities Forecast | Gold | Oil | Dollar | Silver | Natural Gas Price Forecast
COMEX:GC1! NYMEX:NG1! NYMEX:CL1! COMEX:SI1!

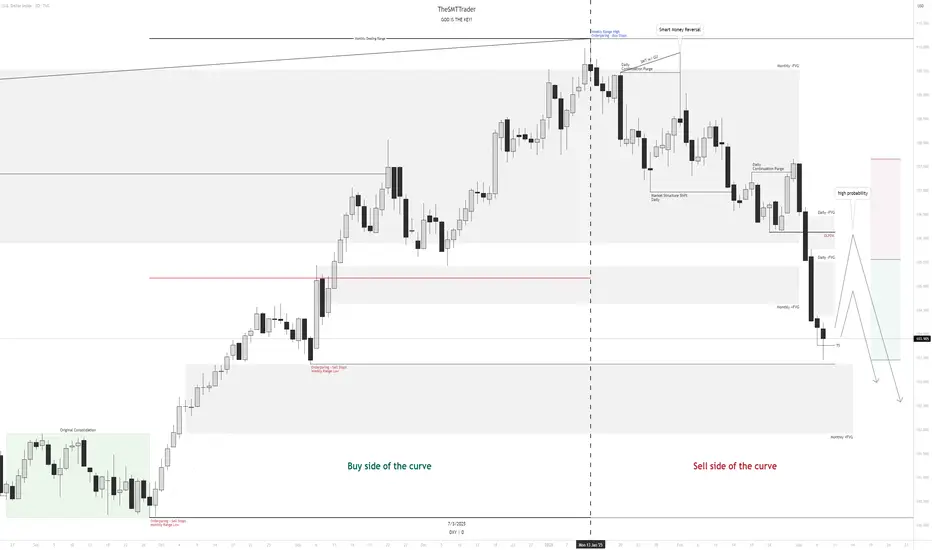
$DXY MMSMIn my view, the DXY could have a bullish bias this week, but only as a correction after last week's sharp drop. The main bias is still bearish, as we are on the sell side of the curve. Therefore, long trades should be approached with caution since the price can reverse to the downside at any moment—after all, the market is sovereign, and only it determines its movements.
I remain firmly bearish until the monthly range lows are taken out. I will only reconsider this outlook if the price holds at a high-timeframe PDA and institutional order flow (IOF) signals a potential shift in direction.
NZDJPY - 2025 Plan. Make It Your Best Year Yet!Here we have the 2 Day chart for NZDJPY.
We've seen a massive impulse mid 2024. We are now in an ABC correction.
We are currently in wave B of the correction, subwave B. Expecting subwave C to complete wave B.
We're looking for a rejection of the fib zone and a drop of over 700pips.
Trade idea:
- Watch for rejection of fib zone
- Once rejection appears, enter with stops above the highs
- Targets: 86 (350pips), 83 (700pips)
Once we've completed this move down, we'll be looking for longs. We'll update this setup if there's enough engagement.
Goodluck and as always, trade safe!
