Skeptic | Weekly Watchlist Top Triggers for Forex, Gold & More!DXY: The Market’s Compass
Let’s kick it off with DXY—the Dollar Index every trader needs to watch to get the market’s big picture.
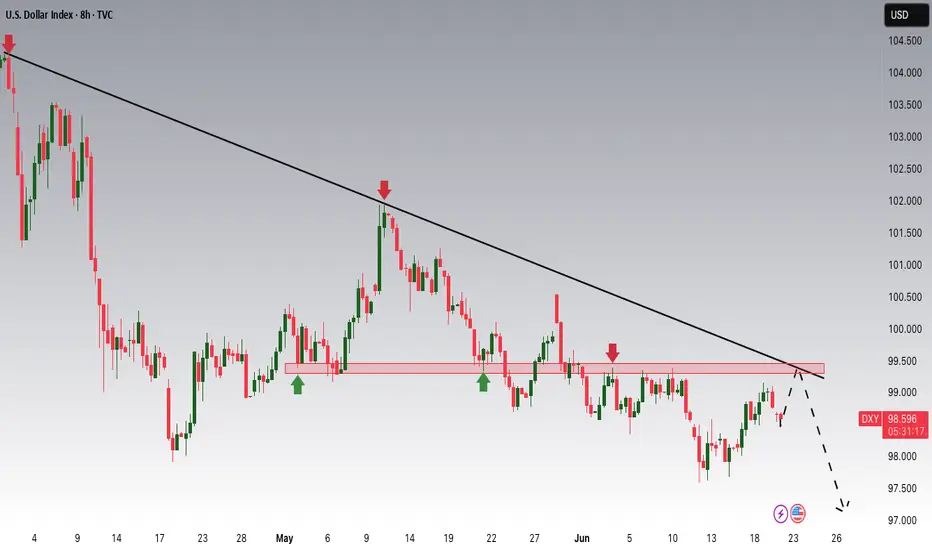
Daily Timeframe: After a failed break below the critical support at 98.801 , DXY dumped to 97.596 , then pulled back to test 98.801 . With rate cuts looking likely soon , I’m betting on more downside for DXY. The only wildcard? Rising Middle East tensions could spike inflation, push rates higher, and strengthen DXY, hammering crypto and CFD indices.
4-Hour Triggers:
Short: Break below 98.530 —a clean setup to ride down to 97.596 . I’m leaning heavier on this, pairing it with USD-based forex trades for max R/R. 😤
Long: Break above 99.114 —riskier against the trend, so keep stops tight and profits quick.
Pro Tip: Shorts are the safer play here, but watch geopolitical news for sudden reversals.
EURX: Uptrend Power
EURX is flexing some muscle.
Weekly Timeframe: The resistance at 1072.6 looks broken. If we avoid a fakeout and hold above this zone, I’m expecting the major uptrend to keep rolling.
Game Plan: No trigger needed—just confirm a few 4-hour candles above 1072.6, and I’m opening longs on EUR-based pairs. Patience for confirmation is key! 🙌
Pro Tip: Watch for fake breakouts—let the market prove itself before jumping in.
Commodities: Gold & Silver
XAU/USD (Gold)
My gold analysis from last week still holds ( check it if you missed it—it’s got Middle East war scenarios and Bitcoin insights too ). No need to repeat—go read it for the full scoop! 📚
XAG/USD (Silver)
Silver’s been on a wild ride after a massive pump.
4-Hour Timeframe : We’re now in a 4-hour range, which makes sense, and I expect it to linger into next week.
Triggers:
Long: Break above resistance at 37.31559 .
Short: Break below support at 35.56800 .
Pro Tip: If you’re holding my 33.68317 long from last week, don’t close yet—let it ride for more gains. If you’re not in, avoid FOMO and wait for the range break. 😎
Forex Pairs
EUR/USD: Ready to Pop
With EURX in an uptrend and DXY likely breaking support, I’m super bullish on EUR/USD next week.
4-Hour Triggers:
Long: Break above resistance at 1.15429 . No need for RSI or SMA confirmation—just a clean breakout, and we’re in. 🚀
Short: Break below 1.13566—only if EURX’s 1072.6 break turns out to be a fakeout.
Pro Tip: Longs are the play here—keep it simple and ride the breakout wave.
GBP/USD: Bearish Break
GBP/USD is looking spicy after a downward move.
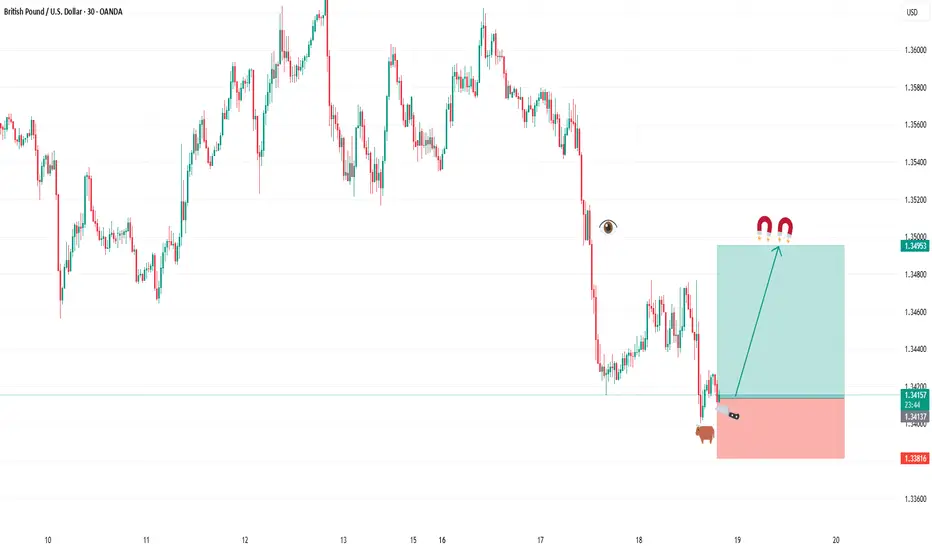
Daily Timeframe: The upward channel broke to the downside. I cloned the channel and placed it below—support at 1.34090 is massive, with multiple reactions in the past.
4-Hour Trigger: Break below 1.34090 opens a bearish move with high R/R. I’m personally shorting this break. 😤
Pro Tip: This is a key level—set alerts and don’t miss it!
USD/JPY: Range Game
USD/JPY is stuck in a long 4-hour box range.
4-Hour Timeframe: Price keeps testing the ceiling but travels less toward the floor, showing traders want to break up, not down.
Triggers:
Long: Break above ceiling at 146.204.
Short: Break below the upward trendline, then support at 145.194 .
Pro Tip: Longs have more juice—watch for volume on the break.
EUR/CHF: Mirror of USD/JPY
EUR/CHF is vibing like USD/JPY—a 4-hour box range.
4-Hour Triggers:
Long: Break above resistance at 0.94293 .
Short: Break below channel floor at 0.92963 .
Pro Tip: Wait for a clean break—ranges can be choppy!
Final Vibe Check
That’s your Weekly Watchlist , fam! I’ll keep you updated daily as markets shift. Stay safe with capital management—max 1% risk per trade, no excuses. This week’s loaded with banger triggers, so sit down now, analyze, and set your alerts so you don’t miss a single move. Let’s make it a profitable week! 🚨
💬 Let’s Talk!
If this watchlist got you hyped, smash that boost—it means the world! 😊 Got a pair or setup you want me to hit next? Drop it in the comments. Thanks for rolling with me—keep trading sharp! ✌️
J-DXY

Forex and Gold Market Highlights June 21 2025Forex & Gold Market Highlights – June 21, 2025
🕒 Key Events This Week:
• 🏦 Fed officials signaling possible rate cuts vs. cautious economic tone
• 🌍 Escalating Israel–Iran tensions boosting safe-haven flows
• 🏭 Mixed U.S. macro data (retail sales, Philly Fed, housing) shaping Fed expectations
________________________________________
💶 EUR/USD Nears 1.1520 on Safe-Haven Flows
EUR/USD edged up to about 1.1520 amid weakness in the U.S. dollar, driven by global risk-off sentiment. Mixed signals from the Fed kept traders cautious.
________________________________________
💷 GBP/USD Hovering Around 1.3500 on USD Strength
GBP/USD remains near 1.3500, slipping slightly off highs after weaker UK retail data. The pair faces resistance in the 1.3550–1.3600 zone.
________________________________________
💴 USD/JPY Eyeballing 146 Resistance
USD/JPY climbed toward 146.00, driven by risk-averse USD demand and dovish BOJ stance. The pair is testing key retracement resistance near 146.76.
________________________________________
🥇 Gold Pulls Back but Holds Ground
Spot gold slid to around $3,334 3,381 this week, under pressure from a stronger dollar and diminished Fed rate-cut hopes. Still, geopolitical jitters kept it from falling hard.
• Weekly drop of ~2.5%, trading in a $3,330–$3,400 range.
________________________________________
📈 DXY Index Rallies on Risk Aversion
The U.S. Dollar Index rose ~0.45%, marking its strongest weekly gain in over a month due to heightened safe-haven flows amid Middle East tensions.
________________________________________
📌 Market Outlook:
• EUR/USD: Mixed bias. May test 1.1550–1.1600 if risk-off continues; downside risk near 1.1400 if U.S. data surprises.
• GBP/USD: Expected to stay in the 1.3450–1.3550 range; UK economic data and USD momentum will be key.
• USD/JPY: Bullish tilt remains toward 146.76, but any BOJ hints of policy tightening could shake it.
• Gold: Pressure from a firm dollar is likely to persist. Watch for geopolitical developments and upcoming Fed signals for reversal clues.

EUR/USD - H4 - Triangle Formation (31.05.2025)The EUR/USD pair on the H4 timeframe presents a recent Formation of a Triangle Pattern.
1. Wait for Breakout with Good Volume
2. Conformation in short Timeframe Must
🎁 Please hit the like button and
🎁 Leave a comment to support for My Post !
Fundamental Updates :
Dollar mixed on tariff uncertainty, U.S. President Donald Trump to battle a U.S. trade court ruling that blocked most of his proposed tariffs.
Your likes and comments are incredibly motivating and will encourage me to share more analysis with you.
Best Regards, KABHI_TA_TRADING
Thank you.
Disclosure: I am part of Trade Nation's Influencer program and receive a monthly fee for using their TradingView charts in my analysis.

Gold Ready to Shine Again? Watch This Battle Zone Closely!Gold is consolidating above the 50% retracement (3372) after defending key structure at 3368–3378. Bullish momentum is building as Silver continues to lead, and the US Dollar (DXY) weakens post-FOMC. If buyers step in here, we could see a clean breakout toward 3415–3450 and beyond. But if 3368 breaks, the bull case is temporarily invalidated.
🧭 Technical Highlights:
✅ Support Zone: 3368–3378 (Fibonacci + bullish order block)
✅ Resistance Targets: 3395, 3415.84, 3451.84, 3470+
🔄 Silver Divergence: XAGUSD broke higher → leading XAU bullishly
🔼 Bias: Bullish (as long as 3368 holds)
🌐 Fundamental Drivers:
🏦 Fed dot plot turns dovish – Only 1–2 cuts, but no hikes planned; supports gold upside.
⚔️ Middle East tensions rising – Iran vs. Israel/US rhetoric keeps risk premium high.
📉 DXY weakens after Powell avoided hawkish tone; real yields remain capped.
💬 Silver outperforming on safe-haven + industrial hedge flows.
💡 Trading Plan Summary:
Buy Zone: 3372–3380
TP Zones: 3395, 3415, 3450+
Invalidation: Close below 3368
Confirmation: Break and close above 3395 with volume = signal to scale in
🔔 Keep an eye on:
US Jobless Claims, SNB & BoE Decisions
DXY 98.70 key level
Silver reaction near 36.70–37.20

DXY Potential DownsidesHey Traders, in today's trading session we are monitoring DXY for a selling opportunity around 99.300 zone, DXY is trading in a downtrend and currently is in a correction phase in which it is approaching the trend at 99.300 support and resistance area.
Trade safe, Joe.
BUY CABLEIn todays session we are monitoring GBPUSD for bullish opportunities. Our buy entry is at 1.34120 and stops are below 1.3380 our target is 1.3500. Use proper risk management and best of luck. Cheers
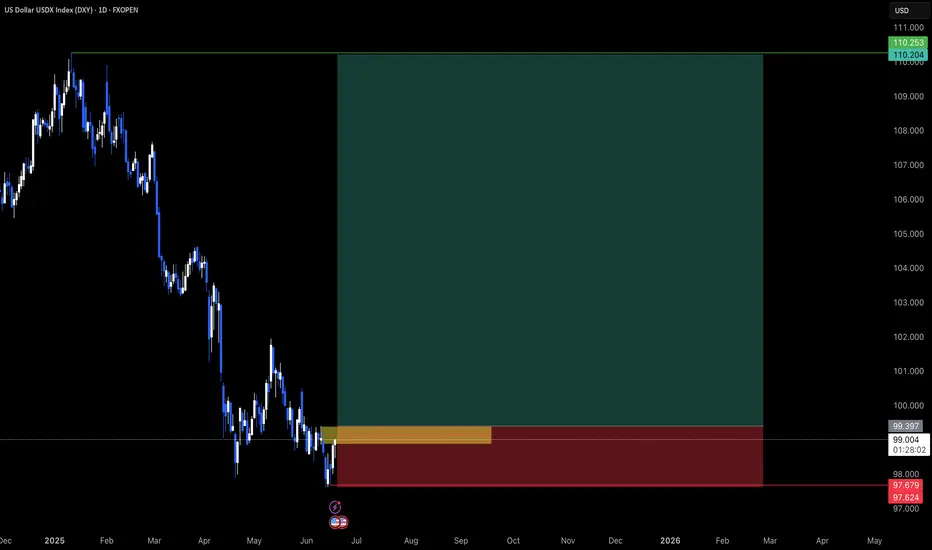
DXY Eyes Key Long-Term Support from 2008The U.S. Dollar Index (DXY) is currently trading near three-year lows, reflecting concerns over economic fragility and heightened geopolitical tensions.
If price action holds below 97, the DXY could face additional pressure, potentially descending toward the lower boundary of a long-term channel that has held since the 2008 lows. Key support levels at 96 and 94 may offer potential rebound zones.
Monthly RSI reflects more downside potential towards oversold conditions last seen in 2021. To reverse the current bearish momentum, the index would need to regain and hold above the 100-mark, which could shift sentiment back toward a bullish rebound outlook against the markets.
- Razan Hilal, CMT

GBPJPY I Expect a Rally from the Buy Zone in the 1H Time FrameDescription:
I'm viewing the 195.116–194.845 range on GBPJPY as a strong buy zone. My target is 196.088. Once the trade setup becomes active or the target is reached, I’ll be sharing an update here. Stay tuned!
I meticulously prepare these analyses for you, and I sincerely appreciate your support through likes. Every like from you is my biggest motivation to continue sharing my analyses.
I’m truly grateful for each of you—love to all my followers💙💙💙

DXY US DOLLAR INDEXAs we can see on the chart, there’s a clear pattern emerging. The current movement of the index closely resembles the price action we saw between April 2015 and August 2018.
Assuming this fractal continues to play out, we could see more sideways movement until the end of the year — before a potential trend reversal kicks in.

Holiday yesterday so no play! can we get it today?As we get ready to close out the week we are looking for the reversal to play out. We have been in a casual consolidation all week. Just looking for price to step outside of value one more time so that we can get a entry for it to continue pushing bullish.

Bullish bounce?US Dollar Index (DXY) is falling towards the pivot and could bounce to the 1st resistance.
Pivot: 98.48
1st Support: 97.62
1st Resistance: 99.47
Risk Warning:
Trading Forex and CFDs carries a high level of risk to your capital and you should only trade with money you can afford to lose. Trading Forex and CFDs may not be suitable for all investors, so please ensure that you fully understand the risks involved and seek independent advice if necessary.
Disclaimer:
The above opinions given constitute general market commentary, and do not constitute the opinion or advice of IC Markets or any form of personal or investment advice.
Any opinions, news, research, analyses, prices, other information, or links to third-party sites contained on this website are provided on an "as-is" basis, are intended only to be informative, is not an advice nor a recommendation, nor research, or a record of our trading prices, or an offer of, or solicitation for a transaction in any financial instrument and thus should not be treated as such. The information provided does not involve any specific investment objectives, financial situation and needs of any specific person who may receive it. Please be aware, that past performance is not a reliable indicator of future performance and/or results. Past Performance or Forward-looking scenarios based upon the reasonable beliefs of the third-party provider are not a guarantee of future performance. Actual results may differ materially from those anticipated in forward-looking or past performance statements. IC Markets makes no representation or warranty and assumes no liability as to the accuracy or completeness of the information provided, nor any loss arising from any investment based on a recommendation, forecast or any information supplied by any third-party.

GOLD - WAVE 5 BULLISH TO $3,622 (UPDATE)Like I said on the last update, Gold is currently going through a strong 'accumulation' phase for buyers, hence why we're seeing these choppy price actions, trying to liquidate buyers.
As long as Gold is ABOVE THE WAVE 2 LOW, market structure still favours buyers. Breaking below this low, will invalidate bullish structure.
Wave 2 Invalidation Level - $3,245❌

EURUSD +3% Trade Recap 17th June 2025A short position taken on EURUSD for +3%, full explanation as to why I executed on this position and made the decision to manually close at the level I did.
Any questions you have just drop them below 👇

SHORT ON USD/CADUSD/CAD has given a confirmation choc (change of character) from up to down on the lower timeframe (5min) from a MAJOR supply area.
I will be selling USD/CAD looking to make over 100 pips to the next demand level.

Dow Jones Potential UpsidesHey Traders, in today's trading session we are monitoring US30 for a buying opportunity around 41,900 zone, US30 is trading in an uptrend and currently is in a correction phase in which it is approaching the trend at 41,900 support and resistance area.
Trade safe, Joe.

AUDUSD Potential UpsidesHey Traders, in today's trading session we are monitoring AUDUSD for a buying opportunity around 0.64600 zone, AUDUSD is trading in an uptrend and currently is in a correction phase in which it is approaching the trend at 0.64600 support and resistance area.
Trade safe, Joe.

GBP/USD - For FOMC & Fed Interest RateThe GBP/USD pair on the M30 timeframe presents a Potential Buying Opportunity due to a recent Formation of a Channel Pattern. This suggests a shift in momentum towards the upside and a higher likelihood of further advances in the coming hours.
Possible Long Trade:
Entry: Consider Entering A Long Position around Trendline Of The Pattern.
Target Levels:
1st Resistance – 1.3567
2nd Resistance – 1.3682
🎁 Please hit the like button and
🎁 Leave a comment to support for My Post !
Your likes and comments are incredibly motivating and will encourage me to share more analysis with you.
Best Regards, KABHI_TA_TRADING
Thank you.
Disclosure: I am part of Trade Nation's Influencer program and receive a monthly fee for using their TradingView charts in my analysis.

DXY – U.S. Dollar Faces Downside RiskAfter a period of strength driven by its safe-haven appeal, the DXY is showing signs of weakness as doubts emerge over the true resilience of the U.S. economy. Recent data — including retail sales, industrial production, and consumer sentiment — have all fallen short of expectations, raising the likelihood that the Fed may pivot to a more dovish stance sooner than anticipated.
As a market analyst closely monitoring capital flows, I believe the dollar is gradually losing its edge. With risk appetite improving and capital rotating into the euro and other risk assets, the DXY is likely to remain under pressure in the near term.
Current outlook: Bearish bias, especially if the Fed softens its tone and weak U.S. data persists.
The market is waiting for confirmation — but the pressure is already building.

Gold Finally Swept the Lows!!!!Waited for this all damn day and it didnt happen till just before the day closed. Now looking for the action to continue. If they give signs before the killzone then its a go going into London session.

USDCHF OUTLOOK - SWING SETUPExpecting a bullish dollar in the next few months, which in turn will be bullish for USDCHF.
Note: ****I forgot to publish/share the trade setup after annotation.
"May fortune attend thee, and thy trade prosper." .......L2Earned

DXY OUTLOOK - SWING SETUPThe dollar has been on a six-month decline, but I anticipate a recovery. This is primarily due to the current economic climate, geopolitical landscape, and the dollar's traditional role as a safe-haven currency during periods of significant uncertainty
"May fortune attend thee, and thy trade prosper." .......L2Earned
$USINTR -Fed Keeps Rates Uncut (June/2025)ECONOMICS:USINTR
June/2025
source: Federal Reserve
- The Federal Reserve left the federal funds rate unchanged at 4.25%–4.50% for a fourth consecutive meeting in June 2025, in line with expectations, as policymakers take a cautious stance to fully evaluate the economic impact of President Trump’s policies, particularly those related to tariffs, immigration, and taxation. However, officials are still pricing in two rate cuts this year.

EURUSD - Getting Over-Bought?Hello TradingView Family / Fellow Traders. This is Richard, also known as theSignalyst.
📈EURUSD has been overall bullish trading within the rising channels marked in red and blue. However, it is currently retesting the upper bound of the channels.
Moreover, the orange zone is a major daily high.
🏹 Thus, the highlighted red circle is a strong area to look for sell setups as it is the intersection of the upper blue/red trendlines and daily high.
📚 As per my trading style:
As #EURUSD approaches the red circle zone, I will be looking for bearish reversal setups (like a double top pattern, trendline break , and so on...)
📚 Always follow your trading plan regarding entry, risk management, and trade management.
Good luck!
All Strategies Are Good; If Managed Properly!
~Rich
Disclosure: I am part of Trade Nation's Influencer program and receive a monthly fee for using their TradingView charts in my analysis.
