EURUSDHello Traders! 👋
What are your thoughts on EURUSD?
EURUSD has finally broken through the resistance level that had been holding it back for several weeks and is now trading above it.
At this stage, we anticipate a pullback to the broken level, followed by a continuation of the upward move toward the next target.
Don’t forget to like and share your thoughts in the comments! ❤️
J-DXY

3.6 Technical Analysis of Short-term Gold OperationsThe US ADP employment data for February fell sharply. The market expected 140,000, but only 70,000 were released last night, which was cut in half. This data is not surprising. Since Musk established the efficiency department at the oval table on January 20, a large number of government employees have been reduced, and the reduction in employment is reasonable.
However, the consensus is that the number of employed people will decrease, which is good for gold, and washing the market has become a routine operation. After the data was released, gold not only did not rise, but fell rapidly, all the way to $2,894, and it seemed that it was about to fall by a waterfall. At that time, I said internally that we should be careful of the double kill of longs and shorts, but it was pulled back to above $2,920 in the late trading.
In 1 hour, the US market quickly returned to the top and bottom conversion of $2,894 last night. After this retracement, it was pulled up again, indicating that the market bulls are still dominant, but the current market is still dominated by fluctuations, not a unilateral rise, so try to avoid chasing more and wait for the decline before intervening.
Today, the dividing point is still 2895-2900. We will continue to go long after the pullback. The upper target is 2920-2935 US dollars. The US dollar has begun to weaken. Gold is just in the process of brewing. The single negative on the weekly line does not form a stage top.

DXY on high time frame
"Hello traders, focusing on DXY on high time frames, as per my previous analysis, the price has shifted towards a bearish direction. The price has reached the 110 zone, and candle formations are indicating a downtrend. I anticipate further pullback towards the 108 zone and potentially lower prices thereafter."
If you have any specific questions or need further assistance with your message, feel free to let me know!

DXY Will Grow! Long!
Take a look at our analysis for DXY.
Time Frame: 17h
Current Trend: Bullish
Sentiment: Oversold (based on 7-period RSI)
Forecast: Bullish
The market is testing a major horizontal structure 104.192.
Taking into consideration the structure & trend analysis, I believe that the market will reach 106.217 level soon.
P.S
Please, note that an oversold/overbought condition can last for a long time, and therefore being oversold/overbought doesn't mean a price rally will come soon, or at all.
Like and subscribe and comment my ideas if you enjoy them!

EUR/USD on high time frame It's a good opportunity to buy EUR/USD on high time frame , base on my strategy EUR is in bullish trend ,
EUR USD buy position ,
Tp: 1/090
St : 1/030

US Dollar Index Short Term Sell IdeaH4 - Strong bearish momentum
Lower lows
Until the two strong resistance zones hold my short term view remains bearish here.

XAGUSD - Silver on the rise?!Silver is above the EMA200 and EMA50 on the 4-hour timeframe and is moving within its medium-term descending channel. If a valid trendline break or bullish correction is observed, silver can be re-sold and followed to the specified support level.
Looking ahead, analysts predict that rising economic uncertainty will drive stronger investment demand in Western markets. In recent weeks, consumer sentiment has dropped to its lowest level in years, while concerns over inflation have intensified.
Experts argue that stagflation provides an ideal environment for gold, as the precious metal is widely regarded as a safe-haven asset during economic instability.Additionally, higher inflation leads to lower real yields, reducing the opportunity cost of holding gold, which does not generate interest.
Major investment firms, including WisdomTree and Goldman Sachs, believe that despite the possibility of short-term corrections, gold remains on track to reach $3,000 per ounce this year.
In another indication of investor sentiment, analysts at BMO Capital Markets reported that gold and copper were the most discussed commodities at their exclusive mining industry conference. Interestingly, silver ranked as a “distant third” in terms of interest. While downside risks for gold still exist, focusing on the long-term outlook remains crucial.
Daniel Ghali, a senior commodities strategist at TD Securities, stated that gold is in a unique position where it can appreciate regardless of the U.S. dollar’s performance. Meanwhile, silver’s physical supply flows and structural deficit could make it a long-term winner in the market. Ghali also noted that even as Washington considers devaluing the U.S. dollar to enhance export competitiveness, the currency’s strength is actually supporting higher gold prices.
He remarked, “What’s fascinating about this gold rally is that, contrary to conventional wisdom, I genuinely believe a strong U.S. dollar has contributed to gold’s price increase.” He added, “One of my core beliefs is that market anomalies can teach us invaluable lessons.”
According to Ghali, gold’s exceptional performance last year was highly unusual. He explained, “Gold managed to rally even during periods of rising U.S. interest rates and a strong dollar.” He also pointed out that historically, gold has only twice exhibited such strong performance alongside a robust S&P 500 index. The first instance was in 1933, when the U.S. government revalued gold, and the second occurred in 2009, during the most significant round of quantitative easing (QE) policies.
He emphasized that gold has never sustained such a strong uptrend without a concurrent bearish market for the U.S. dollar. Ghali concluded, “Clearly, gold’s price strength represents a market anomaly, and I believe this sends a message to those willing to listen.”
Regarding silver, Ghali argued that the metal is no longer seen as a lesser counterpart to gold. He said, “Silver has a truly unique narrative. We are now entering the fifth consecutive year of a structural deficit. The imbalance between supply and demand is unprecedented, primarily driven by surging demand, particularly in the global solar energy sector.”
He continued, “Silver’s situation is different because we are transitioning from a demand surge to a liquidity crisis. The physical pull of silver from London to the U.S. has been so intense that it has placed enormous strain on the world’s largest bullion storage system, disrupting daily physical market trading.” He added, “We believe this situation could worsen, ultimately requiring higher silver prices to incentivize the return of supply from unconventional sources to London.”

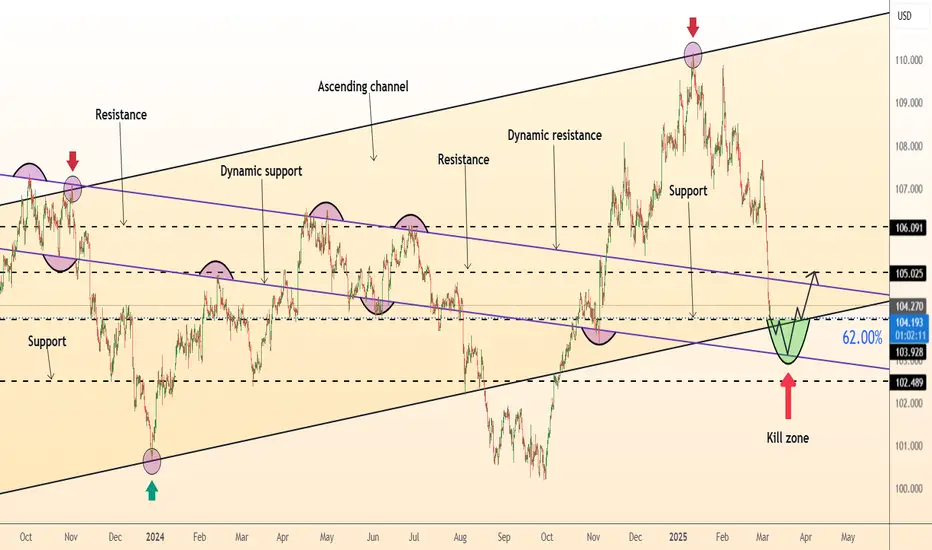
DeGRAM | DXY retest of channel boundaryThe DXY is in an ascending channel between trend lines.
The price has approached the lower boundary of the channel and the support level coinciding with the 62% retracement level, but has not yet reached the lower trend line.
On the 4H Timeframe, the indicators are in the oversold zone and on the 1H they have formed a bullish convergence.
We expect a rebound.
-------------------
Share your opinion in the comments and support the idea with like. Thanks for your support!
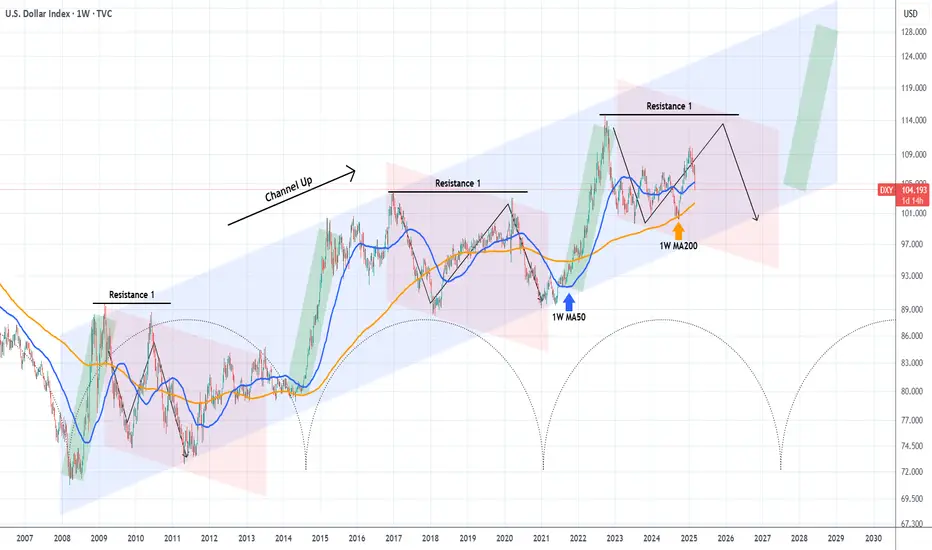
DXY looking for a final push higher before collapse.The U.S. Dollar index (DXY) has been on a strong decline recently, having even broken below its 1W MA50 (blue trend-line).
The multi-year trend is however bullish, a Channel Up pattern since the 2008 market bottom. With the use of the time Cycles tool, we can estimate when the next Bullish Leg starts, and that's not before 2027.
Based on the previous Channel Up corrections (red Channels) we should be expecting one final push towards Resistance 1, before a long-term decline and completion of the Bearish Leg.
As a result, as long as the 1W MA200 (orange trend-line) holds, we can take a low risk buy and target the 112.000 - 114.000 Zone.
-------------------------------------------------------------------------------
** Please LIKE 👍, FOLLOW ✅, SHARE 🙌 and COMMENT ✍ if you enjoy this idea! Also share your ideas and charts in the comments section below! This is best way to keep it relevant, support us, keep the content here free and allow the idea to reach as many people as possible. **
-------------------------------------------------------------------------------
💸💸💸💸💸💸
👇 👇 👇 👇 👇 👇
GBPUSD - Dollar’s view on jobs data!The GBPUSD pair is above the EMA200 and EMA50 on the 4-hour timeframe and is moving in its ascending channel. In case of a downward correction, the pair can be sold to narrow it.
Last week ended with an unexpected shock for economists: estimates pointed to a significant trade imbalance in the United States for January, primarily driven by a sharp surge in imports. The data indicated that U.S. businesses had made extensive efforts to ramp up foreign purchases ahead of the imposition of new tariffs. Economic analysts expressed concerns that this trend could negatively impact U.S. GDP growth in the first quarter of 2025, as increased imports are typically subtracted from gross domestic product calculations.
However, Goldman Sachs experts presented a different perspective. They argue that the unexpected surge in imports was mainly due to an influx of gold bars into the U.S.—a trend that reflects the dynamics of the global precious metals market and the price disparity between gold in London and New York.
According to data cited by Goldman Sachs, the U.S. imported approximately $25 billion worth of gold in January, meaning that a substantial portion of the commodity trade deficit was driven by gold transactions. Since gold is generally considered a financial asset, these imports are not factored into GDP calculations.
As a result, the actual economic impact of this growing trade deficit may be significantly lower than initially perceived.
Currently, financial markets anticipate a 77-basis-point rate cut by the Federal Reserve this year. However, this expectation largely hinges on the trajectory of inflation. At the same time, uncertainty surrounding tariff policies remains high.
A new report from the New York Federal Reserve indicates that inflation expectations among businesses have risen. According to the report, projected inflation for the next year has increased from 3% to 3.5% among manufacturing firms and from 3% to 4% among service-based companies. Additionally, many businesses foresee a significant rise in operational costs in 2025.
Meanwhile, market pricing suggests that traders no longer expect the Bank of England to implement two rate cuts this year. Taylor, a member of the central bank, stated that every policy meeting carries great importance. He noted that the output gap—the difference between actual and potential production—may be larger than previous Bank of England estimates. Taylor emphasized that monetary policies should gradually return to normal and that a cautious approach is necessary when dealing with multiple price shocks.
Furthermore, Andrew Bailey, Governor of the Bank of England, stressed that the economic outlook remains uncertain, with risks moving in both directions. He stated that while inflation is expected to rise, it will not resemble the severe inflationary periods of recent years. According to Bailey, decisions on rate cuts will depend on inflation trends, which have so far remained within an acceptable range. He also noted that the likelihood of second-round inflationary effects—where slowing economic growth leads to renewed price pressures—has diminished.

USD Index Drops Sharply – Watching for Reversal SignalsSo far, it has been a rough week for the USD, with the index dropping from the 107 zone to 104 and breaking below the key 106 support level.
However, the DXY is currently seated on strong support, and a relief rally could be imminent.
I’m closely watching for signs of a reversal for confirmation while keeping an eye for short trades on EUR/USD and GBP/USD.

DXY DXY has moved in the great downward channel since its inception. Locally, the index may rise to the resistance line. Eventually, I expect it will achieve its lows during the 20s.
Best regards EXCAVO

DXY will go first to 95 and then 86.Hi, another dollar index DXY chart today.
You can make many predictions about how the world will be in the future, I have all just cycles + structures and charts.
At this point, that opinion may not be in line with those policy statements by world leaders. But we're not here to discuss politics.
Best regards EXCAVO

Euro/Usd (Mar/06) for rest of the weekHello eveyone.
as you can see price at golden pocket (high to low).alos near cpr Monthly R3 .
I know it's scary to sell at thi moment but this is what i see in chart.
......................................
( This is an idea and entry-tp-sl placed for my own trade , you can change entry-tp-sl depends on your risk management )

XAU/USD Bullish Flag (06.03.25)The XAU/USD pair on the M30 timeframe presents a Potential Buying Opportunity due to a recent Formation of a Bullish Flag Pattern. This suggests a shift in momentum towards the upside and a higher likelihood of further advances in the coming hours.
Possible Long Trade:
Entry: Consider Entering A Long Position around Trendline Of The Pattern.
Target Levels:
1st Resistance – 2949
2nd Resistance – 2969
🎁 Please hit the like button and
🎁 Leave a comment to support for My Post !
Your likes and comments are incredibly motivating and will encourage me to share more analysis with you.
Best Regards, KABHI_TA_TRADING
Thank you.

Remaining Bullish on Goldyesterday was the Non Farm Payroll news. Price stalled till it was time for news then pulled back to fill in a H4 Gap. Now I'm looking for price to continue bullish. There is not Area that they did not fill in so I'm thinking they might just come out the gate running soon as we are inside of the killzone. waiting for the killzone is the key though.

DXY + 10Y TANKING = BULL MARKETAs expected, the DXY is TANKING alongside the 10Y, and the WMA9 is finally breaking below the 20.
This combo is turbo juice for markets, as it allows Central Banks around the world to stimulate and opens the door for more growth in the US economy.
Ignore asset prices.
Focus on the macro.
This is a leading indicator.
HODL.

DXY (Bitcoin - Alt Season - Bullish) everyone suddenly started posting DXY chart so I figured I should give my 2 cents on it as well.
People are finding hopes in DXY but main charts are still BTC.D and USDT.D
Monthly Chart has the whole picture
Weekly Chart (above) is what interests us
Breaking that Green Macro Trendline will be the 1st step towards success!
remember how yesterday everyone and their mothers were bearish except me?
This drama will continue, ignore the noise...

Gold 1H Intra-Day Chart 05.03.2025As it's a new monthly candle, Gold needs some upside LQ before it can carry on dropping. Right now my bias is;
Option 1: Gold pushes higher, from current market price towards $2,900.

Review and plan for 6th March 2025 Nifty future and banknifty future analysis and intraday plan.
dxy, few stocks analysed.
This video is for information/education purpose only. you are 100% responsible for any actions you take by reading/viewing this post.
please consult your financial advisor before taking any action.
----Vinaykumar hiremath, CMT

US DOLLAR Approaching Key Support – Will Buyers Step In?TVC:DXY is approaching a key support level, highlighted by strong buying interest. This area aligns with a trendline support level, increasing the likelihood of a bullish bounce if buyers step in.
If the price confirms support within this zone through bullish price action—such as long lower wicks or bullish engulfing candles—we could see a reversal toward 106.200, a logical target based on previous market structure and price behavior.
However, if the price breaks below this support zone and sustains, the bullish outlook would be invalidated, potentially leading to further downside.
Just my take on support and resistance zones—not financial advice. Always confirm your setups and trade with solid risk management.
Best of luck!


USDJPY | 1H | BUYSIGNAL ALERT
BUY USDJPY / 148,901 OR 149,00
🟢TP1: 149,265
🟢TP2: 149,776
🟢TP3: 151,000
🔴SL: 147,966
RISK REWARD - 2,00
My friends, Thanks to everyone who supports my analysis with likes.🚀
