USDCHF → Retesting resistance will lead to a declineFX:USDCHF , having failed to reach its global target after breaking through support, is turning back to retest the zone of interest at 0.8157. A fall in the dollar could trigger a decline in prices...
After breaking through support and falling to 0.8055, a correction is forming towards the zone of interest and liquidity at 0.8157. After reaching the local target, the price may return to the global target (liquidity zone) at 0.8042.
The dollar returned to its downward phase at the opening of the session, to which the forex market reacted accordingly. Most likely, bearish pressure may also affect the USDCHF currency pair, which continues to follow the downward trend.
Resistance levels: 0.8157
Support levels: 0.8055, 0.8042
A retest of resistance amid high volatility could form a false breakout (liquidity capture) before the decline continues within the downtrend.
Best regards, R. Linda!
J-DXY

Could the DXY reverse from here?The price is reacting off the pivot and could rise to the 1st resistance which is an overlap resistance.
Pivot: 97.71
1st Support: 94.66
1st Resistance: 101.87
Risk Warning:
Trading Forex and CFDs carries a high level of risk to your capital and you should only trade with money you can afford to lose. Trading Forex and CFDs may not be suitable for all investors, so please ensure that you fully understand the risks involved and seek independent advice if necessary.
Disclaimer:
The above opinions given constitute general market commentary, and do not constitute the opinion or advice of IC Markets or any form of personal or investment advice.
Any opinions, news, research, analyses, prices, other information, or links to third-party sites contained on this website are provided on an "as-is" basis, are intended only to be informative, is not an advice nor a recommendation, nor research, or a record of our trading prices, or an offer of, or solicitation for a transaction in any financial instrument and thus should not be treated as such. The information provided does not involve any specific investment objectives, financial situation and needs of any specific person who may receive it. Please be aware, that past performance is not a reliable indicator of future performance and/or results. Past Performance or Forward-looking scenarios based upon the reasonable beliefs of the third-party provider are not a guarantee of future performance. Actual results may differ materially from those anticipated in forward-looking or past performance statements. IC Markets makes no representation or warranty and assumes no liability as to the accuracy or completeness of the information provided, nor any loss arising from any investment based on a recommendation, forecast or any information supplied by any third-party.

DXYWe are expecting DXY to give us bullishness in this week first.
Disclosure: We are part of Trade Nation's Influencer program and receive a monthly fee for using their TradingView charts in our analysis.

Global Activities are looking to Push Gold bullishWaiting to see a full on break out before confirming its going to be bullish for the week but it sure does look like that's what its going to be for the next few days. Just be patient and wait for price to confirm.

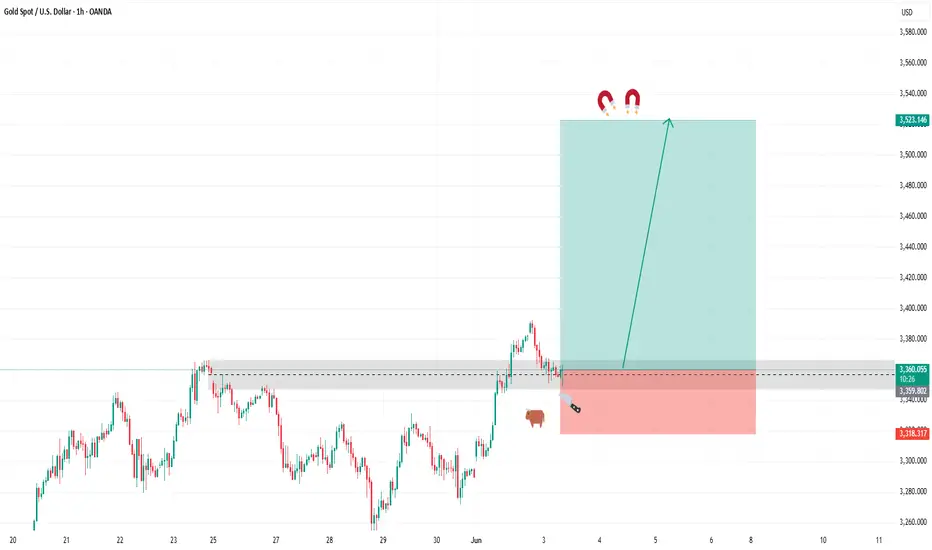
BULLISH GOLDIn todays session we are adding more buys to our initial bias on bullish gold heading for new highs. Our entry is at 3360.84 tp new highs of 3523.15 and stop for this one is 3318. Adjust your positions according to your risk management. Use proper money management. Best of luck
BTC update!!Good day traders, here is another update on BTC and I have adjusted my narrative but my overall bias is still remaining bearish…

Natural Gas | Oil | Dollar | Silver | Gold Price Forecast.Natural Gas | Oil | Dollar | Silver | Gold Price Forecast.
COMEX:SI1! COMEX:GC1! NYMEX:CL1! AMEX:UNG

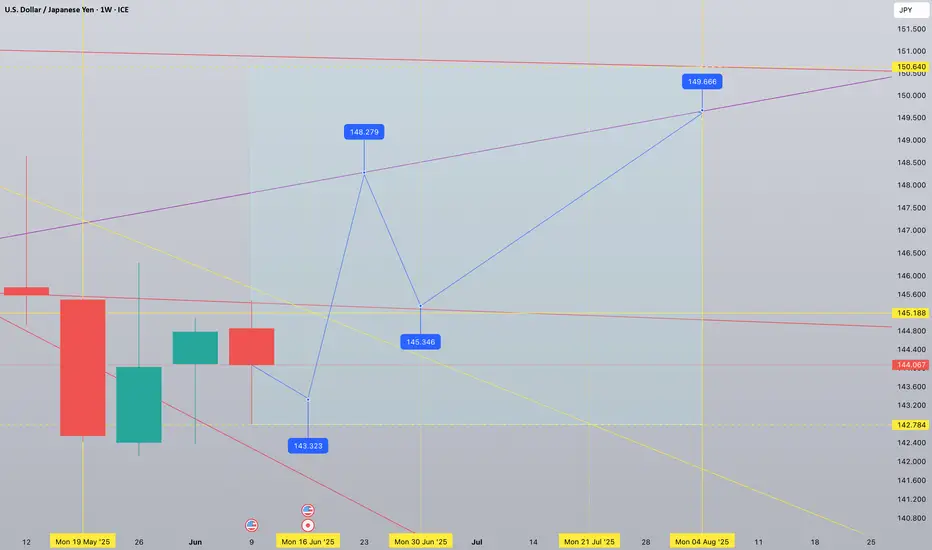
USDJPY 1W forecast until September 2025A huge inverted Head&Shoulders has been started. Volatility chop-chop. Left shoulder is ready and the price is heading up to the base at 145.188
In the middle of June we will see a fast fall to print Head bottoming at 138.75
Before printing Right shoulder the price has to visit the base again in the beginning of August 2025
What will happen in September? I will keep posting and updating (if I see necessity) 1W chart here. For 1D weekly updates check 'Also on' in my Profile.

USDJPY 1W tf forecast until August 2025 Current midterm bias is bullish. 150,64 and 142,78 are extreme levels to be respected by the price action. One more week of red week of sideways movement will actually form a reversal pattern followed by a strong upward spike. A powerful breakout to 148,27 is to be retested at 145,34 - healthy retest. July will show an organic growth topping at 149.66 in the beginning of August 2025
DXY: Local Bullish Bias! Long!
My dear friends,
Today we will analyse DXY together☺️
The market is at an inflection zone and price has now reached an area around 97.757 where previous reversals or breakouts have occurred.And a price reaction that we are seeing on multiple timeframes here could signal the next move up so we can enter on confirmation, and target the next key level of 97.970.Stop-loss is recommended beyond the inflection zone.
❤️Sending you lots of Love and Hugs❤️

DOLLAR INDEX (DXY): Bearish Again?!
Dollar Index leaves clear bearish clues after a test
of a significant intraday/daily supply area.
I think that the market will continue falling at reach at least 98.04 level.
❤️Please, support my work with like, thank you!❤️

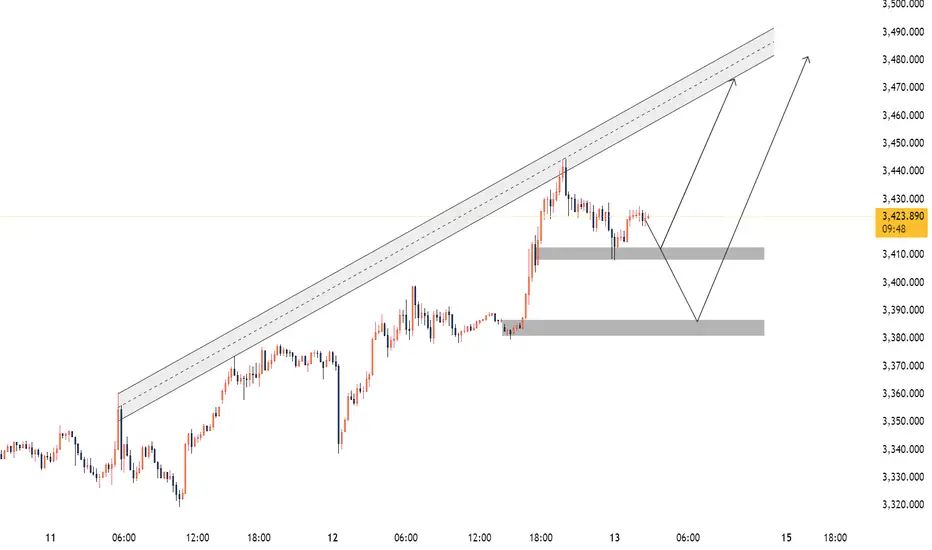
Gold/XAUUSD Possible Move 13 June 2025 The market continues to exhibit strong bullish momentum within a well-respected ascending channel. After an impulsive breakout to the upside, price is now retracing in a healthy corrective move, offering high-probability buying opportunities at two well-defined demand zones.
🔍 Technical Structure:
Price is trending inside an ascending parallel channel, with clear respect for both the median and outer trendlines.
A significant bullish impulse pushed price above previous local highs, suggesting institutional interest and continuation potential.
Currently, price is retracing and approaching two key demand areas that align with bullish continuation setups.
🎯 Key Buy Zones:
✅ Zone 1: 3,408 – 3,412
Minor mitigating demand zone, likely to act as support if the market retraces slightly.
Ideal for aggressive long entries if price shows confirmation (e.g., bullish engulfing, LTF structure shift).
✅ Zone 2: 3,380 – 3,385
Deeper unmitigated demand zone, aligned with a potential liquidity sweep and strong institutional support.
Considered a high-probability entry area for larger impulse moves.
🌍 Fundamental Context:
Recent geopolitical tensions in the Middle East, can lead to sharp intraday moves, with 100+ pip 5-minute candles not being out of the question.
Given this backdrop, demand zones become critical areas for smart money entries as traders seek to align technical levels with macro drivers.
📈 Trade Signal:
Bias: 🔵 Bullish
Buy Zone 1: 3,408 – 3,412
SL: Below 3,395
TP: 3425, 3440, trail till 3,470
R:R: ~1:3
Buy Zone 2: 3,380 – 3,385
SL: Below 3,368
R:R: ~1:4
🧠 Final Note:
Watch for price reaction at both zones. Use LTF confirmation before entry and respect your risk management. With news-driven volatility in play, quick movements are expected, offering excellent trade opportunities for prepared traders.
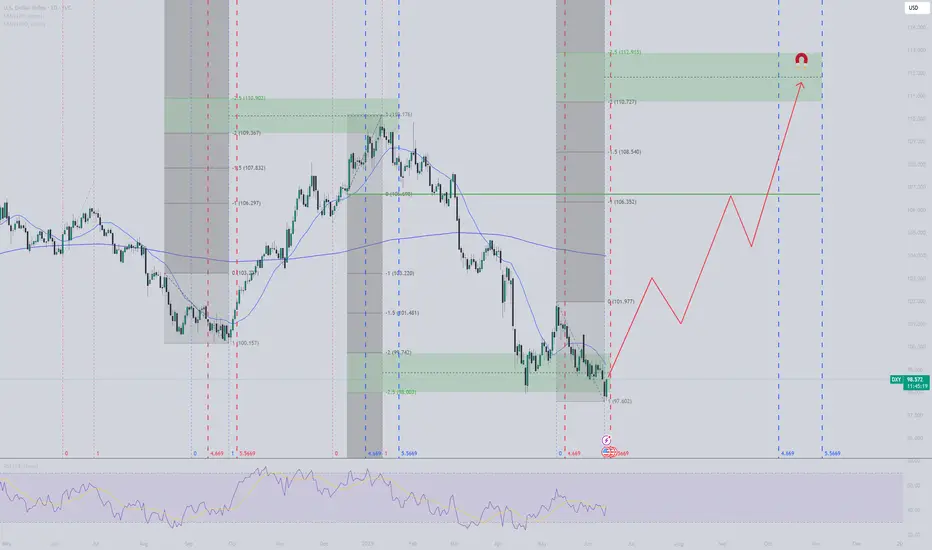
DXY ready for takeoffDXY seems to have reached the bottom for now, as planned within the marked red timezone. I expect a bullish run until October (blue timezone) with target around 111-113 USD, which corresponds to 2-2.5 stdv from this last manipulation leg lower. All areas marked in chart.
Safe-Haven Demand Boosts Gold as Middle East Tensions EscalateHey Traders,
In today’s trading session, we are monitoring XAUUSD for a buying opportunity around the 3,380 zone. Gold is currently trading in an uptrend and is experiencing a correction phase as it pulls back toward this key support and resistance area.
On the fundamental side, reports indicate that Israel struck Iran overnight — fueling a classic geopolitical risk-off sentiment. This escalation is driving strength in safe-haven assets while putting pressure on riskier markets. Gold typically benefits from this kind of uncertainty, adding further weight to the technical setup we’re seeing today.
Trade safe,
Joe

Stuck in the Zone: DXY Tests Balance Between 98 and 99Hello Traders,
After a sharp and uninterrupted decline in the DXY, price found support at the 97.921 level. Sellers then regained control from the weekly bearish Fair Value Gap (W-FVG), pushing price back into the 99 zone.
In this zone, neither sellers nor buyers have managed to assert dominance—suggesting that these levels may act as a pause or balance point. Given the extended drop, a temporary correction could follow if buyers gain traction after one last push.
For now, the bearish USD narrative remains intact. With upcoming catalysts like China/US talks and tomorrow’s CPI release, a renewed move toward 98 is likely to accelerate.
Whether this leads to further selling or a corrective phase will be assessed afterward.

New Highs for Gold = New bull RunHere it is!! the breakout I been talking about in my other updates. doing it on a Friday cause Israel is starting ish! Sitting this out cause it can get volatile.

Buy Idea on Us Dollar Index (Dxy)Based on :
- Demand zone
- Pin bar Reversal
- Changing of correlation between dxy and zb1!
- cot report

Dollar Falling Ends Soon? Look What Pattern Is Forming!”Asset: U.S. Dollar Index (DXY)
Timeframe: 1D (Daily Chart)
Methodology: Elliott Wave + FVG (Fair Value Gap) + Price Action
DXY has completed an impulsive 5-wave bearish structure, now entering a high-probability reversal zone marked by strong buyer interest around the Wave 5 bottom.
📌 Key Insights:
Wave 5 approaching demand zone (Buyers' area)
Price inside Fair Value Gap (FVG) – potential order block
Bullish reversal expected from here
Forecast: A breakout into an ascending channel, confirming reversal
💡 If Wave 5 holds, we may see a sharp upside rally aligning with smart money accumulation + Elliott Wave psychology.
🔔 Watch for bullish confirmations near 97.50–98.00 for a potential long setup targeting the 104–107 zone.

Gold (XAUUSD) Eyes 3,330 Zone as Safe-Haven Demand Builds!!Hey Traders, In today’s trading session, we’re keeping a close watch on XAUUSD for a potential buying opportunity around the 3,330 zone. Gold continues to trade within a strong uptrend, and is currently undergoing a healthy correction, bringing it near a key support/resistance level that could act as a springboard for the next leg higher.
From a fundamental perspective, rising geopolitical tensions in the Middle East have led to the evacuation of diplomatic personnel and increasing concerns of potential military escalation. As uncertainty grows, safe-haven assets like gold tend to attract stronger demand from investors seeking protection against volatility and risk.
If the situation deteriorates further, we could see a surge in gold prices as market participants hedge against geopolitical instability.
Trade safe,
Joe

DXY H4 – Dollar Weakens Ahead of PPI Release DXY H4 – Dollar Weakens Ahead of PPI Release | Is the Market Pricing in a Fed Pivot?
🌐 Macro & Fundamental Context
As we head into the New York session on June 12, the market’s attention shifts to one critical data point: the US PPI (Producer Price Index). Following the softer-than-expected CPI reading of 2.4% YoY (vs. 2.5% forecast), the Dollar Index (DXY) dropped sharply—signaling fading inflation pressure and reigniting rate cut expectations.
✅ Bearish Fundamentals Building for the USD:
CPI miss fuels Fed rate cut bets (currently ~65% chance for September per FedWatch Tool).
US Treasury yields are easing, reflecting the market’s pricing of a less aggressive Fed.
Risk assets rallying as capital flows rotate away from USD into gold, equities, and long-duration bonds.
If today’s PPI also comes in below forecast, it could confirm a deeper correction in DXY. Conversely, a surprise PPI upside might trigger a short-term pullback.
📉 Technical Analysis – H4 Timeframe
🔹 Overall Trend:
DXY is locked within a clearly defined descending channel, with a consistent Lower High – Lower Low structure holding since late May.
🔹 Key Technical Zones:
Short-term resistance: 98.548 – likely to act as a ceiling unless PPI surprises to the upside.
Immediate support: 97.966 – a break below opens the door toward the key support zone at 97.191, which aligns with previous FVG imbalance and multi-timeframe demand.
🔹 EMA Structure:
Price remains below all major EMAs (13 – 34 – 89 – 200), confirming persistent bearish pressure.
EMA13 is currently acting as dynamic resistance on H4, pressing down on price.
🧠 Market Sentiment & Flow Insight
Investors are rotating out of USD as inflation fears fade and Fed easing expectations increase.
Risk-on sentiment is returning, benefiting gold and stocks while weighing on DXY.
However, a hot PPI print could spook the market briefly, leading to a corrective bounce in the Dollar before the trend resumes.
🔍 Scenarios to Watch:
PPI comes in lower than expected:
DXY may retest 98.548 resistance and reject lower.
Next targets: 97.966 → 97.191
PPI surprises to the upside:
Technical bounce toward 98.5–98.8 possible.
But trend remains bearish unless price reclaims 99.2+ zone.
✅ Conclusion
DXY remains under pressure from both macro and technical angles. The PPI report will be the next catalyst that determines whether this is a short-term dip or the continuation of a broader USD downtrend.
🎯 Tactical view: Favour short positions on DXY if price bounces into resistance and PPI supports the disinflation narrative. Target: 97.1 and below.

DXY Will Grow! Long!
Here is our detailed technical review for DXY.
Time Frame: 2h
Current Trend: Bullish
Sentiment: Oversold (based on 7-period RSI)
Forecast: Bullish
The market is trading around a solid horizontal structure 98.198.
The above observations make me that the market will inevitably achieve 98.620 level.
P.S
Please, note that an oversold/overbought condition can last for a long time, and therefore being oversold/overbought doesn't mean a price rally will come soon, or at all.
Disclosure: I am part of Trade Nation's Influencer program and receive a monthly fee for using their TradingView charts in my analysis.
Like and subscribe and comment my ideas if you enjoy them!

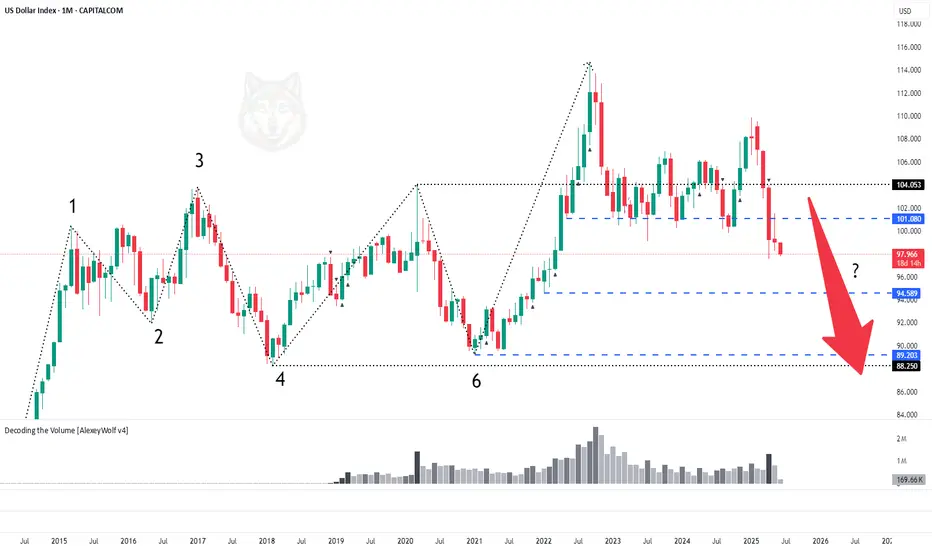
DXY. Midterm Analysis of the US Dollar IndexHey traders and investors!
📍 Context
On the monthly timeframe, the market was in a range. The price broke above the upper boundary and was long supported around the 101.080 level. This level was repeatedly tested by sellers and now appears to have been broken.
📊 Monthly targets: 89.20 and 88.300.
🔎 Analysis
Why might the downward movement continue?
Daily TF
On the daily chart, we can see that on the day buyers returned to the 101.080 level, the main volume was accumulated in a buyer candle right at and slightly above the level. This suggests the level was defended by sellers. This indicates they are currently in control, and the decline may continue. Let’s look at the nearest potential buyer activity levels.
11-day TF
The price has once again broken downward out of the range. Below, there is a small consolidation area formed during the previous upward movement. Its boundaries are: upper boundary — 97.385, lower boundary — 94.589.
🎯 Trade Idea: Rebounds from the upper boundary at 97.385 are possible, but overall the priority remains with a move into this range and towards the 95.00–94.589 zone.
This analysis is based on the Initiative Analysis concept (IA).
Wishing you profitable trades!
DXY Support Ahead! Buy!
Hello,Traders!
DXY keeps going down
But the strong horizontal
Support is ahead around 98.000
So after the price hit the level
We will be expecting a
Local rebound and a move up
Buy!
Comment and subscribe to help us grow!
Check out other forecasts below too!
Disclosure: I am part of Trade Nation's Influencer program and receive a monthly fee for using their TradingView charts in my analysis.
