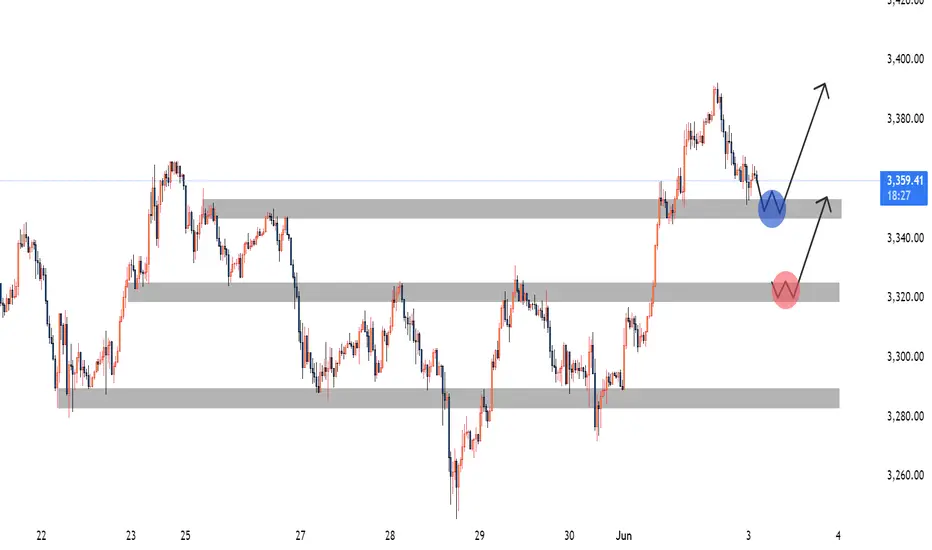
Gold XAUUSD Possible Move 6th May 2025I'm watching two key demand zones today for potential buy opportunities:
📍 Zone 1: 3348–3352 (Blue Zone)
Reasoning: This area aligns with a previous demand zone that has already shown strong bullish reaction. Price is currently retracing into this area.
Signal to Enter: Look for:
A liquidity sweep below the zone (e.g., a quick wick down grabbing stop-losses).
Followed by a bullish engulfing candle or a break of minor structure to the upside on lower timeframes (e.g., M1–M5).
Expectation: If confirmed, this could trigger the next leg up toward the recent highs (approx. 3385+).
📍 Zone 2: 3320–3325 (Red Zone)
Reasoning: A deeper zone of interest where price last consolidated before a strong rally. Ideal for deeper pullback entries if the first zone fails.
Signal to Enter:
Look for a retest and bullish rejection with strong wick rejections or a CHoCH (Change of Character) on LTF.
A clean break of minor bearish structure can serve as confirmation.
Expectation: If this level holds, a bounce back toward the mid/high 3300s is likely.
✅ Trade Setup Summary:
Buy Zone 1: 3348–3352
Signal: Liquidity grab + Bullish engulfing / BOS (low timeframes)
Target: 3365–3375-85
Invalidation: Clean break and close below 3345
Buy Zone 2: 3320–3325
Signal: Rejection wicks + CHoCH or FVG entry
Target: 3335–3355-3375
Invalidation: Break below 3315
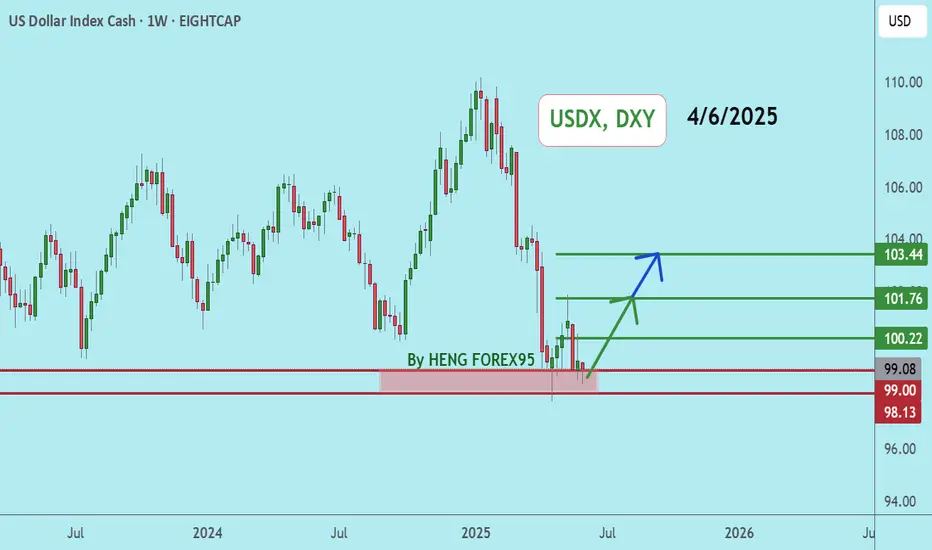
J-DXY
GOLD REVERESED! Looking for the breakout!We got some news Tuesday that shifted the direction of the pullback and now looking like we might just break out. if we can make it above yesterdays highs and closed on the H4 then I think it will be safe to look for higher levels. but if it breaks down from here then we could still see it reach for Liquidity. We just have to be patient in waiting for price to show its hand.

THE FLEX SETUP (EURGBP)Good day traders, I'm back with another setup and it’s only an update that I believe can really provide insight into what to expect from price in the upcoming weeks.
Like I always say that I always want to see price take out a previous week high/low as I use that as a confirmation in term of the power of 3 that I use to try and avoid manipulation, but this doesn't mean I don't get on the wrong side of price moves. Looking at the HTF's overall structure we can see that we in a very bullish structure but... There's a bearish flow in price!! On the weekly TF price left a large FVG(BISI), showing how strong the bullish structure is and now that price is trading on top of this BISI I'm mentioning. If we go one TF lower to the daily TF than on the daily the weekly BISI is a balanced price range and normally how I look at Gaps after been balanced, I treat them like classic support/resistance, but they have to confluence with another PD array first than for me the rules of 'support/resistance' come into play. If you look close into the daily TF, we have relative equal highs inside the volume imbalance created on the 12th of May.
Let's look at how price delivered since opening with a gap lower on the 12th, on that same day price repriced that gap but did not close above it. Why do we want it to close above it? Well ICT teaches more on volume imbalances and the rules or pros and cons. If price closes above the volume imbalance than it becomes balanced once price retests the closure above/below obviously depending on the gap opening. On the 4HTF we saw price shift structure higher and the first thing I see is the candle that had a broken lower high because it also became our breaker. And a FVG inside it making that zone stronger again we can use all the PD arrays together.

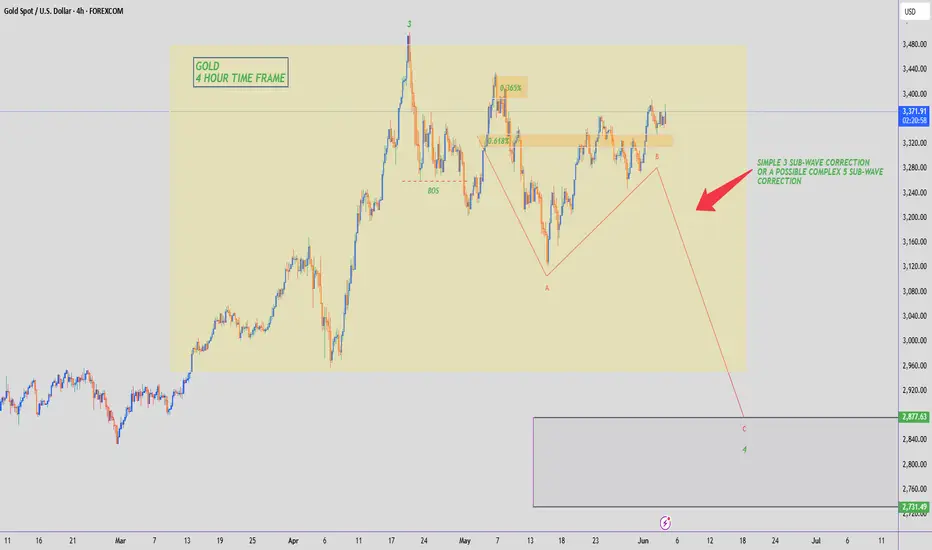
GOLD - WAVE 4 CORRECTION TO $2,800 (UPDATE)The 'resistance turned support' which I mentioned yesterday is holding up well. After the retest of the support zone, we're currently seeing bullish momentum keep Gold prices up.
As soon as Gold surpasses $3,400 & closes WITHIN the previous 0.365% zone, I will be sure that the 3 Sub-Wave (A,B,C) correction for sellers is over & buyers are now heading towards a new ATH. Until then I am still wary & being careful of sellers.
ABBV - Are you Ready?Hello TradingView Family / Fellow Traders. This is Richard, also known as theSignalyst.
📈ABBV has been in a correction phase and it is currently approaching the lower bound of the red and blue channels.
Moreover, the green zone is a strong round number $150 and structure!
🏹 Thus, the highlighted blue circle is a strong area to look for buy setups as it is the intersection of structure and lower trendlines acting as non-horizontal support.
📚 As per my trading style:
As #ABBV approaches the blue circle, I will be looking for bullish reversal setups (like a double bottom pattern, trendline break , and so on...)
📚 Always follow your trading plan regarding entry, risk management, and trade management.
Good luck!
All Strategies Are Good; If Managed Properly!
~Rich

DXYDXY price is near the support zone 98.74-97.87. If the price cannot break through the 97.87 level, it is expected that the price will rebound. Consider buying the red zone.
🔥Trading futures, forex, CFDs and stocks carries a risk of loss.
Please consider carefully whether such trading is suitable for you.
>>GooD Luck 😊
❤️ Like and subscribe to never miss a new idea!
XAUUSD - Gold Awaits Employment Data!Gold is trading above the EMA200 and EMA50 on the 4-hour timeframe and is trading in its ascending channel. If gold corrects towards the demand range, it can be bought in the short term with appropriate risk-reward. A break of the resistance range will also pave the way for gold to rise to $3,400.
In April, the U.S. labor market demonstrated resilience and flexibility, with job openings climbing to 7.4 million—exceeding analysts’ expectations. Hiring reached its fastest pace since May 2024, as employers brought on 5.6 million new workers. While these upbeat figures surprised many, some economists remained cautious, warning that ongoing tariff policies could weigh on the labor market later this year.
Recent labor market data have featured unexpected results, mostly leaning positive. According to Tuesday’s report from the Bureau of Labor Statistics, job openings in April surpassed forecasts, rising from 7.2 million in March to 7.4 million.
Despite the encouraging nature of the data, the overall labor market picture has not shifted dramatically. Month-to-month fluctuations aside, the broader trend reflects a slowdown compared to the post-pandemic period when demand for workers was extremely high. Economists continue to expect that the uncertainty surrounding President Donald Trump’s tariff campaign will further hinder job creation in the months ahead.
Robert Frick, corporate economist at Navy Federal Credit Union, wrote in a commentary: “These figures still reflect a gradually slowing but stable job market. The jump in openings is more indicative of normal data volatility than a genuine surge in new positions. Likewise, the increase in hiring isn’t a strong recovery signal, as hiring remains within recent weak ranges.”
Alison Sriwastava, labor economist at the Indeed Hiring Lab, added: “The data show that U.S. employers had enough confidence to maintain more job openings in April than in March—whether through strong planning, resilient supply chains, or a bit of luck. But just because employers had a good month doesn’t mean they can sustain that success indefinitely, especially given the continued uncertainty and volatility.”
Meanwhile, the White House confirmed that it had sent letters to several countries asking them to submit their best trade offers by Wednesday. Progress on trade agreements since “Liberation Day” has been sluggish and challenging, and now all eyes are on what the Trump administration will do next.
Reuters obtained the letter, which asked countries to present their best proposals regarding tariffs, purchase quotas for U.S. goods, and plans to eliminate non-tariff barriers. However, according to the New York Post, immediate retaliation or action from the White House should not be assumed. Citing a source familiar with the matter, the letter’s purpose was described as an assessment of trade partners’ progress rather than a call for final offers.
In the diplomatic arena, newly appointed German Chancellor Friedrich Merz is set to meet with Donald Trump at the White House on Thursday following weeks of consultations. Key topics on the agenda include the war in Ukraine, Middle East crises, and trade policy. Merz, who recently took charge of Europe’s largest economy, has made rounds through major European capitals and now seeks to ease tensions with the Trump administration. The main areas of contention between Washington and Berlin involve trade imbalances, support for Ukraine, and domestic policy disputes.
This meeting presents a rare opportunity for Merz to voice his positions directly to Trump—unlike his predecessor, who never received a White House invitation.Nevertheless, Merz faces numerous challenges, ranging from far-right political pressures at home to clashes over tech companies on both sides of the Atlantic.
Meanwhile, President Donald Trump’s 50% tariffs on imported steel and aluminum officially took effect at 12:01 AM Eastern Time on Wednesday. These now-doubled tariffs apply to all trading partners except the United Kingdom. As the only country to have reached a preliminary trade deal with the U.S. so far, the U.K. will remain under a 25% tariff until at least July 9.
The executive order signed by Trump on Tuesday stated that the action is intended to “more effectively counter foreign nations that continue to sell excess and underpriced steel and aluminum in the U.S. market, undermining the competitiveness of America’s domestic steel and aluminum industries.”

Bitcoin Brewing - A large move is coming!Bitcoin has been under pressure over the last few trading sessions.
Despite the equity markets going higher this asset is stuck in a holding pattern.
We are currently forming a wedge pattern that has given us a directional bias to trade.
Price action is at a 50/50 in terms of falling lower or rallying higher.
Being the fact that the bulls have been forming higher lows & higher highs, we have to give them due respect.
However understand this BTC is showing some distribution signs and is likely going to have a decent selloff within the next 15-45days. We may have 1 more spike higher but we may not.
1 note of interest is the 7day & 20 day moving average just signaled a bearish crossover which is something you need to monitor closely.
I do think the upside is limited to about 115K if we have 1 more move higher.

CRUDE OIL TO HIT $160?!Oil prices broke down lower in the past few weeks, after a much needed LQ grab, following a 2 year consolidation. We’ve seen a ‘5 Wave Complex Correction’, which should now be followed by price recovery.
Wait for buyers to BREAK ABOVE our ‘buying confirmation’ level, followed a by a retest before buying, otherwise leave it❗️

USDollar Is Making An Intraday Pullback Within DowntrendGood morning traders! Stocks keep pushing higher along with yields, so it looks like 10Y US Notes could still see lower support levels, and that’s why USdollar is in a bigger intraday correction. What we want to say is that while the 10Y US Notes are still searching for support, the DXY can stay in recovery mode or at least sideways. In the meantime, stocks can easily see even higher levels after NVIDIA surpassed earnings.
Looking at the intraday USDollar Index – DXY chart, we see a leading diagonal formation, so we are tracking now an intraday abc correction before a bearish continuation, thus keep an eye on GAP from May 18 around 101 level that can be filled and may act as a resistance before a bearish continuation.

Bearish drop?US Dollar Index (DXY) is risng towards the pivot and could reverse to the 1st support.
Pivot: 99.10
1st Support: 98.01
1st Resistance: 99.94
Risk Warning:
Trading Forex and CFDs carries a high level of risk to your capital and you should only trade with money you can afford to lose. Trading Forex and CFDs may not be suitable for all investors, so please ensure that you fully understand the risks involved and seek independent advice if necessary.
Disclaimer:
The above opinions given constitute general market commentary, and do not constitute the opinion or advice of IC Markets or any form of personal or investment advice.
Any opinions, news, research, analyses, prices, other information, or links to third-party sites contained on this website are provided on an "as-is" basis, are intended only to be informative, is not an advice nor a recommendation, nor research, or a record of our trading prices, or an offer of, or solicitation for a transaction in any financial instrument and thus should not be treated as such. The information provided does not involve any specific investment objectives, financial situation and needs of any specific person who may receive it. Please be aware, that past performance is not a reliable indicator of future performance and/or results. Past Performance or Forward-looking scenarios based upon the reasonable beliefs of the third-party provider are not a guarantee of future performance. Actual results may differ materially from those anticipated in forward-looking or past performance statements. IC Markets makes no representation or warranty and assumes no liability as to the accuracy or completeness of the information provided, nor any loss arising from any investment based on a recommendation, forecast or any information supplied by any third-party.

XAUUSD - Will Gold Hold $3,300?!Gold is trading above the EMA200 and EMA50 on the 1-hour timeframe and is trading in its ascending channel. If gold corrects towards the two demand areas, it can be bought with a risk-adjusted reward.
Following a tense market open yesterday, driven by escalating military tensions between Russia and Ukraine, the two sides concluded their negotiations in Istanbul. According to an Axios correspondent, Russia presented Ukraine with a formal peace proposal during the talks, outlining terms for a ceasefire and an end to the conflict.
Interfax reported that Russia issued an official memorandum listing its proposed conditions for achieving a ceasefire.
Key points in the document include:
• A full withdrawal of Ukrainian military forces from territories currently under Russian control, including Donetsk, Luhansk, Zaporizhzhia, and Kherson.
• The complete removal of all existing economic sanctions and a mutual agreement to refrain from introducing new sanctions.
• A proposal to reestablish economic relations, including the resumption of natural gas transit through Ukraine.
• A demand for Ukraine to reduce its military personnel and weaponry, along with explicit guarantees of its non-nuclear status and a strict ban on deploying any nuclear arms on its territory.
• The memorandum also calls for the termination of general military mobilization in Ukraine and the initiation of a demobilization process as part of the path toward a ceasefire.
On the other side, Ukrainian President Volodymyr Zelensky announced that Kyiv and Moscow have agreed to a prisoner exchange involving 1,000 soldiers from each side. This exchange includes an additional 200 individuals per side compared to previous agreements. Zelensky described the deal as “another step in the right direction,” and noted that the lists of detainees would be exchanged between the countries later this week.
In U.S. economic news, the latest update from the Atlanta Federal Reserve’s GDPNow model forecasts a 4.6% annualized growth rate for real GDP in the second quarter of 2025. This is an upward revision from the previous estimate of 3.8% released on May 30. The revision followed new data releases from the U.S. Census Bureau and the ISM. In particular, personal consumption growth was raised from 3.3% to 4.0%, while private domestic investment was adjusted from –1.4% to +0.5%.
On the trade front, according to a draft letter obtained by Reuters, the Trump administration has urged participating countries to submit their best trade proposals by Wednesday. The goal is to accelerate talks with multiple partners ahead of a five-week deadline.
This draft, issued by the Office of the United States Trade Representative, provides a glimpse into how President Trump plans to wrap up complex trade negotiations with dozens of nations. These negotiations began on April 9, when he temporarily suspended his “Freedom Day” tariffs for 90 days—until July 8—following turmoil across equity, bond, and currency markets in response to the broad scope of the tariffs.
According to the draft, the U.S. is asking countries to submit top-tier offers across key areas, including tariff and quota proposals for importing American industrial and agricultural products, as well as plans to remove non-tariff barriers.
Stuart Jenkins from Goldman Sachs stated that elevated tariffs on steel and aluminum have likely contributed to a weakening of the U.S. dollar. On Friday, President Trump announced that these tariffs would double starting Wednesday, reaching 50%. Although metals represent a relatively small portion of U.S. imports and the broader impact may be limited, Jenkins noted that this move illustrates the administration’s continued ability to impose tariffs, even in the face of potential legal challenges.

Skeptic | EUR/USD Update: New Triggers Unleashed!Hey everyone, Skeptic here!
EUR/USD is heating up after EURX consolidated above 1058.8 — a level I highlighted in Sunday’s watchlist — signaling potential longs across EUR pairs. 😎 Let’s break it down with a quick EUR/USD update.
After our trigger at 1.14183 fired, price climbed 33 pips, then pulled back to retest the breakout level. No fakeout this time — that zone is now acting as solid support.
👀 What’s the new trigger?
You've got a few playbook options here depending on your trading style:
Reaction traders: Watch for a strong bullish reaction candle at support.
Momentum traders: Patience pays — wait for an indecision candle to resolve.
Breakout traders: Keep an eye on a clean break above 1.14440.
Shorts? Not yet. Major and minor trends are still bullish, so fading the move isn’t ideal right now.
📝 Quick note: I’m already in a position after the 1.14183 breakout. Still watching EUR/USD closely, especially with DXY nearing a key support at 98.683 — a break there could spark sharp, sustained moves and juicy R/R setups.
As always: No FOMO. No hype. Just reason.
Stay sharp, manage your risk, and let’s grow together! 🤍
💬 Let’s Talk!
If this recap sparked some ideas, give it a quick boost — it helps a lot! Got a pair or setup you want me to break down next? Drop it in the comments. Thanks for sticking around — keep trading smart! ✌️

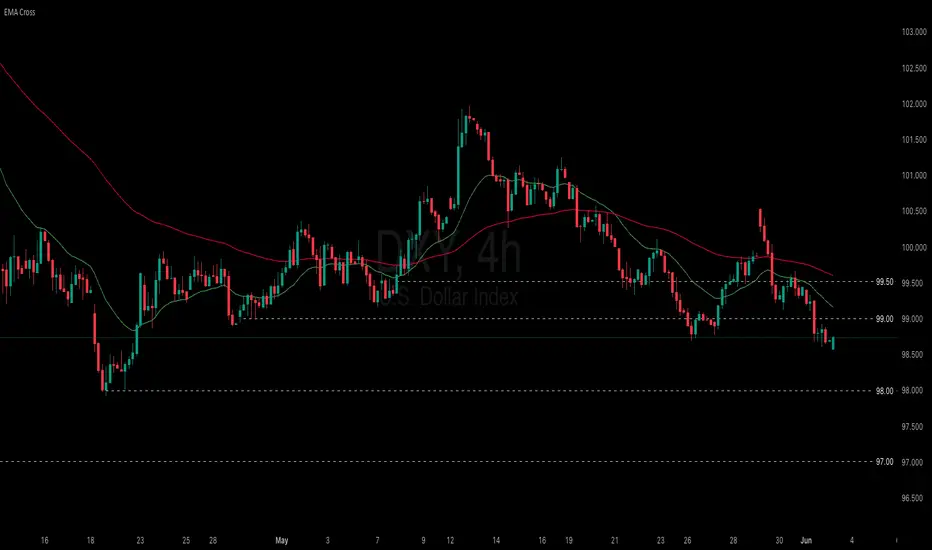
Persistent concerns about the US economy are weighing on the DXY
US-China tensions deepened as President Trump criticized China’s rare earth exports and threatened broader tech restrictions and visa cancellations for Chinese students. He also vowed to double tariffs on foreign steel to 50% to strengthen the US steel industry. April headline PCE inflation eased to 2.1% (prev. 2.3%, cons. 2.2%), partly soothing tariff-related inflation concerns.
DXY broke below the 99.00 threshold and dropped to a 6-week low. EMA21 is widening its gap with EMA78, suggesting a potential extension of the bearish structure. If DXY breaks below the support at 98.00, the index may decline further to 97.00. Conversely, if DXY reclaims the resistance at 99.00 and breaches above EMA21, the index could advance to 99.50.
Gold is Setting up for a Move! Could it be a big one?Looking for price to set up for a solid move. One thing is for sure we are waiting for the killzones before taking any action. The price action the last few days has been giving fake outs just before we roll into the killzone. Be patient. Wait for things to line up.

EURUSD CRACK!I first turned bullish on the EUR back in November 2024 after the disastrous election results.
I have always felt the 105 area was a good area to go long, fundamentally going back all the way to 2017. Here is an example.
After 17 years of data, we can all agree that the 105 area was a great value to get long the EUR. Now we see a major CRACK! in the chart with the fundamentals to back it up.
Again, I remind you I am a MACRO Trader. So my trades hold for a long, long time unless the facts change. I don't do 3 pips and i am out crap!
Let this be a WARNING! To the dollar bulls!
Click Boost, follow, subscribe! Let's get to 5,000 followers so I can help them navigate these crazy markets, too. ))

DXY: Strong Growth Ahead! Long!
My dear friends,
Today we will analyse DXY together☺️
The recent price action suggests a shift in mid-term momentum. A break above the current local range around 98.380 will confirm the new direction upwards with the target being the next key level of 98.653 and a reconvened placement of a stop-loss beyond the range.
❤️Sending you lots of Love and Hugs❤️

AUD/USD - Triangle Breakout (02.06.2025)The AUD/USD pair on the M30 timeframe presents a Potential Buying Opportunity due to a recent Formation of a Triangle Pattern. This suggests a shift in momentum towards the upside and a higher likelihood of further advances in the coming hours.
Possible Long Trade:
Entry: Consider Entering A Long Position around Trendline Of The Pattern.
Target Levels:
1st Resistance – 0.6490
2nd Resistance – 0.6512
🎁 Please hit the like button and
🎁 Leave a comment to support for My Post !
Your likes and comments are incredibly motivating and will encourage me to share more analysis with you.
Best Regards, KABHI_TA_TRADING
Thank you.
Disclosure: I am part of Trade Nation's Influencer program and receive a monthly fee for using their TradingView charts in my analysis.

GOLD BULLISH TO $3,620 - $3,730Here's a breakdown video of how I used my EW strategy to identify the next bullish target for Gold towards a new ATH.
⭕️Wave 3 Peaked at $3,500.
⭕️Simple 3 Sub-Wave (A,B,C) Correction Complete for Wave 4.
⭕️Strong Support Zone at Wave 4 Low of $3,122.
⭕️Fibonacci Retracement Used to Target Wave 5 Target.

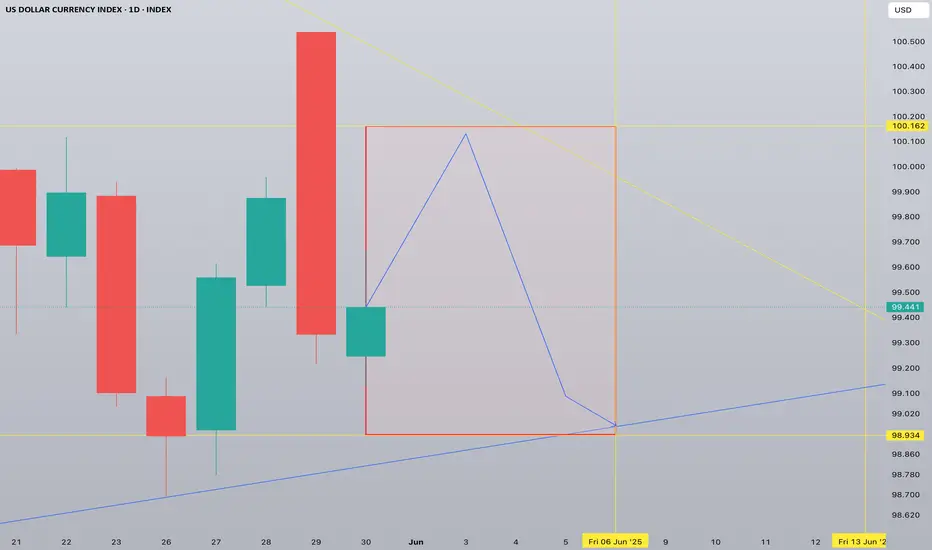
Weekly 1D chart DXY forecastMore of sideways movement. We may see a flash rise to 100 turning a fakeout followed by a fall to 98.93
Not enough strength to go up
DXY Short-Term Reversal Zone in SightUS Dollar Index (DXY) is approaching a strong support zone at 98.90–98.00, which has historically acted as a base for bullish reversals. The price is now testing the lower bound of this zone after a steady downtrend from the 101.94 high.
Key Technical Structure:
Support Zone: 98.90–98.00 (tested 3+ times)
Double Bottom Potential forming if bulls hold the zone
Upside Targets:
101.94: Key horizontal resistance
103.50: Swing high from early April
Scenarios to Watch:
🔹 Bullish Rebound:
Price bounces off 98.90–98.00 support
Confirmation: Break and close above 100.50 near-term resistance
Could fuel move back to 101.94, possibly 103.50
🔹 Bearish Breakdown:
Daily close below 98.00 would invalidate bullish setup
Opens downside to 97.00 and even 95.50
Macro Drivers to Watch:
FOMC speakers and interest rate guidance
US jobless claims or inflation surprise
Risk-off sentiment (benefits USD) vs. continued global risk appetite
Conclusion:
DXY is trading at a make-or-break support zone. Watch for clear bullish reaction or bearish breakdown before committing. The setup favors a bounce unless 98.00 fails.

DXY Update..PWL takenGood day traders I’m back yet again with another update but this this it’s DXY(dollarindex)).
Price has taken previous week’s low, and for me that’s the manipulation phase in the power of 3 because my bias is bullish on the dollar and bearish on foreign currencies. Price has taken the PWL in a zone/area where we saw price react higher in that BPR zone/area. For the rest of the week I personally believe we can expect higher prices on DXY, Atleast till the midpoint of that gap above price. ICT teaches more on the importance of that halfway/midpoint of gaps and other PD arrays.
Since we are in a discount zone we can expect price to move higher into the premium range of the daily TF dealing range and our first liquidity (internal) is also inside the premium zone.

XAUUSD - Gold is on the verge of a very important week!Gold is trading above the EMA200 and EMA50 on the four-hour timeframe and is trading in its ascending channel. I predict the path ahead for gold to be upward and if the resistance level is broken, we can look for buying opportunities. If gold corrects, we can also buy it with a reward at an appropriate risk.
Gold prices experienced a mild decline over the past week, with market sentiment shaped less by fundamental shifts and more by mixed messages and scattered commentary around tariffs.Despite the noise, many traders chose to rely on data and technical charts rather than reacting emotionally—data that painted a more subdued picture than the headlines suggested.
Rich Checkan, CEO of Asset Strategies International, responded confidently in a recent survey, predicting further gains in gold. “The trajectory for gold is clearly upward. Prices have stabilized around the $3,300 level and appear ready for a new rally, especially if the appellate court’s ruling on tariffs is upheld,” he said.
Checkan also pointed to another macroeconomic factor that could support gold: “A new tax bill, described as large and costly, is set to be voted on in the Senate soon. If passed, it will likely widen the budget deficit, which historically leads to increased liquidity and rising inflation—a favorable environment for gold.”
On Friday, the PCE inflation report showed easing price pressures, though not enough to put the Federal Reserve at ease. Core PCE (excluding food and energy) rose by 0.1% month-over-month and 2.5% year-over-year in April—matching expectations and slightly down from 2.7% the previous month. The headline PCE also increased 2.1% annually, just below the forecast of 2.2%.
The key point: these data reflect the first month in which Trump’s new tariffs were active, yet there’s little evidence so far that they’ve caused inflation to rise. Still, the disinflationary trend remains sluggish and distant from the Fed’s 2% target. In its latest minutes, the Fed warned that inflation may prove more persistent than previously thought.
Nick Timiraos of The Wall Street Journal, despite the seemingly positive PCE numbers, issued a cautionary note with four key insights:
• The inflationary impact of tariffs is expected to begin showing up from May and be fully reflected in June’s data. This could accelerate goods price increases and disrupt the path of disinflation.
• Last year’s monthly PCE figures were particularly weak (May: 0%, June: 0.1%, July: 0.2%). As these drop out of the annual calculation, even if monthly gains remain steady, YoY rates could rise mathematically.
• The three-month average for Core PCE from May to October 2024 was only 0.1%. If upcoming monthly figures hit 0.2%, annual disinflation could stall or even reverse.
• While the latest report is encouraging, the effects of tariffs and the removal of last year’s weak data could complicate the inflation trajectory.
Looking ahead, market attention will focus heavily on a suite of crucial U.S. labor market indicators. The Job Openings and Labor Turnover Survey (JOLTS) is due Tuesday, private sector employment data (ADP) on Wednesday, and jobless claims on Thursday. However, the most anticipated release will be Friday’s Non-Farm Payrolls (NFP) report for May—widely viewed as a key factor influencing rate expectations.
Alongside labor data, markets will also watch other critical economic reports. The ISM Manufacturing PMI on Monday and the ISM Services PMI on Wednesday will offer broader insight into U.S. business activity. In the realm of monetary policy, interest rate decisions from the Bank of Canada (Wednesday) and the European Central Bank (Thursday) are expected to trigger notable movements in the currency and gold markets.
