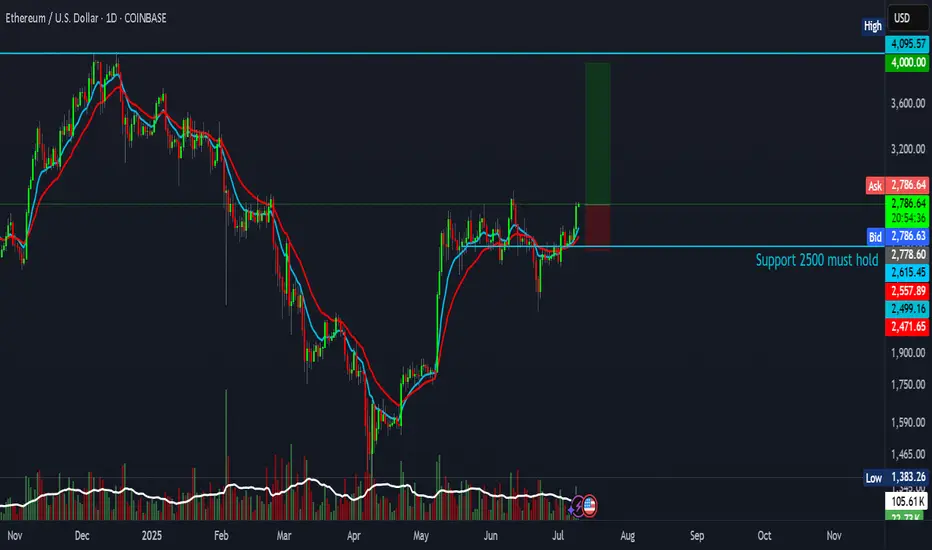
Ethereum trade setup with a 4:1 risk-reward ratioAnother attempt — and this one could be the real breakout.
This setup offers a 4:1 risk-reward ratio, targeting $4,000.
Entry: $2,780
Stop Loss: $2,471
Target: $4,000
Not financial advice.
J-ETH
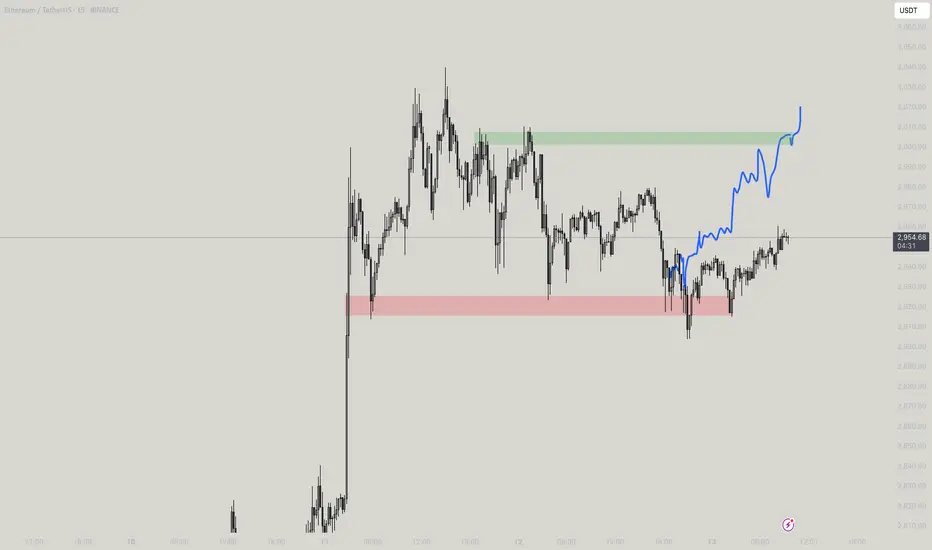
ETH – Watching the $2,900 Trigger for ATHsJust need BINANCE:ETHUSDT to break above $2,900 for the next trigger.
Feeling confident it will chew through the current supply zone.
Plenty of other coins are already showing clear direction, and Ethereum should follow.
Be patient—I doubt ETH will challenge the #1 spot, but a move above $2,900 opens the door to a potential new ATH.

Resistance zone: 3265.0-3321.30
Hello, traders.
If you "Follow", you can always get the latest information quickly.
Have a nice day today.
-------------------------------------
(ETHUSDT 1D chart)
It is showing an upward breakout of the important zone of 2419.83-2706.15.
We need to see if the price can be maintained by rising above the Fibonacci ratio of 0.5 (2788.93).
If so, it is expected to rise to the resistance zone of 3265.0-3321.30.
The important zone of 2419.83-2706.15 is the support and resistance zone that can lead to a full-fledged uptrend.
Therefore, if it falls below this zone, we should stop trading and watch the situation.
-
Thank you for reading to the end.
I hope you have a successful trade.
--------------------------------------------------
- This is an explanation of the big picture.
(3-year bull market, 1-year bear market pattern)
I will explain more details when the bear market starts.
------------------------------------------------------

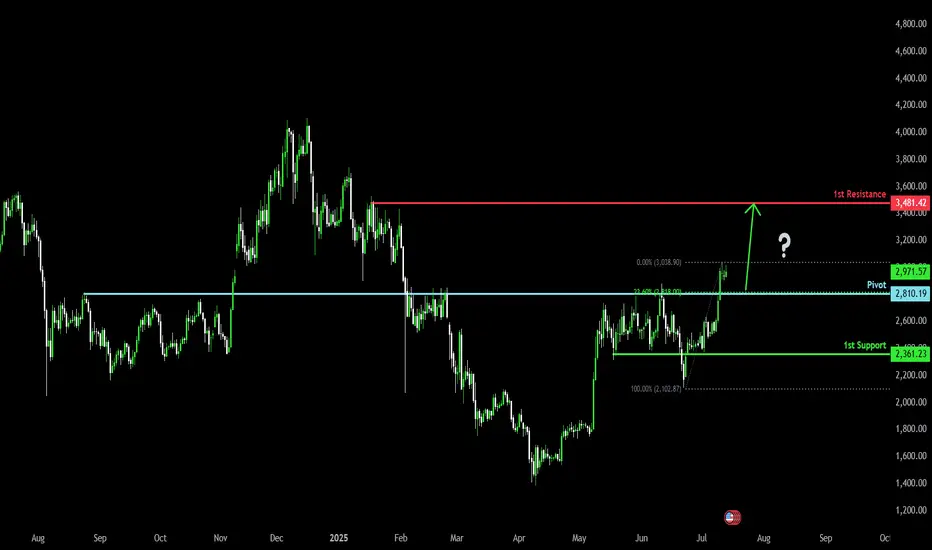
Bullish bounce?Ethereum (ETH/USD) is falling towards the pivot and could bounce to the 1st resistance.
Pivot: 2,810.19
1st Support: 2,361.23
1st Resistance: 3,481.42
Risk Warning:
Trading Forex and CFDs carries a high level of risk to your capital and you should only trade with money you can afford to lose. Trading Forex and CFDs may not be suitable for all investors, so please ensure that you fully understand the risks involved and seek independent advice if necessary.
Disclaimer:
The above opinions given constitute general market commentary, and do not constitute the opinion or advice of IC Markets or any form of personal or investment advice.
Any opinions, news, research, analyses, prices, other information, or links to third-party sites contained on this website are provided on an "as-is" basis, are intended only to be informative, is not an advice nor a recommendation, nor research, or a record of our trading prices, or an offer of, or solicitation for a transaction in any financial instrument and thus should not be treated as such. The information provided does not involve any specific investment objectives, financial situation and needs of any specific person who may receive it. Please be aware, that past performance is not a reliable indicator of future performance and/or results. Past Performance or Forward-looking scenarios based upon the reasonable beliefs of the third-party provider are not a guarantee of future performance. Actual results may differ materially from those anticipated in forward-looking or past performance statements. IC Markets makes no representation or warranty and assumes no liability as to the accuracy or completeness of the information provided, nor any loss arising from any investment based on a recommendation, forecast or any information supplied by any third-party.
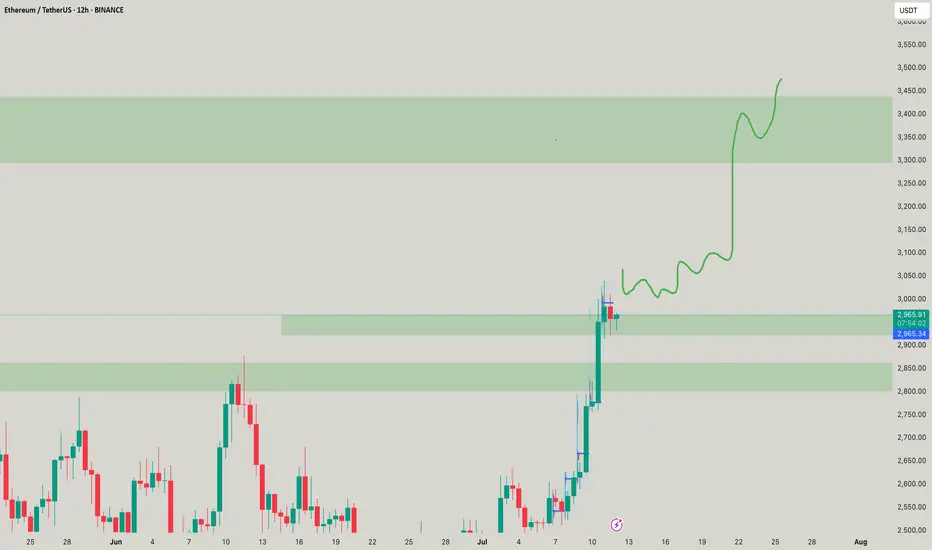
ETHEREUM - ETH Weekly Recap & Projection 13.07.2025Current Structure
Ethereum is showing a clear bullish bias.
Last week’s price action broke above a significant weekly swing level with solid candle closures — suggesting continuation.
Short-Term Scenarios
We could see two potential outcomes:
• A consolidation range forming at current levels
• A short-term retracement influenced by Bitcoin’s movement
Due to ETH’s high correlation with BTC, traders should review Bitcoin’s chart to understand ETH’s likely path.
Trading Plan
Wait for Bitcoin to complete a retracement
Monitor ETH for LTF (lower timeframe) confirmation and bounce
Seek long setups below the CME Gap (pink line)
Step 2 will serve as the trigger to initiate any positions on ETH.
Macro Risk-On Catalyst – Powell Resignation?
There are growing rumors regarding Federal Reserve Chairman Jerome Powell potentially resigning.
If confirmed, this could result in a strong rally across risk assets, including ETH — likely pushing prices higher without traditional pullbacks.
Summary
• ETH broke major weekly structure
• Watch BTC for clues — correlation remains high
• Plan favors long entries after BTC retrace + ETH LTF confirmation
• Powell resignation rumors could accelerate bullish trend

$ETH - Scalps to Victory ~ 3011Scalps of eth which is missed and going to $3011 but it already moved from the point of movement! Touching soon!
ETH Hits $3K — Next Stop: Moon or Pause?ETH just tagged the psychological $3 000 barrier after a sharp impulse, printing a fresh higher high inside its rising channel.
🧠 Game plan:
1️⃣Pullback zone: The orange structure area at $2 550 – $2 700 aligns with the channel’s lower trend-line — a prime spot for bulls to reload.
2️⃣Continuation trigger: A clean 4H close back above $3 000 turns the level into support, unlocking the path toward $3 100 (first target) and potentially higher into the summer.
3️⃣Invalidation: A decisive break below the channel would neutralise the setup and shift focus back to the macro support near $2 400.
Until then, every dip toward the orange demand is a gift in this bullish structure. Trade the plan, not the noise.
📚 Always follow your trading plan regarding entry, risk management, and trade management.
Good luck!
All Strategies Are Good; If Managed Properly!
~Richard Nasr

ETH Building Blocks - Keep it Simple🧱 Building Block - ETH Weekly Analysis 🧱
Ethereum has been trading within a well-defined structure, respecting key horizontal zones — each acting as a crucial building block in ETH’s macro journey.
🔹 Zone 1 ($1,700 - $2,100)
A strong demand and accumulation zone. ETH bounced from here multiple times, proving itself as the foundation of the current bullish attempt.
🔹 Zone 2 ($2,400 - $2,600)
We're currently hovering around this key mid-range resistance. A successful break above it would pave the way for the next major leg up.
🔹 Zone 3 ($2,900 - $3,400)
A major historical resistance turned supply area. ETH needs strong momentum and volume to break through this ceiling.
🔹 Zone 4 ($3,800 - $4,200)
The final building block before retesting ATH territory. A retest here could signal full bullish control in the coming months.
📍 As long as Zone 1 holds, ETH remains structurally bullish. Watch for breaks and rejections at each building block to gauge the next move.
Which block will ETH break next? 🔮
📚 Always follow your trading plan regarding entry, risk management, and trade management.
Good luck!
All Strategies Are Good; If Managed Properly!
~Rich

ETH ~ Ready for $3400?Its time foe eth the more time it stays up the more time it goes beautifully! Understand! Such a good move to be coming soon to your doorstep lol
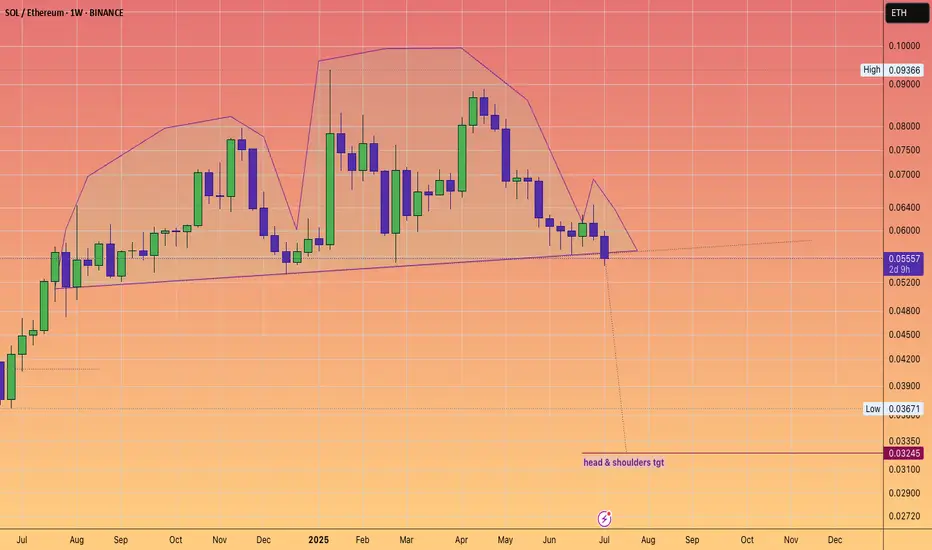
Boomers buying Ethereum not SolanaRatio has broken a head and shoulders
Stablecoin supercycle
Tom Lee
SBET
ETH treasury #fomo
Ethereum can make a small correction before it continues to growHello traders, I want share with you my opinion about Ethereum. After a long period of consolidation within a descending triangle, Ethereum broke out and started forming a steady upward channel. The impulse move from the buyer zone gave the market fresh bullish energy. We saw the price pushing through key resistance levels, showing strong momentum and confidence from buyers. Eventually, ETH reached a local peak and is now hovering just above the current support level at 2835. This area is crucial - it previously acted as resistance and has now turned into a support area, giving bulls a chance to regroup. Based on the structure, I expect a short-term correction toward the support area, followed by a continuation to the upside. The trend remains strong, and the impulse is not yet exhausted. That’s why I set my TP at 3240 points, which aligns with the upper expansion target based on previous movement. Given the breakout, strong uptrend, and support zone now being retested, I remain bullish and anticipate further growth from the current levels. Please share this idea with your friends and click Boost 🚀
Disclaimer: As part of ThinkMarkets’ Influencer Program, I am sponsored to share and publish their charts in my analysis.

If Pulsechain reaches a penny, it would = a 325XOr around $165 billion in user-based valuation, excluding the significant portion of coins held by the founder.
It's certainly a long shot, and it would probably depend on Ethereum's price reaching well into the teens
(which, as you know, I strongly support).
Thus, it is definitely within the realm of possibility considering the low initial user base and the potential influx of individuals who will join EVMs in the upcoming years.

HolderStat┆ETHUSD seeks to $3200KUCOIN:ETHUSDT surged after breaking out of a triangle and pushing through multiple resistance levels. The latest move above $2,900 confirms a bullish continuation, with $3,200 as the next major zone. Consolidation below resistance has built the base for the current rally.

BITCOIN's PUMPs are Getting LARGER this Bull Market...However, it may take a bit longer to realize those expansionary moves.
If Bitcoin adheres to the established cycle pattern, we can anticipate a minimum surge of 103% that should carry us into the fourth quarter of this year.
Consolidation ----> Fake breakdown ----> then expansion.
Are you ready?

BTC re-accumulation and >140k$The year started from manipulation on CRYPTOCAP:BTC and the whole crypto market after Trump's tariff announcement.
Since the start of the summer season, we've already seen another manipulation between Trump and Elon Musk.
On BTC I see weekly FVG and good pinbar candle. I guess we have already entered to consolidaton and summer will also consolidation, but starting from august we will see the final uptrend with euphoria which can finish on October nearly 241.000$ on BTC, but let's see it later
I think this period will be light with base summer and $MOCHI because it's a memecoin which holds the bottom well , when in that time another altcoins are making another bottom

ETH New Analysis (12H)This analysis is an update of the analysis you see in the "Related publications" section
The previous analysis is still valid | its timeframe is higher, but in this update, we've moved to the lower timeframes.
It seems a valid bottom has been formed on Ethereum, and we may not see a lower low, provided that the price doesn't move higher first but instead drops directly into our support zone. If that happens, the price could potentially move upward from there.
Ethereum seems to be searching for a support zone to reach higher levels. The marked area could potentially launch the price upward.
In this analysis, the support zone, targets, and invalidation level have been updated.
For risk management, please don't forget stop loss and capital management
When we reach the first target, save some profit and then change the stop to entry
Comment if you have any questions
Thank You

$ETH: The 1-week chart is an absolute disaster!Once again, I want to make it clear: I’m naturally a bull. But I live in Thailand, far from the noise of influencers shouting "buy, buy, buy!" I’ve learned my lesson—when they scream buy, you get rekt. That’s why I rely solely on the charts.
Charts are just mathematics—they don’t lie. So here’s my honest interpretation of what I’m seeing for Ethereum:
🕐 Daily Outlook
Yes, we might see a few nice bounces in the short term. But if your plan is to hold ETH, you should be paying attention to higher timeframes, especially the weekly.
📉 Weekly Chart — It's Ugly
We’re clearly in a descending wedge, and overall, ETH is bearish. Don’t be fooled by the hype or the people trying to take your money.
- RSI is bearish, with a strong bearish divergence still unfolding.
- MACD is on the verge of a bearish crossover, and what’s worse, it’s doing that without even touching the neutral zone—a major red flag.
The last time we saw this setup? November 2021. The price crashed below $1,000.
🔍 Where’s the Support?
This cycle, the support zone looks closer to $1,500, mainly due to institutional interest and the ETF narrative. A full retracement seems unlikely, but technically speaking—it’s still a possibility.
🤔 Why Is This Happening Despite Institutional FOMO?
Here’s the key: ETH has staking, and every month, new CRYPTOCAP:ETH is minted to pay stakers. This creates constant inflation. On top of that, many stakers compound their rewards, accelerating the inflation. And guess what? These same stakers are selling as soon as ETH pumps.
So fundamentally, Ethereum is under pressure because of its own staking mechanics—a system flaw that creates long-term selling pressure.
Do your own research (DYOR). I could be wrong—but at least I’m not trying to sell you a course.

Symplegades Part II – Ethereum at the Threshold of Breakout or B⚔️🌉 Symplegades Part II – Ethereum at the Threshold of Breakout or Breakdown 💥🧭
In the previous post, we explored Ethereum’s mythical challenge — the Symplegades, or Clashing Rocks. That post resonated, and now… here comes Part II.
ETH is once again caught in a narrowing passage, this time defined by:
📌 $2,805 – $2,911 resistance overhead
📌 $2,616 – $2,565 support just below
💡 Pectra could be the fuel to break out — or just another wave that crashes on the rocks. The chart shows the potential for both:
➡️ A clean breakout could spark a move to “Destination 1” (~$4.8K)
⚠️ A rejection here might drag us back under $2.6K, even toward $2.1K and $1.8K zones
The Pectra breakout box is clear. But the market won’t hand it to us easily. It rarely does.
🧠 With Vitalik still “asleep,” it’s a tight spot. But if this move gathers momentum? We could be at the very start of Ethereum’s next wave.
📽️ The full video posted earlier today dives into this thesis and why macro + micro signals are conflicting but critical.
📊 Stay tuned — Bitcoin post is up next.
One Love,
The FXPROFESSOR 💙
Disclosure: I am happy to be part of the Trade Nation's Influencer program and receive a monthly fee for using their TradingView charts in my analysis. Awesome broker, where the trader really comes first! 🌟🤝📈

ETHEREUM ahead of the most critical break-out of the Cycle.Ethereum (ETHUSD) is on the cusp of a major bullish break-out as this week it is already trading above its 1W MA50 (blue trend-line). If it manages to close the 1W candle above it, it will be the first time since January 06 2025 to do so.
This whole price action remains inside a massive Megaphone pattern and resembles the same structure ETH had during June 24 2019 - July 20 2020. Both patterns had a final decline of around -67% with the 2020 structure eventually starting a (green) Channel Up that broke above the Megaphone and made a first Top on the 1.382 Fibonacci extension.
As a result, if the break-out does happen this time around also, we expect the emerging Channel Up to target at least $6300 (Fib 1.382 ext).
-------------------------------------------------------------------------------
** Please LIKE 👍, FOLLOW ✅, SHARE 🙌 and COMMENT ✍ if you enjoy this idea! Also share your ideas and charts in the comments section below! This is best way to keep it relevant, support us, keep the content here free and allow the idea to reach as many people as possible. **
-------------------------------------------------------------------------------
💸💸💸💸💸💸
👇 👇 👇 👇 👇 👇

ETH Not Taking Profits Yet – System Still Long
ETH on the 4H is pausing right at the 3D 200MA, picture perfect, actually.
Now we wait to see if this resistance flips into support.
If that happens, price could go for the 0.382 Fib level around $3,040.
Of course, that’s the ideal scenario, but the market could easily contradict me, so keep that in mind.
Personally, it’s not time to take profits yet.
Both my 4H and 1D systems are still in long positions.
For extra safety, you could set a partial take-profit just under the second-to-last PSAR dot.
Always take profits and manage risk.
Interaction is welcome.

Ethereum & monthly 20MAEthereum is gaining strength and will likely break above the monthly 20 MA. Will it maintain this momentum by month's end and remain bullish in the coming months?
Good luck HODLRS ✌️🤞

ETH POTENTIAL BULLISH GARTLEY Seeing a potential bullish gartley forming on ETH if it is unable to break above the .886 of the AB wave. Targets would be $2004 to $1786 for the .786 or 1.618 of the BC leg

ETH Pullback Before Next Rally? Hello guys!
Ethereum is currently testing a strong resistance zone around the $2,678 level, which has previously acted as a key barrier. Price action has been climbing steadily within an ascending channel, indicating a clear bullish trend in play.
However, since ETH is right at the resistance, we could see a short-term correction or pullback toward the $2,560–$2,580 support range (highlighted zone), which also aligns with the midline of the channel and previous consolidation structure.
If this support holds, a healthy bounce from this area would likely push ETH toward the next bullish target around the $2,760–$2,800 zone, which sits near the upper boundary of the current channel.
