XRP/USDT 4-Hour AnalysisXRP/USDT 4-Hour Analysis
On the 4-hour time frame, XRP/USDT is forming a small bullish pennant pattern. Using the height of the previous leg as a projection, the first target is in the green zone 1.
To change the current structure of lower lows (LL) and lower highs (LH), the price needs to form a new higher high (HH). This also requires breaking through the pink resistance zone, which is a critical level to watch.
Targets:
First target (green zone 1): $2.87
Second target (green zone 2): $3.35
It’s essential to monitor the breakout of the resistance zone and confirm bullish momentum to reach these levels.
J-xrp

Phemex Analysis #42: XRP To the Moon or Back to Earth?The cryptocurrency market is a wild ride, and PHEMEX:XRPUSDT.P has been one of its most thrilling roller coasters lately. After a meteoric 583% surge in just 30 days, many are wondering: is this the real deal, or just another pump-and-dump scheme? Unlike previous bullish cycles, this time feels different. But as the old adage goes, "past performance is not indicative of future results."
Today, we'll delve into several potential scenarios that could shape XRP's future trajectory. By understanding these possibilities, you can make informed trading decisions and navigate this volatile market with confidence.
Possible Scenarios:
1. Price Going for a 3rd Higher Top with RSI Divergence:
We can see that RSI was above 90 during the 1st and 2nd 1D Tops, and it dropped to a low of 61 during the recent dip. This is a strong bearish reversal sign. If the price insists on forming a third higher top (above $2.93) with a lower RSI than the previous two tops (below 90), it's highly likely that a price reversal and subsequent drop will occur. Exercise caution if this scenario unfolds.
2. Price Facing Heavy Resistance at $2.93:
The $2.93 level represents the highest price of the second 1D top. Many traders may look to take profits near this level after the recent decline. Therefore, it's possible that the price could encounter significant resistance around $2.93, leading to a sharp downward correction.
3. Price Going for Consolidation:
Given the substantial price increase, a consolidation phase is a plausible outcome. During this period, the price may stabilize, and a new support level may form at a higher price. In this case, you could consider entering a position during the consolidation phase and setting a stop-loss order below the recent low. Alternatively, you could wait for a clear breakout before initiating a trade.
4. Price Continuing to Drop:
If the price breaks below the $1.90 support level, it may continue to decline further. For long-term bulls, potential buying opportunities may arise at the $1.30 and $1.00 levels.
Conclusion
The future of XRP remains uncertain, but by analyzing potential scenarios, we can position ourselves for success. Whether it's a third higher top, a resistance test at $2.93, a consolidation phase, or a deeper correction, each scenario presents unique opportunities and risks.
Remember, the key to successful trading is patience, discipline, and risk management. As you navigate the exciting world of cryptocurrencies, stay informed, stay vigilant, and most importantly, stay true to your trading plan.
Tips:
Elevate Your Trading Game with Phemex. Experience unparalleled flexibility with features like multiple watchlists, basket orders, and real-time adjustments to strategy orders. Our USDT-based scaled orders give you precise control over your risk, while iceberg orders provide stealthy execution.
Disclaimer: This is NOT financial or investment advice. Please conduct your own research (DYOR). Phemex is not responsible, directly or indirectly, for any damage or loss incurred or claimed to be caused by or in association with the use of or reliance on any content, goods, or services mentioned in this article.

XRP/BTC pull back after runQuick Take!
XRP currently showing multiple bearish indicator divergences and failing to break key resistance at 2485. Looking at a price target of 2195 and 2049.
As always, keep those stops tight!

I believe XRPUSDT is heading downtownAs much as I would love XRP to pump further, I don't see it happening. Momentum has been waning for days now and it's accelerating it's dumping as we speak. I believe there might be MINOR support around the $1.90 mark, and then will hover around $1.50 temporarily, but eventually I believe it's heading back to around $0.60 - $0.70 within the next month or so.
People getting caught up in the pump really need to zoom out and starting looking at weekly charts. It's near vertical. I've been through this before back in 2017/2018.
I'm personally going to wait until it reaches the $0.60 - $0.70 level and show signs of consolidation. From there, I will start DCA'ing in.
I may look at taking a short-term trade around $1.50 to help accumulate more however.

XRP Christmas Rally Imminent! New All time high incoming!!BITSTAMP:XRPUSD Your last opportunity to get XRP at a discount before it goes parabolic is presenting itself. $1.52 -$ .1.50 is the target bottom....
If it doesn't get back down to $1.96, then that means $1.96 was the bottom, and we would backtest that level and break straight out of this bull flag pattern! 🚀
reversal of this downtrend, an ABC correction, could possibly be complete by the 11h of Dec.

XRP/USDT 8hXRP 8h Bearish Divergence
Complete retest $1.95
Next price will go there
DYOR
NFA
TYOR
Study Chart XRP


XRP !!!Hello friends
As you know, XRP experienced good growth during this period and then entered the correction phase.
Now, by maintaining the specified range, he can see the specified targets. In case of a strong failure, there are lower ranges to buy, which I will inform you about.
be successful and profitable

XRP Moonshots XRP has exploded recently but how high can it go?
The recommended at $10 which aligns with a larger channel but ive heard $55 also so ill place that there.
$10 is a more reasonable target for this coin.
Still bullish following this breakout, looking to stay bullish into Feb
Daily chart

Viewing Point: 2.2181-2.5102 Support -> 3.618 (3.2983) Up
Hello, traders.
If you "Follow", you can always get new information quickly.
Please click "Boost" as well.
Have a nice day today.
-------------------------------------
(XRPUSDT 1D chart)
I think that coins (tokens) that are renewing their ATH are in a virtually unpredictable range.
However, it is only possible to roughly predict support and resistance points based on the movements of indicators generated by price movements or Fibonacci ratios.
-
The Fibonacci ratio currently displayed on the chart is drawn using Trend-Based Fib Extension.
The selected point is marked with X.
The final point of the Fibonacci ratio drawn this way is 3.618 (3.2983).
After that, you need to draw it again using a different wave.
-
However, when the price falls while making waves, you need to think about a response plan by checking whether there is support from the movement of indicators such as BW(100), HA-High, BW(0), HA-Low, M-Signal (1M, 1W, 1D charts).
HA-High, BW(100) indicators indicate high point ranges, so if the price is maintained above the 2.218-2.5102 range, it means that it is in the high point range.
Therefore, if the price is maintained in this high point range, it is highly likely to lead to an additional rise.
If it fails to do so and falls, it is highly likely that a downtrend will eventually begin.
-
Even though the price has risen, the StochRSI indicator is in the oversold range.
Therefore, when the StochRSI indicator rises in the oversold range and becomes StochRSI > StochRSI EMA, if it is supported near the high point range (2.218-2.5102), it is expected to rise near the Fibonacci ratio 3.618 (3.2983).
At this time, the BW indicator should be maintained above the 50 point.
-
When the M-Signal indicator of the 1D chart rises to around 2.2181, if XRP falls, there is a possibility that it will touch the M-Signal indicator of the 1W chart, so you should think about a response plan for this.
-
Have a good time.
Thank you.
--------------------------------------------------
- Big picture
I used TradingView's INDEX chart to check the entire range of BTC.
(BTCUSD 12M chart)
Looking at the big picture, it seems to have been maintaining an upward trend following a pattern since 2015.
In other words, it is a pattern that maintains a 3-year upward trend and faces a 1-year downward trend.
Accordingly, the upward trend is expected to continue until 2025.
-
(LOG chart)
Looking at the LOG chart, you can see that the upward trend is decreasing.
Accordingly, the 46K-48K range is expected to be a very important support and resistance range from a long-term perspective.
Therefore, we expect that we will not see prices below 44K-48K in the future.
-
The Fibonacci ratio on the left is the Fibonacci ratio of the uptrend that started in 2015.
In other words, it is the Fibonacci ratio of the first wave of the uptrend.
The Fibonacci ratio on the right is the Fibonacci ratio of the uptrend that started in 2019.
Therefore, it is expected that this Fibonacci ratio will be used until 2026.
-
No matter what anyone says, the chart has already been created and is already moving.
How to view and respond to this is up to you.
When the ATH is updated, there are no support and resistance points, so the Fibonacci ratio can be used appropriately.
However, although the Fibonacci ratio is useful for chart analysis, it is ambiguous when used as support and resistance.
This is because the user must directly select the important selection points required to create Fibonacci.
Therefore, since it is expressed differently depending on how the user specifies the selection points, it can be useful for chart analysis, but it can be seen as ambiguous when used for trading strategies.
1st : 44234.54
2nd : 61383.23
3rd : 89126.41
101875.70-106275.10 (Overshooting)
4th : 134018.28
151166.97-157451.83 (Overshooting)
5th : 178910.15
-----------------

XRP 4H. Preparing for a Breakout. 12/08/24Ripple is currently trading sideways, and this consolidation phase is likely to continue for some time.
Let me share some insights with you: indicators in technical analysis provide various insights into the market's condition, such as whether it is overheated or oversold. When these indicators deviate significantly from their normal levels (e.g., overbought or oversold conditions), they may generate false signals. Sideways movement helps "reset" these indicators to more normal levels, which is exactly what’s happening now.
During a sideways phase, traders buying and selling the asset frequently rotate, preventing significant price movements. This is crucial for analysis, as it may indicate the market is preparing for the next significant move, such as a trend.
In summary, periods of no clear trend are essential for the market to allow indicators to normalize and trader rotations to occur, creating the conditions for the next price movements. So, hold and wait.
Forecasted movement is shown on the chart.
DYOR.

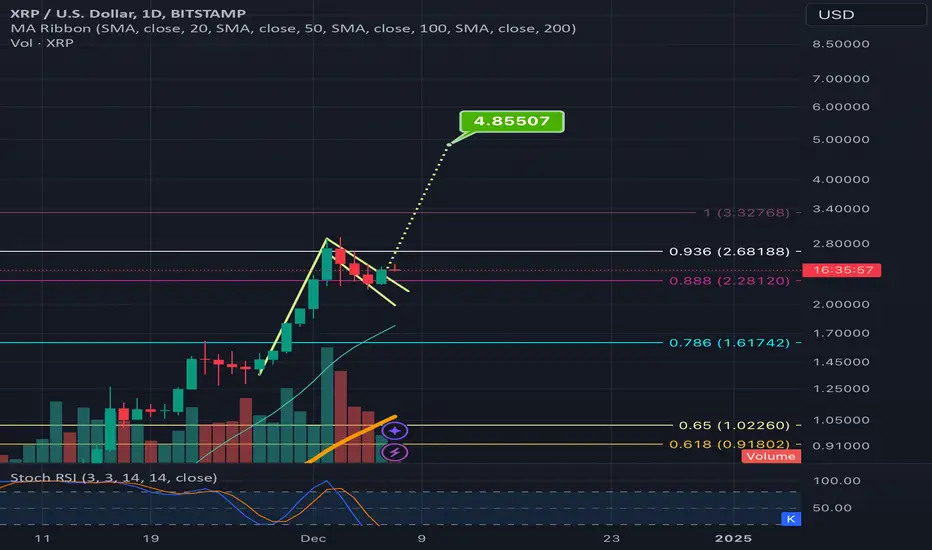
A clue of where xrp can head based on it being a fractal of 2016Ok this will be a slightly extensive dive into how the current breakout move from the multi year triangle that xrp just broke out of has a high probability of being a fractal of the triangle pattern breakout move xrp did in 2016 that yielded explosive parabolic bullish price appreciation. I want to start with this image on xrp on the Monthly chart to show how the first monthly candle that confirmed the breakout of the 2016 triangle went up 287 percent and the first monthly candle confirming the current breakout went very similarly to around 283%. So since we already have it following that same pattern there, I’m gong to extrapolate where price could head from here if we are needed mirroring that same explosive move of 2016 with our current price action. If so, the very first spot XRP had a pullback and then consolidated into a bull flag before heading further up was actually at the 1.038 fib level which is just 13% or so above its previous all time high. If we were to do something similar today we could see xrp’s first real significant pullback consolidation around $3.75-$3.77. This is in line with certain chart patterns breakout targets I have in mallet time frame charts that I don’t have shown here. Other chart patterns in those smaller time frames have a targets around $3.80, $3.84 and some as high as $4.06 and then on the logarithmic chart as high as $4.77-$4.85. I think even as high as $45 would still fall in line with a standard deviation away from the 1.038 fib and would still retain the fractal if we were to reach the top logarithmic target before having that first pull back. We can see on the left of the chart above on the first triangle breakout, after it moved on from the 1.038 level the net level it rose to before the first significant correction s all the way up at the 1.618 (in blue). If Xrp were to maintain the fractal in current price acton then the 1.618 should be its destination to before the first ajar correction, and as you can see the 1.618 for the current Fibonacci retracement is all the way up at around $26!

XRP updated price analysis & forecast: 3.1-3.3 is coming soon!!updated analysis on most recent price action indicates a strong buy sequence to 3.1-3.3 range to occur over this next wk, TO BE FOLLOWED BY the FINAL (aggressive) retracement to 1.5 -1.6 zone!!!
**if we get any dips in price to 2.15-2.2 range BEFORE running to 3.1-3.3, it'll remain a buy opportunity imo until 3.1-3.3 is reached...
I'm expecting the final discount window to occur by 12/12-14 dates...should witness the selloff/retracement in price to the 1.50 liquidity target level, which will be an amazing final chance to increase XRP position size after taking partial profits around 3.1-3.3 (my thoughts/trade plan)

$xrpCRYPTOCAP:XRP 4H 📈
#XRP has started to rise again in a short time period of its parabolic run on a macro scale.

XRPUSDTAfter the pump, enters the Corrective phase
The trend line has been broken and confirmed
The target is valid until bottom is not broken

Logarthmic bullflag has an even larger breakout targetBrace yourself and fair warning this post is gonna get slightly more esoteric than some are comfortable with as it delves into numerology, so fair warning. I found it extremely interesting from a numerological standpoint when I saw @chartguy had predicted that this current xrp correction would ultimately find support on the .888 Fibonacci retracement level and as of now it appears it has. The number 38 as well as 888( aka 3 8s) has been coming up like crazy all the time for me this entire year, but then I also noticed it more than a few times specifically in reference to ripple and xrp. For example Ripple now has 38 billion xrp remaining locked in escrow. I found an iage during XRP’s 2016 pump of Brad on CNBC or fox business ot some channel like it and enxt to them they had put a graphic up on screen along side Brad Garlinghouse that said XRP had gone up 38,000% percent. Next fast forwarding back to a little earlierthis year, the last low xrp had put in as a bottom before finally slowly climbing back up to the blast off point was 38 cents. Because I had been seeing all these connections with 38 in regards to xrp and ripple but also in many other elements in my personal life, I bought some more xrp at 38 cents feeling like it would actually mark the most recent bottom and low and behold it did. Also the all time high for xrp on a few different exchanges is $3.80. Like I said above, another way to represent 38 is with 3 8’s aka (888). So on the lion’s gate portal this year 8/8/2024, 2024 numerologically reduces to 8 as well giving us the first time in quite awhile we have had 8/8/8 date like that, I was expecting something noteworthy to occur being that it’s a time that’s known for manifestation and abundance every year but with 3 8s instead of just the usual 8/8 it should be even more so, and sure enough ti was right on this weekend that Judge Torres issued her final judgement in the RIpple vs SEC case after 4 long years of waiting patiently for it to arrive. All this being said, when I then see that XRP corrected down exactly to the .888 Fibonacci level and is holding support there, if it does continue upwards from this level, it will simply be more confirmation and confluence to me that there is something significantly special and interrelated between xrp, and the numbers 38.88,888, 11, and 1111. I won’t go into the 11 significance too much in this idea as I’d prefer to focus on the 8s instead….so I’ll leave the numerology talk there for now and focus instead of the actual TA behind this logarithmic bullflag
XRPUSD currently retesting support on the double bottom necklineWe currently have one weekly candle close above the double bottom neckline and the currently weekly candle is still currently holding support on that same neckline with 3 more days left to go before it closes. A close above the neckline would certainly be a bullish sign especially when the entire candle’s body closes above such a resistance level. Considering Trump just appointed PayPal Mafia’s David Sacks as cryptocurrency/AI czar,I think probability favors a breakout up fro XRP’s double bottom pattern. Were price to confirm the breakout from the spot it just recently broke above the neckline at, then the full breakout target will be $4.0422 a most auspicious number full of multiple numerogically encoded 11-11’s. I also think if we are fractally mirroring 2016’s huge breakout move, that $3.80 or perhaps 3.84 could be an important level to watch also both very auspicious numbers as well, though the 4.0422 target would be preferred considering it would make for a new all time high. Whichever one it may be they will all get reached eventually this bull run in my opinion. *not financial advice*

Bullish XRP ScenarioMacro Cup & Handle with a fractal backbone. Room for upside on our indicators as well.
A bullish Q4 will result in this scenario!
Ripple winning their lawsuit and the relisting of XRP will make this scenario come true from the fundamental standpoint!

Continuing the parabolic increaseIf XRP continues to stay within the upward channel, the potential peak could be a new record, reaching around $4.

*Updated XRP 30m Analysis 06/12 Analysis:
To start this analysis off lets make it clear, XRP WILL long term reach $1000+, I am extremely confident that the use case and real world utility outweigh how undervalued the currency right now.
Following on from yesterdays analysis.
We could be seeing some consolidation within this zone which I have marked.
Firstly taking a deeper look into internal structure, We can see that price appears to be creating HL and HH which indicate a iBOS and also potentially iCHoCH.
The confluences I'm looking for next would be a HL once again, followed by a HH. However taking into account the overall short term trend, we are bearish as this is just a correction for price and If it was to come down to the M30 Swing low or even better the Supply zone I've marked I will be looking to add more long positions at this level.
To consider:
INTERNAL Break of Structure
If price creates LL below M30 Low
If price creates HL internal structure
FOMO and Paper hands

250% Profit XRPThis chart for the XRP/USDT pair in the 4-hour timeframe presents a potential technical analysis predicting a 250% profit. Here's a detailed breakdown of the analysis:
Overall Trend Analysis
Clear Uptrend 📈
The chart shows a strong bullish movement, with the price increasing from the initial support level of $1.1865 to a local peak at $2.5905. This indicates significant upward momentum in recent days.
Key Support and Resistance Levels 📊
Major Support at $1.950: A crucial level where the price might bounce again.
Main Resistance at $7.0264: The final target predicted by the analysis, indicating a 250% profit potential.
Correction Zone 🔻
Several support levels exist in the correction zone:
$1.9932
$1.5282
$1.1865 (a strong support area).
Possible Scenarios
Bullish Scenario 🚀
If the price holds above the mid-level supports, it could rally towards the target of $7.0264. This suggests a highly optimistic outlook for XRP.
Bearish Scenario 📉
If the price breaks below $1.5282, it might drop further to lower levels like $1.1865 or even $1.1556.
Key Notes and Warnings ⚠️
Reaction to Fibonacci Levels: The chart appears to respect Fibonacci retracement zones, showing a correction phase before a potential upward continuation.
Risk Management 🛡️: Traders should carefully manage their positions with stop-loss levels near key supports (e.g., $1.9539).
Volume Dynamics 📊: Increased or decreased trading volume around these levels could confirm potential breakouts or reversals.
Summary 📝
This analysis suggests a 250% profit opportunity for XRP. However, traders must monitor how the price reacts to the support zones before making a decision. If the broader cryptocurrency market remains positive, this target is achievable. 💎

XRP will RunXRP is currently in a consolidation phase as it seeks to establish new highs and lows. The Relative Strength Index (RSI) indicates that XRP is undervalued, suggesting it is aiming to find new lows at higher price levels. The candlestick patterns are following an upward trend line, and both the 20-day and 200-day moving averages remain positive after experiencing a golden cross around November 10th. There are many positive signals that support a bullish outlook for XRP.
Fundamental analysis indicates that XRP has a promising future, with new leadership at the Securities and Exchange Commission (SEC) and fresh partnerships fostering the institutional adoption of blockchain technology. These initial price movements are just the start of increased exposure for XRP.

XRP 30m Analysis 06/12Analysis:
This is just a correction!!!
Don't sell XRP under $5.
Currently we can see that price has pulled back and has changed character into a temporary downtrend. I would assume this is due to people selling their XRP and securing profits due to lack of knowledge or confidence within XRP.
It appears internally to be creating LL and LH. The current swing high and low are indicating the potential next moves:
HH - If the next move is a HH we will be waiting for a HL confirmation before taking out $3+
LL - If the next move is a LL we will be looking for long positions within our Supply zone around the $2 area.
As always XRP is the best crypto available to invest in and whilst its as cheap as it is now it will not be this price forever.
To consider:
Pullback
FOMO
News and Speculation
