GJ WAIT FOR BREAK!Shared idea for ranges to get an average of 20 pips if price goes either way! Please be patient. Waiting PAYS! ITS RANGING....
Japan


JAPAN 225 BULL FLAGReally simple bull flag set up, also for my followers you will notice the rvi bullish cross. look to trade the continuation pattern on the pullback or stop loss as placed. We may see some yen depreciation on oil strength as the catalyst for this move, look out for news events also.

Post-election breakdown of DOLLAR-YEN[Target 100]A short post, with few important points:
With record low interest rates globally, the carry trade with the short-side in yen is somewhat losing its popularity. Some of the reasons why are:
=> The carry premium isn't worth the risk any longer. Lately currency markets have been quite volatile, question is whether this will continue. If we get a somewhat more stable environment in developed markets, carry sharks might look elsewhere for the following reasons...
=> Record low rates globally, even further squeezing the positive carry spread, however now that all the key rates globally are at the ZLB (prospects even to go below it), the importance of inflation is ever more accentuated. Why'd you even enter a long carry with a short side in yen given the inflation differential, with Japan potentially going into a deflationary environment?
=> Lastly, we're in a new paradigm where it's questionable how long would it take for emerging markets to recover from the virus, and the grading of their government bonds is starting to become questionable.
There are other points of course, but principally Biden after all might get a weaker dollar after all, thanks to MMT. On one side, too little stimulus implies a potential credit crunch/crisis, and too much stimulus= devaluation. Obviously, devaluation is without any doubts the better choice.
The rest is summarized by the chart.
-Step_ahead_ofthemarket
________________________________________________________________________________________
>>I do not share my ideas for the likes or the views. This channel is only dedicated to well-informed research and other noteworthy and interesting market stories.>>
However, if you'd like to support me and get informed in the greatest of details , every thumbs up and follow is greatly appreciated!
Disclosure: This is just an opinion, you decide what to do with your own money. For any further references or use of my content- contact me through any of my social media channels.

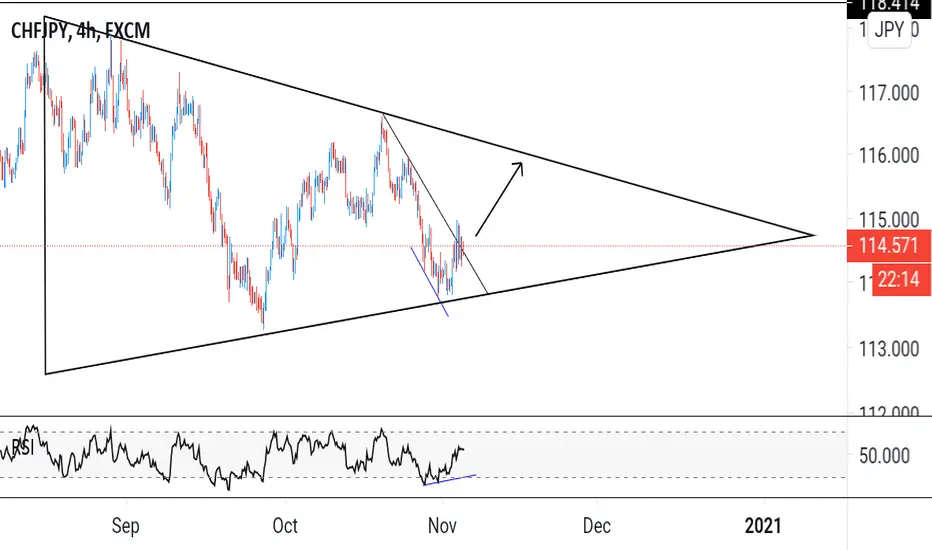
CHFJPY - Rejection of pennant pattern support 🔼CHFJPY bounced off the pennant pattern support.
The market brokeout above the minor downtrend resistance.
RSI printed a bullish divergence signal.
Buy signal ⬆️.
Support and Resistance - Most Important Zones for USD/JPYIn this technical analysis I show a long trade set-up for USD/JPY using horizontal support and resistance. All info and explanations can be found on the chart.

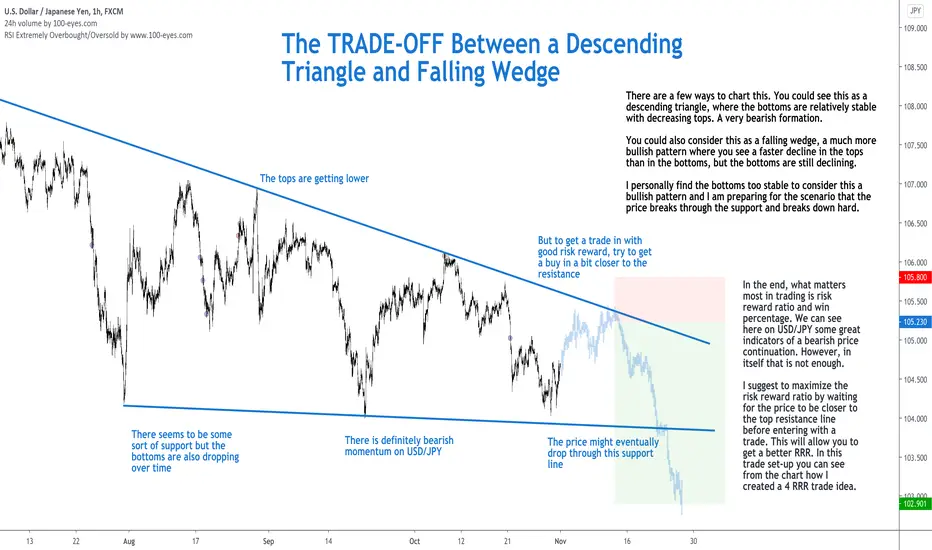
The TRADE-OFF Between a Descending Triangle and Falling WedgeThere are a few ways to chart this. You could see this as a descending triangle, where the bottoms are relatively stable with decreasing tops. A very bearish formation.
You could also consider this as a falling wedge, a much more bullish pattern where you see a faster decline in the tops than in the bottoms, but the bottoms are still declining.
I personally find the bottoms too stable to consider this a bullish pattern and I am preparing for the scenario that the price breaks through the support and breaks down hard.
In the end, what matters most in trading is risk reward ratio and win percentage. We can see here on USD/JPY some great indicators of a bearish price continuation. However, in itself that is not enough.
I suggest to maximize the risk reward ratio by waiting for the price to be closer to the top resistance line before entering with a trade. This will allow you to get a better RRR. In this trade set-up you can see from the chart how I created a 4 RRR trade idea.
Follow me for consistent high quality updates, with clear explanations and charts.
Please like this post to support me.
- Trading Guru
--------------------------------------------------------------
Disclaimer!
This post does not provide financial advice. It is for educational purposes only!
AUD/JPY BATTLEPLANIM NOT F*****G LEAVING! AUD/JPY LOOKS good to buy on daily chart , reverse engineer this process and we could see higher gold and lower oil . dont be surprised for a dxy reversal and a long set up occuring in /USD pairs. after this sell of presents a good time to buy FEAR. and we LOVE fear.

USD/JPY Maximize Your Risk-Reward With This Simple Trick!In the end, what matters most in trading is risk reward ratio and win percentage. We can see here on USD/JPY some great indicators of a bearish price continuation. However, in itself that is not enough.
I suggest to maximize the risk reward ratio by waiting for the price to be closer to the top resistance line before entering with a trade. This will allow you to get a better RRR. In this trade set-up you can see from the chart how I created a 4 RRR trade idea.
Follow me for consistent high quality updates, with clear explanations and charts.
Please like this post to support me.
- Trading Guru
--------------------------------------------------------------
Disclaimer!
This post does not provide financial advice. It is for educational purposes only!

GBPJPY Price Still under Bears Control !Trade Analysis BASED on Fundamentals and Price Action.
With Risk management You Will Never Loss.
Thank You

Don't Trade USD/JPY Before You Looked at These Factors!Trading is all about buying low and selling high. Here on this USD/JPY technical analysis I will explain what you need to take into account if you want to enter a trade.
First of all, I want to highlight the previous idea that was incredibly successful on USD/JPY using these same principles:
In this idea it is important to note that the price is not near any horizontal zone at the moment. I suggest to wait to get a better risk reward on your coming trade.
The buy low and sell principle is all relative and defined by the current information available. I define low and high as the horizontal resistance zones.
For our short position we want to reverse the logic and sell as high as we can, in this case near the zone of horizontal resistance.
Follow me for consistent high quality updates, with clear explanations and charts.
Please like this post to support me.
- Trading Guru
--------------------------------------------------------------
Disclaimer!
This post does not provide financial advice. It is for educational purposes only!


cadjpy short termdaily uptrend means we might be able to sneak a bullish entry on this bounce and take some pips


USDJPY Trade ideaUSDJPY in quite a critical area.. I am bias short
Share your thoughts in the comments below
Like and follow for more content
Good Luck

EURJPY Entry 124.292 Exit 122.517 Stop Loss 124.792EURJPY Entry 124.292 Exit 122.517 Stop Loss 124.792
Risk 50 Pips
Reward 177.5 Pips
R Multiple 3.55R
Risk $1000.00
Lotsize 2.111 (211,104)
Pip Value $9.4740
Risk $100.00
Lotsize 0.2111 (21,110)
Pip Value $0.94740
Risk $10.00
Lotsize 0.02 (2,111)
Pip Value $0.094740

RidetheMacro| USDJPY Outlook 2020.09.19📌the USD/JPY currency pair reached one and a half month lows this week at the middle of the 104th figure. In this price area, the southern momentum has faded and now traders are at crossroads: on the one hand – the weakening greenback which again began to lose its positions and on the other hand – the lack of weighty arguments for continuing the downward movement. The results of the September meeting of the Bank of Japan and the data published today on the growth of Japanese inflation did not provide any clarity as the USD/JPY pair continues to trade against the background of a contradictory fundamental picture.📈
🏦 the BoJ said in its Sept. 17 monetary-policy statement. “The pace of improvement is expected to be only moderate while the impact of COVID-19 🦠 remains worldwide.”
The Japanese economy shrank 7.9% on quarter in Q2 2020, compared with the preliminary reading of a 7.8% decline and market consensus of an 8.1% drop, and after a 0.6% fall in Q1. This was the third straight quarter of contraction and the steepest on record, amid the severe impact of the COVID-19 crisis. Private consumption tumbled, falling for the third straight quarter (-7.9% vs -0.7% in Q1)
📍 Any material shift in this regard may be exacerbated by a contraction in global growth, with capital flight into the dollar
Like, subscribe and leave your comments below! 🤝
Until next time,
Ride the macro

ridethepig | Nikkei Market Commentary 2020.09.19📌 The Nikkei would have freed some space to the downside with a technical break last week, but given that we have not pierced the support line and buyers are still well-placed we must be wary of a retest in the highs of the multi year top at 24,000 - the same level we have been tracking since 2018!!
The more interesting notion comes from the Global Equity board with breaks being led by NY and following through with Europe on the quadruple witching flows.
A simple move here would be playing the breakdown for a quick test of the 200 day MA which is +/- 22,000 and on the other perhaps opening up the panic leg towards the lows at 20,300 if the rest of the flows play along. Any moves to the topside lack conviction and the RSI destroys all winning chances for buyers as we approach the highs.
Thanks as usual for keeping the feedback coming 👍 or 👎

Sell USDJPY as you can see in my Technical Analysis, the price breaks the box and it goes down.
As it approach the box again it has a higher chance that it wilgo back again at the bottom given the move

AUDJPY FOR A SELLAUDJPY FOR SELLS
Share your thoughts in the comment section below
Like and follow for more content
Good luck!!!

GJ Potential Long PositionThe market is in an acending channel, with price showing strong rejection of the lower bound of the bullish channel. The downside potential of this market, is relatively low ceteris paribus, as the market would have to break structure to form a new price level below the current channel. The price has shown rejection at 3 key levels, indicating a three phase movement, thus 3 potential entry positions. It is likely that the market will continue to consolidate, as price tends to contract after large expansion(volatility) which can be viewed by the strong bearish momentum from the top of the channel. Continuing, entry after a re-test of this key level or strong bullish momentum would be advtangeous to maximise R:R as price is at the bottom of the channel and near an area of value as indicated by the 50EMA on the hourly time frame and confluencing the bearish trend line.
From a fundamentals perspective the pound has shown volatility due to a rise in the Claimant Count, increase in COVID-19 cases and operational/capacity problems with the NHS Track & Trace system. However, Japan is ushering in a new Prime Minister due to the departure of Shinzho Abe with Yoshihide Suga widely expected to take the role up. However, his poitical philisophies are unclear and he is entering the job at very uncertain times for Japan who have nearly exhausted their use of monetary policy tools to increase consumptions and a large fiscal stimulus package which has worried some due to its size and its impact on public debt. In short, both countries are in predicaments which should overall offset one another and allow the continuation of the bullish trend.

EURJPY - Short IdeaI have a Bearish Flag showing...trade safe this week!
You can see where I have tucked my stop, using a key Fib level.
2:1 RR, 1% risk.
