Japan


Aussie Vs Japanese Yen (AUD/JPY) Trade Plan Traders seem to be in risk aversion mode to start the week off of negative developments in the U.S.-China trade story. With fear on whether or not we’ll see tariff rollbacks on China, odds have risen that the trade deal may not go forward. This has sent equities, bond yields and oil lower, and seems to be supporting the safe-haven currencies like the Japanese yen.

Nikkei USDJPY ratio at a very significant levelTVC:NI225/USDJP is at the same level it was in 1991,1995,1997,2018. The horiztontal trendline extends from 1990-2019 nearly 30 years. A closing above this trendline on a monthly basis will signal a bullish scenario in the Japanese stock market in my opinion.

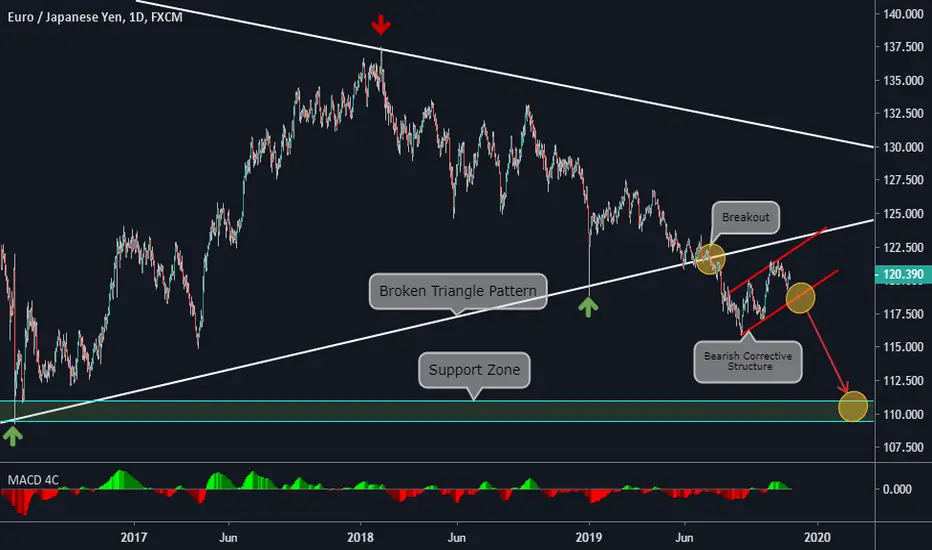
"EURJPY: potential down move" by ThinkingAntsOkDaily Chart Explanation:
- Price the Weekly Triangle.
- Price is currently on a Bearish Corrective Structure.
- If price breaks the Structure, it has potential to move down towards the Support Zone.
Weekly Vision:
Updates coming soon!
GBPJPYAveiq Capital Management Group
15th November 2019
GBPJPY has been in a strong uptrend. We saw price reach the 141.000 area and has since been ranging. We are expecting a break to the upside. A good entry would be from the bottom of the range or current price area. We are targeting the 143.000 banking level which gives us a yield of 3.00%.

GBPJPY - Buy OpportunityGBPJPY has been in a strong uptrend. We saw price reach the 141.000 level and has since been ranging. We are expecting a break to the upside. A good entry would be from the bottom of the range or current price area. We are targeting the 143.000 level which gives us a yield of 3.00%.

GBPJPY SHORTPrice looks overextended for this pairs long term downtrend. There is a lot of indecision going on around 140.00

USDPY - Buy OpportunityIf we look at DXY, we can see that it is currently very bullish. We are expecting moves to the upside. We have an area marked out at the 108.65 level. We are taking entries at current price. We may experience some consolidation at the current price area before seeing that move up. Based on price action, we can see that there is still a majority of buyers within the market.
We are targeting the 110.9 area which gives us a yield of 2.00%.

USDJPY Aveiq Capital Management Group
14th November 2019
If we look at DXY, we can see that it is currently very bullish. We are expecting moves to the upside. We have an area marked out at the 108.630 level. We are taking entries at current price. We may experience some consolidation at the current price area before seeing that move up. Based on price action, we can see that there is still a majority of buyers within the market.
We are targeting the 110.9 area which gives us a yield of 2.00%.

USDJPY SELL IDEAUSDJPY SELL IDEA , a clear rejection followed by a pin bar, Kindly share your thoughts in the comments section.
My previous idea for usdjpy buy can be closed at breakeven. thank you.


EURJPY SHORTMy algorithms show multiple confluences for a short entry for this pair. I am currently in, I see price is currently below the 200 day average along with multiple candlestick patterns that signal an entry. I will be taking price down to 118.00 support where many buyers will be looking to enter as it signals a bounce off of a short term trendline. Trendlines have an extremely high failure rate in the smaller timeframes and banks know this stuff. Further analysis will be made after this trade completes.

Way to go in chf vs yenThe Swiss franc's rise against the japanese yen is extending into a third week now with almost zero interruptions in daily terms. The yen continued to lose steam over the September drop in Japanese exports. Looking at the chart, 110.85 will a crucial point if the rise continues. But before reaching there, we should watch the 110.50 line.


Potential bearish double top for AUDJPYIf my EW counts are correct, we could potentially see 71.307 area for wave 5.

When to enter a trade in Nintendo.Here we can see the stock makes a pennant. We should wait it to cross the upper line and then buy it.

4519, Chugai Pharmaceutical Co. - Breakout on ascending triangleTSE:4519
Net breakout of the resistance of this ascending triangle.
As always, one of the parameters for deciding whether or not to enter our trade is the Yield Risk ratio, in which winning trades allow us both to compensate for the small losses we make 60% of the time and to create that extra margin for regular profitable activity.
Remember: Trading is an activity like any other and you must undertake it as a professional and not as a gambler looking for the winning trade of life ...
finance.yahoo.com

Fed's decision and dollar reaction, the CB of Japan and EnglandFed Decision: Interest rates cut by 25 basis points after FOMC meeting.
The Federal Open Market Committee decided to lower the rate to 0,25%.
FOMC does not have a fixed position: some members believe in further reduction, other members voted against any further reduction at this meeting. So could observe the lack of dollar sales.
Different positions are understandable. In the last couple of weeks, the US economy has shown good outcome, so the Fed may well take a break in easing cycle.
As for the USA. Statistics on the real estate market in the United States were published yesterday. The figures came out more than good. So, the start of construction indicator increased by 12.3% m/m (forecasts + 5%), and building permits in August grew by 7.7% m/m (analysts expected an average decrease of 1.3%).
In general, talking about a downtrend in the dollar is premature, and even a correction in the dollar value is in question. However, today we will continue to look for points for selling the dollar.
Today, the Bank of Japan has traditionally left monetary policy parameters unchanged. The Bank of Switzerland is also expected to leave the rate unchanged. However, both of these Central Banks are pursuing an ultra-soft monetary policy, there is simply nowhere to lower rates.
The Bank of Japan has not yet held a press conference following the meeting when we were completing news background. If there are no surprises, then our position is to buy the Japanese yen today. First of all, against the dollar and the euro.
The pound was under pressure yesterday. This was due to both statements by the EU that the risk of exit without a deal and macroeconomic statistics from the UK. Consumer inflation came out below per cent. Weak inflation on the eve of the Bank of England decision announcement on the parameters of monetary policy is a sign for pound sellers activation. Total up to the verdict announcement we prefer to stay away from pound positions. Moreover, before that, data on retail sales in the UK will be published. Since the Bank of England will announce the decision today, we will present our adjusted position on the pound tomorrow.
In the end, the pound is not the only instrument for trading. Gold purchases from local lows continue to be relevant. As well as oil sales from local highs. The situation with Saudi Arabia seems to have stabilized and markets generally calmed down.
