Ueki Corp - points to significant Japanese equity undervaluationShort term - short (but not in a position so just waiting),
Medium + LT term long.
Why? Well a couple of reasons. Despite the retraction in sales and profits in the construction industry in Japan as evident from Ueki's results there are some rather signs of value.
I haven't even started a full accounting of undervalued Japanese stocks yet but can see that I will likely buy because:
- Ueki's market cap, for example, is almost 63% lower than its net assets. Compared to U.S. equities that is comparably significantly undervalued. As at December 2018 the average S&P 500 price to book ratio was 2.8 (and this was AFTER the December price drop). Compare that to a P/B value for Ueki of 0.35. i.e. The Company could be liquidated now and would return significantly more than the current price per share to investors.
- Investment Banks are entering long the market - seeing the market as oversold: www.cnbc.com I also read an article a while back that said Morgan Stanley is advising clients to exit US equities which will cause many to look elsewhere in the US and overseas for better value risk adjusted returns: www.investopedia.com I'm not sure if that is the one though,
- Likely due to having been in a 30 year bear market, the Japanese equity market likely has, on average, less downside risk as compared to US stocks: www.bloomberg.com
- My TA points towards a significant appreciation of the JPY vs the AUD, USD, and EUR. If this happens, any returns will magnified. Despite its significant debt load (230% of GDP+) Japanese citizens are willing to take a financial hit buying government bonds with negative interest rates in order to support their Country.
- There are likely better, if not more undervalued, equities out there than Ueki. I feel encouraged to search for some deals.
Thanks for viewing
Japanese-yen

AUDJPY Demand zone?77.5- 78 is Strong Demand zone for this pair, Keep an eye on it for bounce or get into longs already, Good luck ;)

The Dollar Against the Yen Really Wants to Stay Above 111The US dollar has rallied significantly during the trading day on Thursday this week, reaching towards the ¥111.50 price level. Resistance range from this level goes all the way to the ¥112 meaning it will be very interesting to see whether or not the market can break out above that 50 pip range. If in fact it does, that could send this market significantly, at least to the ¥113.50 level. But its important to keep in mind as well that there are several trend lines of resistance I am tracking and only one of them, the one which only stems back to late 2018, has been broken. However, there is little follow through and a bit more action to the upside is required in order to determine that this resistance is no longer meaningful.
On the other side, if price action breaks down below the lows of the Wednesday bar, then traders are probably going to look towards the ¥110.75 level, and then possibly even further lower to the level of around ¥110. That said, it’s not until we get the jobs reports numbers that traders can put serious money to action due to the fact that quite bluntly the possibility for an increase in variance, beta, or volatility (pick your terminology) is extraordinarily high given the significantly low levels of volatility traders have suffered from over the past few months across asset classes. This pair tends to be very sensitive to jobs figures, so therefore we need to be very cautious and recognize that we need to give the market at least a couple of hours after that announcement. With that being the case, there isn’t much to do between now and then. However, we need to recognize how the market reacts to those figures once the machines get done trading and traders start to digest the announcement.
Quite bluntly, it is most likely the best tactic to be patient and wait until Monday morning to determine if the trade is ready to be executed and to see where price action rests from overnight trading. On the other hand, for those of you who want to trade a little more rapidly, traders could take the chance to wait until 12 PM on the Street in which quite often they will see what the market is going to end up doing anyway.

GBPJPY Symmetrical TriangleLooking for upside break on this pair..! Bounced already off from the support of trend-line

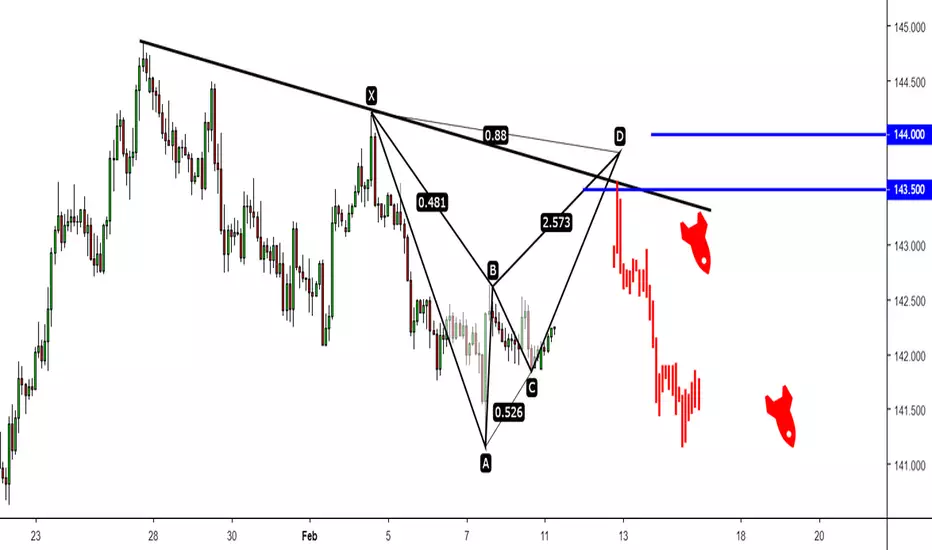
Waiting to sell GBPJPYI will wait GBPJPY until the bat pattern complete and sell in this zone which is match with the trend line
USD/JPY has no resistance on TuesdayThe US Dollar found support against the Japanese Yen on Tuesday morning. Namely, the lower trend line of a medium term channel up pattern provided the needed support to stop the recent short lived decline.
Moreover, during the morning hours the currency rate passed the 55-hour simple moving average’s resistance at 111.20. The SMA began to provide support shortly afterwards.
Meanwhile, the pair faces no notable resistance as far as the 111.80 level, where close by a monthly pivot point is located at.
Due to these factors combined, a surge in the upcoming trading sessions could be expected, during which the pair might gain 60 base points.

USD/JPY daily overviewThere are almost no changes on the USD/JPY currency exchange rate’s hourly chart. Namely, the pair has traded sideways while being supported by the 55-hour SMA and being restricted from surging by the 100-hour SMA.
However, note that the 100-hour simple moving average was pierced on early morning of Friday’s trading session.
In general, the rate is set to continue trading sideways until it reaches the additional support of the 200-hour SMA and the lower trend line of the medium term ascending pattern.

USD/JPY finds support in SMAAfter booking a new high level against the Japanese Yen, the US Dollar retreated during the early hours of Monday’s trading session. However, by the middle of the day the currency exchange rate had stopped the decline.
Namely, the decline was stopped by the support of the 55-hour simple moving average near the 110.60 mark.
Moreover, the currency exchange rate was expected to surge even more in the upcoming trading sessions. The basis for this assumption is the fact that above the currency exchange rate there were no resistance levels up to the 111.30 mark.

USDJPY - watch for a bearish reversalUSDJPY is about to start a downride on daily as you see. It reached the fib arc and repeats the bearish reversal patterns from the past waves. Follow the price to complete that bearish pattern it copies from the past and once it hits the fibonacci arc, we go for a down slide. Then watch for reactions or pullbacks at Gann angles. Every Gann angle line acts as support which price has to break. We can also do Elliot wave wave count once price starts moving downwards. We take TP once Elliot wave 5 is completed! It agrees with our geometrical arc analysis on XAUUSD which is about to start a ride up. Gold and USDJPY 0.02% have negative correlation (-65.5 percent on daily), as you know. You can also short Nikkei (JPN225) as they have +78 % positive correlation. If one thing goes up the other down. Our analysis confirm this correlation.

SGD/JPY 1H Chart: Singapore Dollar bullishThe SGD/JPY exchange rate is moving in an eight month descending channel. The pair tested its bottom boundary near 79.60 late in March prior to reversing its sentiment and reaching the other boundary last week. Strong upside risks prevailed in the market on May, thus sending the pair 1.5% lower within a couple of hours.
As a result of this plunge, the Singapore Dollar breached a two-month trend-line at 82.00 and has since fallen even lower.
Technical indicators demonstrate that the pair might still move slightly lower until 80.00 in the short term, but it should pick up momentum within the following week and begin a medium-term appreciation. The pair faces a strong resistance level formed by the monthly and weekly PPs and the 200-hour SMA at 82.00.
The Singapore Dollar is likely to hinder near this area for a while, but it should afterwards pick up momentum and target 85.00.

EUR/JPY reveals descending patternThe common European currency passed the long term support against the Japanese Yen almost as soon, as such a move was speculated on Friday. Since then the rate has fluctuated even above the previous support and made two attempts to surge.
However, it failed and instead revealed that there is a clearly spottable descending channel pattern. The pattern was set to guide the currency rate down to the support of the weekly S1, which is located at the 131.86 level.
Although, it is likely going to occur only when the resistance of various hourly SMAs reaches the rate.

EUR/JPY acting as expectedThe recently discovered now dominant channel up pattern on the EUR/JPY currency pair’s charts has been once more confirmed. Moreover, the expected decline of Tuesday occurred exactly as forecast by our analysts.
However, let us concentrate on the future. The currency pair has surged after the confirmation of the dominant channel’s support and broken the previously active descending junior pattern. Although, the surge had ended by the middle of Wednesday, as the rate had bounced off the previous high levels.
In regards to the near future, Dukascopy analysts expect the pair to reveal a new junior ascending pattern.

CHF/JPY Bounces off strong resistanceThe Swiss Franc is a safe haven currency, where funds flock to, if there is an increase in risk in the markets. The Japanese Yen also is a safe haven currency. However, if one puts them one against another, one can not just speculate technically, but also avoid some of the fluctuations to and from risky and conservative assets.
Regarding the technical picture, the rate recently bounced off a massive resistance cluster near the 111.50 level and began a decline. During the decline the pair once more confirmed the existence of a long term channel down pattern.
Moreover, recently the rate failed to regain its losses, as it failed to pass the 111.00 mark, where the weekly S1 is located at.

USD/JPY daily overviewDue to the fluctuations caused by Jerome Powell's testimony on Tuesday, which broke all previous junior and medium scale patterns, a broader look at the USD/JPY currency exchange rate is done.
In general, the pair has revealed a long term channel up pattern in the borders of the long ago spotted dominant descending channel. In addition, there is another notable pattern. As the pair rebounded against the ascending pattern's support, it formed an up trending pattern.
Meanwhile, on Wednesday the rate was set to meet with a strong support cluster near 107.0, which would propel it to test dominant resistance near 107.80.

EUR/JPY continues to surgeThere have been minor developments in the situation on the EUR/JPY hourly chart. By the middle of Monday’s trading session the currency exchange rate had extended the surge, which began last week.
However, one development has taken place. If one compares the now observable channel up pattern, it can be noticed that it is different. There have been minor adjustments of the trend lines of the pattern. On Monday the pattern was drawn in a way, in which both trend lines have been confirmed at least twice.
The surge is likely to continue until the pair reaches a notable resistance level.

GBP/JPY 4H Chart: Pound gains groundThe highly demanded GBP/JPY currency pair has continued to surge. However, it has not occurred in the previously drawn long term channel.
Instead there have been various non-forecasted fluctuations. Although, such events are in general expected from this exchange rate. Due to that reason the Dukascopy research team has adjusted also the long term patterns.
In regards to the near future, during the review a junior channel up pattern was mapped. It is highly likely that this channel together with other support levels will force the rate through the monthly R1 and push higher.

AUD/JPY 4H Chart: Approaches dominant resistanceThe Australian Dollar is about to touch a dominant resistance line against the Japanese Yen. Most likely the move will result in a bounce off to the downside. If that scenario occurs, the latter risk management during the decline should be focused around three areas.
First area is just below the 86.00 mark. At that level the weekly PP together with the 55 and 200–period SMAs are located at.
Afterwards the 100-period SMA should be watched, which was moving steeply higher in the middle of December.
Last but not least the lower trend line of the junior channel up pattern would be strengthened by the weekly S1 at the 85.32 level.

CHF/JPY 1D Chart: About to be squeezed inThe two top risk off currencies have reached a critical level on the daily chart one against another. The pair recently bounced off the lower trend line a dominant pattern and moved to the resistance of a junior channel down.
The resistance is strengthened by various additional resistance levels near the 114.50 mark. Due to that reason a decline down in the future can be expected. However, downwards there are set to be various support levels before the pair reaches it eventual target near the 113.35 level.
At that level the dominant patterns support line is located with other weekly and monthly support levels.

GBP/JPY 4H Chart: Reveals dominant patternThe Pound continued to trade in the previously charted channel down pattern against the Japanese Yen until November 10. A rebound then broke the pattern before the rate declined down to the monthly S1 at the 148.15 mark.
The rebound from this monthly pivot level revealed the existence of a lower trend line of a possible large scale channel down pattern. However, its upper trend line has not been confirmed, as it is drawn only by using the October high level to draw a parallel line.
However, in regards to the short term, the pair is being squeezed in by various levels of significance surrounding the 149.50 mark.

GBP/JPY 4H Chart: Breaking of PatternsAfter the recent development and breaking of various minor channel patterns the Pound has revealed a new direction and a new long term pattern against the Japanese Yen.
In general, the most junior channel up patter was broken at the end of the last week. Meanwhile, a dominant descending channel was broken previously. The possible breaks could have been spotted beforehand. However, due to the fundamental changes in the both currency pairs, Dukascopy absolved from reviewing this currency pair.
Although, the pair has revealed a dominant support line, which is set to guide the pair to the levels above the 150.00 mark.

NZD/JPY 4H Chart: Channel Reaches Dominant SupportThe New Zealand Dollar just plummeted against the Japanese Yen. The fall, however, was stopped by the most dominant support, which Dukascopy analysts could discover on the pair’s charts. The support belongs to a massive scale ascending triangle pattern of the daily chart.
Due to that reason a rebound is to be expected in a rather long term for forex traders. In that scenario the pair would first attempt to break through the various pivot points, simple moving averages until it reaches the resistance line of the a few months long channel down pattern.
Afterwards, the pair should break the just mentioned resistance and continue even higher.

CAD/JPY 1D Chart: Fibonacci and ChannelThe Canadian Dollar by large is doing a long term rebound against the Japanese Yen, as the rate has formed a long term ascending channel pattern. However, there are some details that need to be taken into account, if one wants to speculated on this pairs movements.
First of all the rate seems to be highly influenced by the Fibonacci retracement levels, which can be observed on the chart. Secondly, the retracement levels only mark the approximate location of a zone, where the rate might change direction.
Third and last in the short term the weekly pivot points seem to be playing a large role, as the SMAs are far below the exchange rate.

NZD/JPY heading for long term supportThe New Zealand Dollar has reached a notable support level against the Japanese Yen. The support is represented by the weekly S1 at the 0.7935 level. Due to that reason it can be stated that the rate is at a significant point.
The Kiwi is either going to rebound against the support level to reach once more for the 50.00% Fibonacci retracement level at the 0.7982 level, which would likely provide the needed resistance to reinforce the decline.
All in all, in accordance with the dominant situation, the rate should decline down to the cluster of support from the 78.65 to 78.80 levels, as right there the long term support line is surrounded by various other levels.
