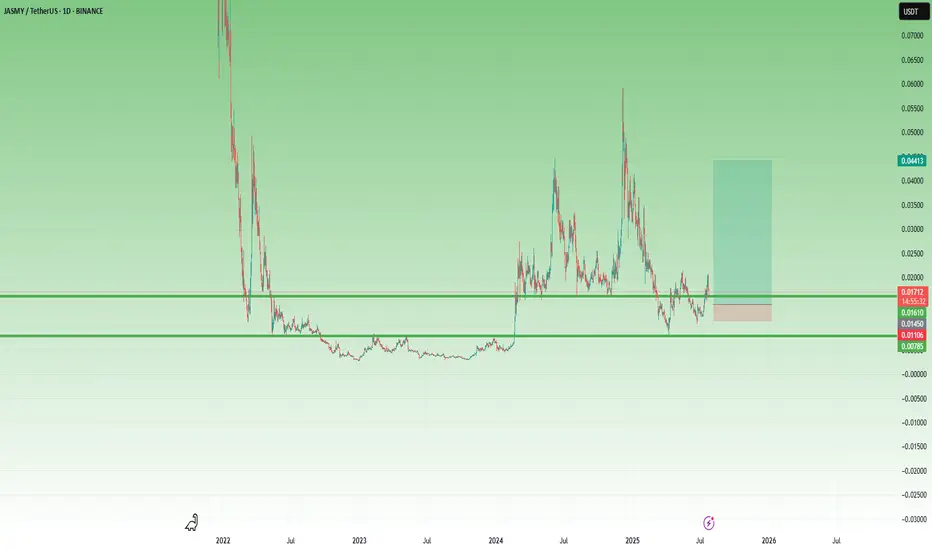
JASMY – A Volatile Setup with x3 Potential 🔸 After bottoming out at 0.003 and spending over a year in accumulation, JASMY finally broke above the key 0.008 resistance zone in February 2024. That breakout triggered a series of explosive moves – but just as violent were the drops that followed.
🔸 What stands out:
• The first post-breakout spike found a new support at 0.015.
• Then came a second vertical move toward 0.06, followed (of course) by a brutal drop.
• But… 0.008 held, and by late June, the chart printed a higher low, showing that buyers became interested.
📍 Right now, the price has reclaimed the 0.015 zone and is trying to stabilize above it. If this level holds, it could become the new base for the next wave.
💡 My plan?
This is very speculative, but I like the setup.
I’m looking to buy around 0.015–0.016, with clear negation below 0.010.
Target? Around 0.045, for a potential x3 move and a tasty 1:8 risk/reward.
⚠️ I’m not the guy who repeats the cliché “ only trade what you can afford to lose, ”
but seriously – this one is for clubbing money, not summer vacation money.
Let the volatility work in our favor. 🚀
Jasmy
JASMY/USDT – End of the Bearish Era? Golden Pocket Retest?🧠 Technical Overview:
The JASMY chart is showing a very strong technical signal after breaking out from a major descending trendline that had capped the price since December 2024. This breakout marks the potential end of a medium-term bearish phase and the beginning of a new accumulation and bullish expansion cycle.
The breakout was confirmed with strong momentum and solid candle structure, indicating possible entry from institutional buyers or smart money.
Currently, the price is pulling back to retest the Fibonacci Golden Pocket (0.5–0.618 retracement) zone between $0.01520 – $0.01622 — a critical area that often acts as the launchpad for the next leg up.
📊 Pattern and Market Structure:
✅ Descending Trendline Breakout → Signals mid-term reversal
✅ Golden Pocket Retest → Ideal accumulation zone
✅ Previous resistance flipped to support → Confirming structure flip
✅ Potential formation of a Bullish Flag or Cup & Handle pattern in the near future
✅ Bullish Scenario (High Probability):
If the price holds the Golden Pocket zone and forms a higher low, the bullish market structure remains intact and strong.
📍 Key Upside Targets:
$0.02040 → Minor resistance & structure pivot
$0.02238 → Key structural resistance
$0.02643 → Previous high before breakdown
$0.03206 – $0.03500 → Major psychological levels
$0.03944 – $0.04694 → Expansion targets
Max Bullish Target: $0.05775 – $0.05950 (weekly structure resistance zone)
If price bounces from this level with increased volume, this could kickstart an impulsive Wave 3-style rally.
⚠️ Bearish Scenario (If Support Fails):
If the price fails to hold the $0.01520 support:
$0.01300 → Minor horizontal support
$0.01211 → 0.618 extension of the prior move
$0.01189 → Strong support and last line of defense before full breakdown
A breakdown below this golden zone could trigger short-term panic selling, but overall bullish structure remains valid as long as the price stays above $0.01000.
🧭 Key Levels to Watch:
🔑 Support: $0.01520 – $0.01622 (Golden Pocket)
🚨 Breakout Level: $0.01764
🎯 Major Targets: $0.02238 – $0.02643 – $0.03500 – $0.04694 – $0.05950
🔍 Conclusion:
A breakout from the long-term downtrend followed by a clean retest into the Fibonacci Golden Pocket is a classic bullish continuation setup. As long as this support holds, the upside potential is substantial.
This setup offers an excellent risk-reward ratio for swing traders and fits perfectly with the “Buy the Retest” strategy. Momentum traders and technical analysts should watch this zone closely.
📢 Market Sentiment:
Moderately Bullish ➜ Highly Bullish
(Upon confirmation of bullish candle within the Golden Pocket)
#JASMY #JASMYUSDT #CryptoBreakout #GoldenPocket #AltcoinReversal #TechnicalAnalysis #FibonacciSupport #CryptoTrading #TrendReversal #BullishScenario

Live trade hello friends👋
Considering the fall that we had, you can see that the buyers supported the price at the support point and caused it to grow. Now with the return of the price and the construction of an upward pattern, you can see that we can enter into the transaction with capital and risk management and move to the specified goals with it.💰
🔥Join us for more signals🔥
*Trade safely with us*

JASMYUSDT — Midterm Outlook | Buy & Sell Zones🚀 JASMY 2025-2026 Roadmap — What to Watch
Here’s my condensed view on SEED_DONKEYDAN_MARKET_CAP:JASMY for the next few quarters:
🔹 Q2 2025 (Jul–Sep)
Expect the alpha launch of the Jasmy App, first partnerships with local governments & sports teams, plus the big debut of JANCTION Mainnet L2, DEX and staking.
Could fuel a 20–40% rally on hype and fresh use-cases.
🔹 Q3 2025 (Oct–Dec)
Rollout of MyResume (HR-focused product), more JANCTION node sales and ecosystem build-out.
Should support a 10–20% steady appreciation if adoption shows up.
🔹 Q4 2025 – Q1 2026
Payments system to go live, aiming for 20,000 nodes, plus new banking & sports partnerships.
Could drive a 15–25% gradual climb into early 2026 if executed as planned.
💡 Bottom line:
This is shaping up as a multi-stage roadmap — short-term speculation in Q2, then more fundamentals in late 2025 to early 2026. If milestones hit and the broader market stays healthy, we might see a decent stair-step move higher.
🔥 Watching: JANCTION Mainnet deployment, real usage of MyResume, and partnership announcements.
👍 Like & drop your targets below if you’re tracking JASMY. 🚀 Let’s see how this plays out!

#JASMY/USDT GOOD TIME TO BUY JASMY I MARK THE TARGETS#JASMY
The price is moving within a descending channel on the 1-hour frame and is expected to break and continue upward.
We have a trend to stabilize above the 100 moving average once again.
We have a downtrend on the RSI indicator that supports the upward break.
We have a support area at the lower limit of the channel at 0.01213, acting as strong support from which the price can rebound.
We have a major support area in green that pushed the price upward at 0.01178.
Entry price: 0.01264.
First target: 0.01308.
Second target: 0.01367.
Third target: 0.01441.
To manage risk, don't forget stop loss and capital management.
When you reach the first target, save some profits and then change the stop order to an entry order.
For inquiries, please comment.
Thank you.


$Jasmy Possible falling wedge breakout This falling wedge pattern shows up in the 3day interval. The 4hr and other popular time intervals had bad news patterns on the hourly, an ascending wedge with downside breakout.
I guess we can wait and see ;)
thanks again,

JASMY/USDT – Golden Support Rebound Toward Explosive Targets!📌 Chart Explanation:
JASMY is showing strong potential for a bullish reversal from the key demand zone (highlighted in yellow) around the $0.01100–$0.01300 range. This zone has historically acted as a major support level since 2022, and it has just been successfully retested during the latest correction.
Following this bounce, price action indicates the beginning of a possible uptrend formation. If bullish momentum continues, we may see price reaching multiple resistance targets on the way up:
🎯 Upside Targets (Resistance Levels):
1. 🟡 $0.01704 – Minor resistance
2. 🟡 $0.02340 – Medium resistance
3. 🟡 $0.03969 – Previous major swing high
4. 🟡 $0.05712 – Psychological target
5. 🟡 $0.08716 – Mid-term target
✅ Bullish Signals:
Strong bounce from historical support implies possible accumulation.
Early signs of Higher Low formation.
Potential gain exceeding +500% if upper targets are achieved.
⚠️ Risk Note:
If the $0.01100 support fails, this bullish scenario becomes invalid.
Beware of fakeouts or potential bull traps.
🧠 Conclusion:
JASMY is setting up for a possible bull run from the golden support zone. As long as price stays above $0.01100, the mid-term outlook remains bullish.
#JASMY #JASMYUSDT #CryptoAnalysis #AltcoinSeason #BreakoutCrypto #BinanceAnalysis #TechnicalAnalysis #CryptoSignals #BullishSetup #SupportRebound

JASMY Long Swing Setup – Oversold Bounce from Major SupportJASMY has seen a sharp decline in recent weeks, but price has now landed in a key support zone. With a potential bounce on the table, we’re eyeing the $0.015–$0.01355 range for a possible long entry toward resistance tests.
📌 Trade Setup:
• Entry Zone: $0.015 – $0.01355
• Take Profit Targets:
o 🥇 $0.020
o 🥈 $0.024
o 🥉 $0.030
• Stop Loss: Daily close below $0.013

(jasmy) jasmy "array"I can't share my indicator ideas unless I publish them publicly. I don't feel like sharing my indicators with the public is necessary so I guess I will not be publishing many new ideas because the Trading View website is removing features where unpublished custom indicators are allowed to be included in sharing. Trading View is too strict and they keep choking the freedoms of watchlist, now indicators, what's next to be taken away from users of the website?

Important support and resistance levels: 0.019249-0.024672
Hello, traders.
If you "Follow", you can always get the latest information quickly.
Have a nice day today.
-------------------------------------
(JASMYUSDT.P 1D chart)
It is showing signs of breaking away from the medium- to long-term downtrend line (1).
However, since it is located below the M-Signal indicator of the 1M chart, a short and quick response is required when trading.
It is expected that the price will start to rise if it rises above the important support and resistance area of 0.019249-0.024672 and maintains the price.
Even if it does not rise and falls, if the price is maintained above the downtrend line (1), it is expected that there will be an increase to eventually rise to the important support and resistance area.
The volatility period is around June 24, which is similar to the BTC volatility period, so it seems that it will have a big impact on the movement of BTC.
Since the HA-Low indicator of the 1D chart is formed at the 0.014447 point, if it is supported, it is an aggressive buying period.
-
Thank you for reading to the end.
I hope you have a successful transaction.
--------------------------------------------------
- This is an explanation of the big picture.
(3-year bull market, 1-year bear market pattern)
I will explain more details when the bear market starts.
------------------------------------------------------

JASMYUSDT 4D AnalysisJASMY ~ 4D Analysis
#JASMY Buy gradually after retesting this support block with a short term target of at least 15%+ from here.

#JASMY/USDT#JASMY
The price is moving within a descending channel on the 1-hour frame, adhering well to it, and is heading towards a strong breakout and retest.
We are experiencing a rebound from the lower boundary of the descending channel. This support is at 0.01480.
We are experiencing a downtrend on the RSI indicator, which is about to break and retest, supporting the upward trend.
We are in a trend of consolidation above the 100 moving average.
Entry price: 0.01530
First target: 0.01593
Second target: 0.01650
Third target: 0.01720

Will #JASMY Retest Trigger a Rebound or a Breakdown? Key LevelsYello Paradisers! Have you prepared yourself for what’s about to unfold with #JASMYUSDT? The #JasmyCoin setup is showing signs of a major move:
💎#JASMYUSD has just completed an impulsive move from the Major Demand Zone around 0.01509 and is currently retesting the ascending support after breaking down from the short-term channel. This is the critical moment where disciplined traders prepare their next move, not after the bounce, but before it.
💎What we’re seeing now is a textbook retest of the ascending support, after an aggressive move from the major demand zone. The price is currently hovering just above the 0.01742 support level, a critical area that aligns with the high-volume node from the visible range volume Profile (VRVP), making this a high-probability reaction zone.
💎If the #JASMY price holds here, and we start seeing buyer strength reclaim the broken ascending channel, this could trigger a sharp bounce targeting the mid-term resistance at 0.02221. Above that, the next magnet will be the major resistance sitting around 0.02512, a level likely to attract profit-taking or even large-scale short entries from smart money.
💎However, failure to hold this support and a confirmed breakdown below the 0.01509 zone would invalidate the bullish structure entirely. In that case, we would be looking for a possible bearish continuation, driving the price toward 0.01400 and possibly lower, where more liquidity pockets remain untapped. That move would also trap late long entries and clean out weak hands — the exact kind of shakeout we warn about.
Play it safe, respect the structure, and let the market come to you!
MyCryptoParadise
iFeel the success🌴

Is JASMY Ready for a Massive Comeback? Key Levels to Watch!Yello, Paradisers! After months of relentless selling, could #JASMY finally be staging a comeback? Let's dive into its key technicals:
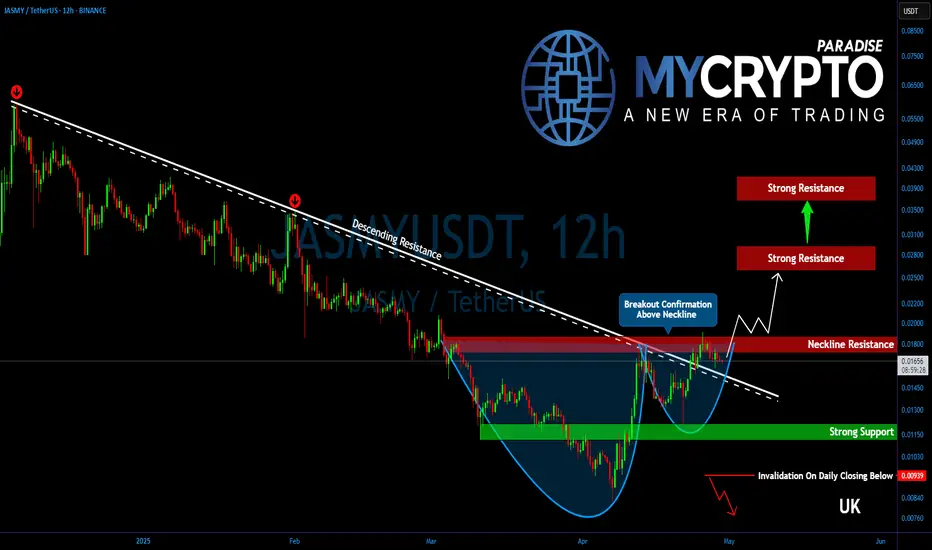
💎After an extended and painful downtrend, JASMY has finally broken out of its multi-month descending trendline resistance. This significant technical breakout marks the first step toward a potential broader recovery. Moreover, the price action is shaping a potential cup and handle formation—a powerful bullish continuation pattern—which strongly suggests that the recovery momentum still has further room to run.
💎At the moment, #JASMYUSDT is battling a crucial resistance zone between $0.01750 and $0.01850. This area serves as the neckline resistance of the developing bullish structure. A clean and convincing breakout above this zone would trigger a major shift in momentum, potentially setting up JASMY for a back-to-back bullish breakout.
💎Should bulls succeed in pushing above this resistance, the next immediate target lies at $0.02500 to $0.02750—a heavy supply zone that coincides perfectly with the 50% Fibonacci retracement. This level is expected to attract some strong profit-taking.
💎However, if bullish strength continues to hold firm even after that, JASMY could extend its rally toward the 61.8% Fibonacci retracement zone, located around $0.03650 to $0.04000. This region is historically known to be a "golden pocket" for reversals and thus demands maximum caution. If signs of exhaustion emerge near this zone, it could potentially mark a medium-term top.
💎JASMY’s first primary support now sits at $0.01500. Below that, a firmer, more critical support base exists between $0.01150 and $0.01100—a zone that has already proven capable of withstanding strong selling pressure in the past.
Paradisers, strive for consistency, not quick profits. Treat the market as a businessman, not as a gambler.
MyCryptoParadise
iFeel the success🌴
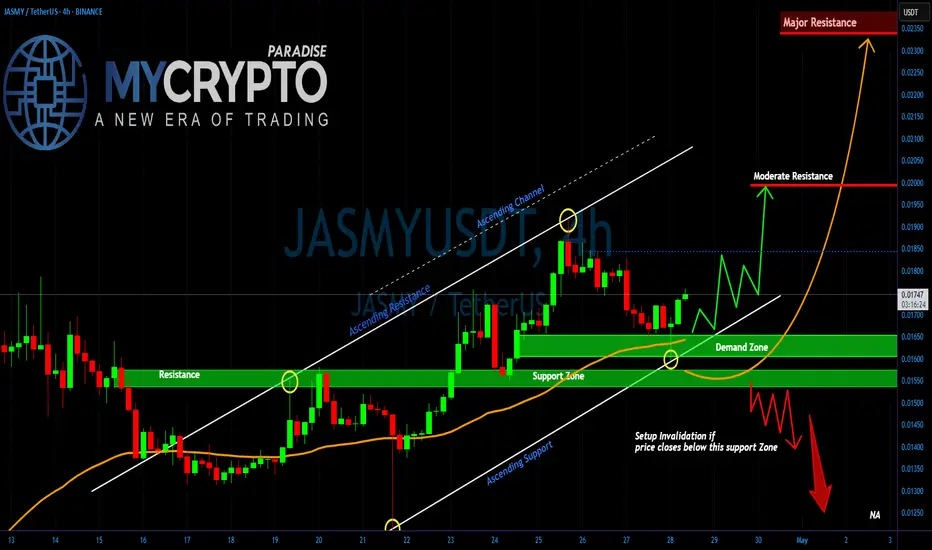
JASMY at a Breaking PointYello, Paradisers! Have you been watching JASMY closely? If not, you might be about to miss one of the most explosive opportunities we've seen in recent days. A major breakout or breakdown is brewing, and the market is preparing for a decisive move!
💎Right now, #JASMYUSDT is sitting above a critical Demand Zone after successfully flipping a strong historical resistance into support. Price action is following an ascending structure, respecting both the Ascending Support and the broader Ascending Channel pattern. As long as the price continues to hold this support region and maintain the bullish market structure, there is a high probability of a breakout towards the Moderate Resistance level around 0.01994. A clean break above this area could fuel a sharp rally straight towards the Major Resistance zone at 0.02337.
💎However, caution is absolutely necessary here. If JASMY fails to hold the current Demand Zone and we see a confirmed close below the support at 0.01540 level, it would invalidate the bullish setup. In that case, a rapid sell-off is likely, with downside targets opening towards the 0.01397 region and possibly even lower levels. This would create a high-risk environment where inexperienced traders could get trapped very quickly.
Stay focused, Paradisers. Be the hunter, not the hunted.
MyCryptoParadise
iFeel the success🌴
(JASMY) jasmy "sectioned macd - wave phase"As seen between the purple lines are the phases of the MACD with no overlap between each of the purple lines. The final bottom phase(5) was reached at which point the price rose to an astonishing 75%. Not sure if these purple lines will be of much use from here on out. I may delete them at some point.

(JASMY) jasmy "cycle-phase-wave"According to an enhanced MACD indicator that follows three layers of information I found the peak MACD green to line up with the yellow lines on the chart that are assigned with the next alternative colored line to be aligned with the most recent improvement in the otherwise losing price for the last months of time. Although an elliott wave is not seen I figured it would be possible to create a measurement like wave using an indicator to guide where those points should be.

JASMY Falling Channel BreakoutBINANCE:JASMYUSDT just broke out of its falling channel, with strong volume despite it being a weekend move, and is attempting to reclaim the previous support zone around $0.016.
Observations
• Second clear breakout from a descending structure in the last year.
• Good volume spike backing the move — first meaningful demand since the December peak.
• Attempt to reclaim the $0.016 support zone, which had acted as a base throughout 2024.
Key levels
• A daily close above the resistance would confirm the breakout.
• Holding above ~$0.016 would be an even stronger bullish sign.
• Next major resistance at $0.041-$0.045 from the previous supply zone.
• Watch the 1-year EMA above $0.021 as a potential shorter-term resistance.
If momentum continues, this could be the start of a larger trend reversal, with $0.041 as the first upside target.

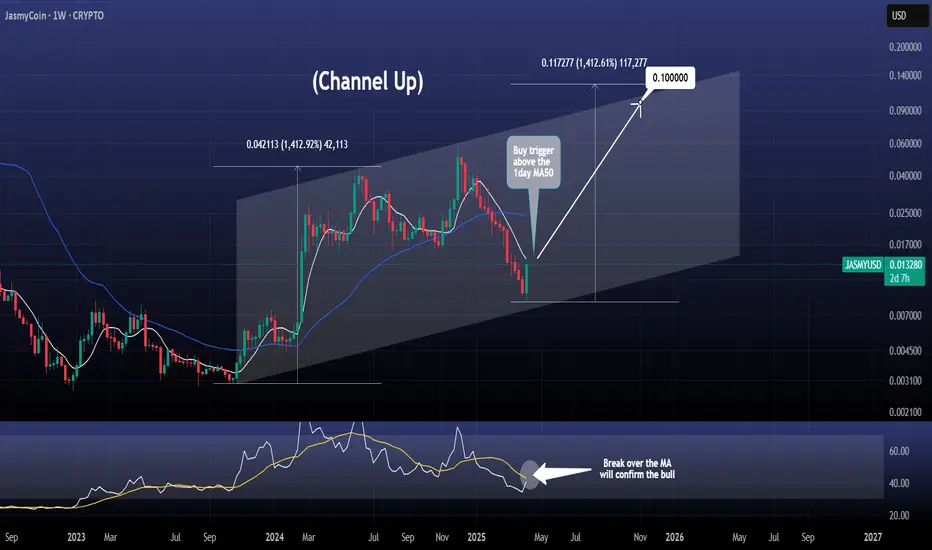
JASMY aiming at $0.10 after this break out!JasmyCoin / JASMYUSD is posting a massive green 1week candle, the strongest one since the December 2nd 2024 that formed the high of this Cycle so far.
This is also the bottom of the Channel Up and a crossing over the 1day MA50 (white line) will be the buy trigger.
Additional indicator to look for is the 1week RSI, giving a buy confirmation over its MA.
Target 0.1000 (+1400%).
Follow us, like the idea and leave a comment below!!
JASMY ANALYSIS (1D)Before anything else, you should know that this token is on Binance’s Red List (at risk of being delisted) and carries its own specific risks.
After entering a corrective phase, JASMY is now approaching a FLIP zone.
From this level, we expect upward volatility for JASMY.
Targets are marked on the chart.
A daily candle closing below the invalidation level will invalidate this analysis.
For risk management, please don't forget stop loss and capital management
When we reach the first target, save some profit and then change the stop to entry
Comment if you have any questions
Thank You

JASMY/USDT: Bullish Breakout and Long OpportunityHello fellow traders,
I've spotted a promising long opportunity on JASMY/USDT that I wanted to share with you.
Here's the setup:
Breakout Confirmation: JASMY has successfully broken out of a descending channel, indicating a potential shift in momentum.
Retracement and Readiness: Following the breakout, the price has retraced, suggesting it's now poised for an upward move.
Target: My target for this trade is the $0.01250 level, which conveniently aligns with the 200-period moving average on the 4-hour timeframe.
Here's my proposed trade plan:
Entry: I'm looking to enter the trade once the price moves above $0.01060.
Stop Loss: To manage risk, I've set my stop loss around $0.00970.
Remember, this is just my analysis, and trading always carries risk. Please do your own due diligence before making any trading decisions.
Wishing you all profitable trades!

#JASMY/USDT#JASMY
The price is moving within a descending channel on the 1-hour frame, adhering well to it, and is on its way to breaking it strongly upwards and retesting it.
We are seeing a bounce from the lower boundary of the descending channel, this support at 0.1233.
We have a downtrend on the RSI indicator that is about to break and retest, supporting the upward trend.
We are looking for stability above the 100 moving average.
Entry price: 0.01279
First target: 0.01300
Second target: 0.01327
Third target: 0.01360
