Alikze »» JASMY | Demand at the bottom of the ascending channel🔍 Technical analysis: Demand at the bottom of the ascending channel
- In the analysis presented in the previous post , in the daily time frame, after the inability to target the ceiling of the ascending channel, an alternative scenario was realized, which continued until the correction Liquidity Area.
- It is currently moving in a long-term ascending channel on the daily time frame.
- After meeting with the bottom of the channel and the Liquidity Area, demand has been encountered.
- At the moment, it is faced with selling pressure by exiting the triangle density in meeting with the specified resistance.
💎 According to the momentum, this reversal can be a pullback to a broken structure.
💎 Therefore, by maintaining the range of 0.01830, it can continue its growth until the next supply zone after breaking the resistance zone.
⚠️In addition, if it penetrates below the Liquidity Area, the bullish scenario is invalidated and the correction can continue.⚠️
»»»«««»»»«««»»»«««
Please support this idea with a LIKE and COMMENT if you find it useful and Click "Follow" on our profile if you'd like these trade ideas delivered straight to your email in the future.
Thanks for your continued support.
Best Regards,❤️
Alikze.
»»»«««»»»«««»»»«««
BINANCE:JASMYUSDT
Jasmycoin

#JASMY/USDT#JASMY
The price is moving in a descending channel on the 4-hour frame
And it is sticking to it well
We have a bounce from the lower limit of the descending channel and we are now touching this support at a price of 0.018000
We have an upward trend on the RSI indicator that is about to be broken, which supports the rise
We have a trend to stabilize above the moving average 100
Entry price 0.02000
First target 0.02152
Second target 0.02311
Third target 0.02572

Jasmy/ USDT: gearing up for a breakout above trendline resistancJASMY/USDT: Gearing Up for a Breakout Above Trendline Resistance
JASMY/USDT is shaping up for an exciting move 📈 as it approaches a critical trendline resistance zone 📊. The price has been consolidating tightly, creating the perfect setup for a potential breakout 💥. If the breakout happens, we could see a strong bullish trend unfold 🚀. Keep a close eye 👀 on this pair and wait for confirmation before acting.
Key insights:
1. Trendline resistance: JASMY/USDT is nearing a long-standing trendline that has previously acted as a strong barrier. A break above this level could signal the start of a bullish rally.
2. Volume surge: A significant increase in trading volume during the breakout could confirm strong buyer interest 🔥.
3. Bullish signals: Momentum indicators like RSI and MACD are aligning positively ⚡, adding weight to the breakout scenario.
Steps to confirm the breakout:
Look for a clear 4H or daily candle closing above the trendline 📍.
A noticeable spike in volume during the breakout can confirm strong buying activity 📊.
A retest of the broken resistance as a new support zone adds credibility to the move ✅.
Stay cautious of fake breakouts, such as sharp reversals or wicks above the trendline ⚠️.
Potential targets (post-breakout):
Initial resistance:
Next target:
Risk management strategies:
Use stop-loss orders to manage your risk effectively 🔒.
Ensure position sizing aligns with your overall trading strategy 🎯.
This analysis is for educational purposes only and not financial advice. Always conduct your own research (DYOR) 🔍 before making investment decisions.

JASMY head shoulderJsmy usdt, hear and shoulder which is a reversal pattern, expect a continuation upward

Trading opportunity for JASMYUSDTBased on technical factors there is a Buy position in :
📊 JASMYUSDT
🔵 Buy Now
🪫Stop loss 0.02310
🔋Target 1 0.03000
🔋Target 2 0.03250
🔋Target 3 0.03700
💸RISK : 1%
We hope it is profitable for you ❤️
Please support our activity with your likes👍 and comments📝

JASMY Trade SetupJASMY has broken above the resistance trendline, retested it, and is now showing a rebound. I expect a 100% gain on JASMY, with the 100 EMA holding as support.
~ Entry: CMP.
~ Accumulate up to $0.019.
~ Leverage: 3x.
~ Targets: $0.0276, $0.0320, $0.0385, $0.0447.
Always conduct your own research and analysis before investing.

JasmyCoin (Jasmy)Jasmy, one of the most popular coins in Japan, has been progressing silently. First, breaking the downtrend pattern and then starting an upward move. Now, we have to see if Jasmy can break the horizontal resistance area in front of it.

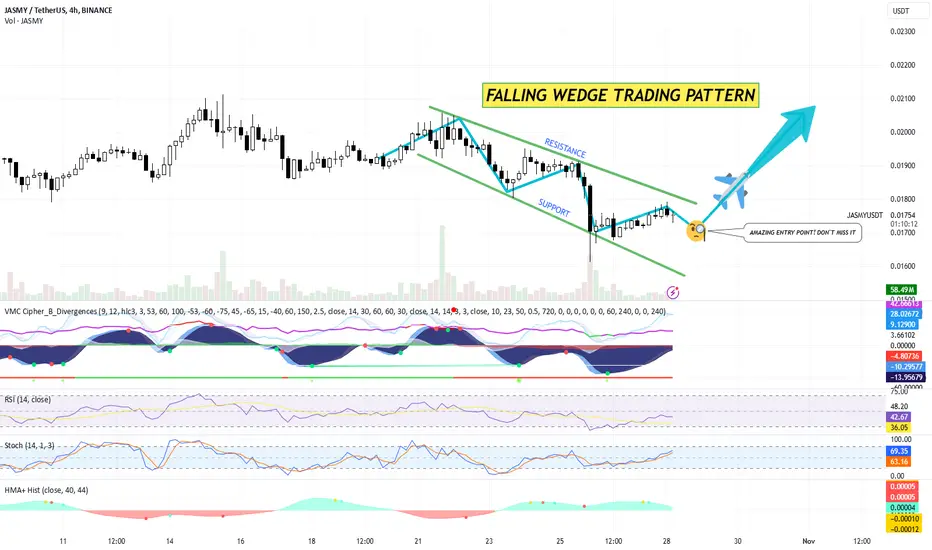
JASMY AT A PERFECT ENTRY POINT FOR A LONG POSITION! TRADE PLANTechnical Analysis by Blaž Fabjan
Pattern Identification:
The chart displays a falling wedge pattern , a bullish reversal pattern often signifying a potential trend change from bearish to bullish.
The price action is currently testing the upper boundary of the wedge pattern, indicating that a breakout could be imminent if there’s sufficient buying momentum.
Support and Resistance:
Support Line: The lower green line in the falling wedge acts as support. This line has been consistently respected, indicating strong buying interest at those levels.
Resistance Line: The upper green line marks the resistance level within the pattern. A breakout above this line would be considered a strong bullish signal.
Volume Analysis:
There’s a noticeable decrease in volume within the wedge, which aligns with typical falling wedge characteristics. Look for a volume increase on a breakout to confirm the move.
Indicators:
VMC Cipher: Divergences and buy signals have been detected, showing signs of potential momentum shifts.
RSI: At around 41.07, the RSI is approaching the neutral zone (50), suggesting the potential for further upside if it breaks above 50.
Stochastic: Currently around 60.48, indicating upward momentum and possibly further bullish action if it continues moving up.
HMA+ Histogram: Showing minor bullish signals that could align with a breakout confirmation.
Entry Signal:
The wedge breakout zone is highlighted as an “Amazing Entry Point.” The suggested entry is around the resistance line in the pattern, currently close to $0.01743.
Trading Plan
Entry:
Enter a long position once JASMY/USDT breaks and closes above the falling wedge resistance line with increased volume. This would be near or slightly above the $0.0175 level, depending on price action confirmation.
Stop Loss:
Place a stop loss slightly below the wedge’s recent support level or just below the most recent swing low at around $0.016 to mitigate risk.
Take Profit Levels:
First Take Profit (TP1): Set around the recent swing high near $0.019.
Second Take Profit (TP2): For a more extended target, aim around $0.0205, where the price previously found resistance.
Final Take Profit (TP3): Around $0.022, aligning with previous higher resistance levels.
Risk Management:
Calculate position size to risk no more than 1-2% of your trading account per trade.
Monitor volume closely, as a breakout with low volume may indicate a false breakout, in which case exiting the trade early could be advisable.
Alternative Scenario:
If the price fails to break the resistance and moves back within the wedge, refrain from entering. In this case, wait for a possible retest of the support level around $0.016 as a secondary entry point.
Summary
Pattern: Falling Wedge (Bullish).
Buy Zone: Above $0.0175, confirmed with volume.
Stop Loss: Below $0.016.
Take Profit Targets: $0.019 (TP1), $0.0205 (TP2), $0.022 (TP3).
btw: VERY GOOD ENTRY POINT AT THE MOMENT!
JASMY jasmy "wedge view"This is the wedge view for Jasmy based on 100 day and 50 day past moving averages trajectory leading up to Nov 1st 2024. The range anyway. This does not mean the price is subject to necessary stay within the boundaries of the purple lines drawn as much as the projected outcome for the price in a variable sense according to today from the indicator I use. Obviously, BTC movement seems to always impact the rest of exchange traded cryptocurrency tokens or coins so when the price of BTC fell so did everything else. Seems like a cop out for the price of cryptocurrency trends to always fallowe BTC necessarily considering how indicators should in some ways tell a different story for different cryptocurrency.

#JASMY Breaks Out of the Falling Wedge: What's Next?Yello, Paradisers! Are you ready for what's brewing with #JASMYUSDT? The #JasmyCoin is at a crucial tipping point and about to explode:
💎Currently, #JASMY is sitting at a key demand zone of $0.0245, forming a Falling Wedge pattern. This could be the calm before the storm. A potential breakout above this level might signal a major momentum shift in favor of the bulls. If the demand holds, brace yourself for a strong bullish move that could catch many off-guard.
💎For the bullish scenario to play out, #JasmyCoin must break above $0.0245. If it does, the next target is the internal resistance zone at $0.0298. At this level, we could see a significant rally, so it's crucial to keep an eye on it.
💎However, we can't afford to get too comfortable just yet. If the demand zone doesn't hold, the price could pull back to the lower support area around $0.0201. And if that level breaks too, the next critical demand zone to watch will be $0.0178.
💎A daily close below $0.0178 would invalidate the bullish outlook and might signal a deeper correction. Stay alert, as the market could turn quickly.
Patience and discipline are the keys in navigating these market conditions.
MyCryptoParadise
iFeel the success🌴

(JASMY) jasmyCurrent trajectory for Jasmy using a previous shape to plot to fan assist tools, one on top and one on bottom, from the two fans creates a gap in the middle where the trend of Jasmy appears to visually chart its price.

(JASMY) jasmy Is now a good time to buy? The price is awfully close to turning over to the green side. If the line goes green the price could have a small surge increasing the price of Jasmy. I remain along the sentiment that Jasmy is gaining in price, not losing.

Jasmy Weekly Hidden Bullish DivergenceSEED_DONKEYDAN_MARKET_CAP:JASMY has a confirmed hidden bullish divergence on the weekly chart. There is a also a case to be made for a double hidden bullish divergence, although the previous one may have already played out.
Hidden bullish divergences are more effective than regular divergences because they are a trend continuation signal. The hidden bullish divergence shows us that even though RSI made lower lows, the price held the gains made in previous sessions (higher lows). In other words: RSI has reset to lower levels, while price is higher, which means the RSI has more room to run up from a higher starting price point.
Looking at the broader market, we can say that crypto is still in a bullish uptrend, which only adds to this signal's strength.
As a general rule of thumb; the longer the timeframe, the more significant the signal. The weekly timeframe is a LONG timeframe, so this confirmed hidden bullish divergence for #JASMYUSD can be considered as a very strong signal to go long or to add to your long-term spot positions.
Furthermore, there is a case to be made for a clear corrective A-B-C structure since the recent highs around $0.044. If this is the case, than expect #JASMY to run hard and fast once the market regains strength.

Is JASMY done? Taking a look at the daily chart, we see JASMY has been in a down trend (lower highs and lower lows) since the beginning of June falling back into this consolidation range where it was bound for 3 months during February - May. The fact that price has made a complete retracement of the breakout and back into the old consolidation channel, testing its low, is not a good sign to me.
The yellow lines on the chart represent the consolidation's boundaries with the top acting as strong resistance and the bottom now acting as strong support again. There's an intermediate level that acts as support/resistance around the .021 area.
The selloff on Monday, August 5th had substantial volume (last time we had that high of a volume was in February) which indicates to me that a large amount of coins were sold that day and people were taking their profits or getting out of their positions.
Moving forward, I would expect price to be bound within the range of this consolidation channel and if it breaks below it, the next support zone I see is around .012 - .013.
If price makes its way down to .015 - .016 again and consolidates there, it could be a great opportunity for a long position as that level is extremely strong. But, I need more data supporting that thesis before considering an actual entry.
Good luck to you all.

JASMY/USDT NEW INCREASE VOLUMEJASMY/USDT shows the low time frame possibility for new volume which can affect the price for an uptrend. ( depend all on high chance) There are no guarantees in the markets.
The new increase volume updates always start with interest if there is a confirmation to follow and if there is a building with a hold for a time.
90% of coins this time are not building coins. Some % also show a start fake trend and return to where it started. time frame confirmation + high levels building is important for a healthy coin.

JASMYUSDT.PShifted Structure to bullish my trigger plan is as simple as it can get we long with a proper retest and aiming for the Buy side liquidity upside.

Jasmy usdt analysis Jasmine coin
Pattern 2 bottom
Risk rewards ratio >1.5
First target 3
Second target 3.7

Urgent Update on #JASMYUSDT: Is a Major Move Coming Ahead? Yello Paradisers! #JASMYUSDT is making some interesting moves after its breakout from a descending channel. Let's analyze #JASMY and find out what's next:
💎#JASMYUSDT has broken free from its longstanding descending channel, signaling a potential upward trajectory. After navigating within this channel for a considerable period, #JasmyCoin has successfully breached it and is now coming to retest its upper boundary.
💎The key resistance level at $0.0228 has now flipped into crucial support. This level is pivotal as it has been respected multiple times in the past. If #JASMYUSDT can maintain its momentum above $0.0228, there's a strong possibility of a sharp upward move.
💎However, the scenario changes drastically if the price falls below the $0.0228 support level. In this case, the focus shifts to the next support zone at $0.019 - $0.0205, where a bullish rebound could potentially occur.
💎While it might be tempting for some to short at this point, it's crucial to maintain a broader perspective and wait for confirmation from price action. A break below the $0.0192 support will likely trigger a significant downward move, leading to further price decline.
Be smart, Paradisers! The market rewards those who are prepared and stay focused on their long-term goals.
MyCryptoParadise
iFeel the success🌴

JASMY (JASMY)Threading the needle. Topside, Bottomside, somewhere inbetween. The line appears to make sense. My screen shifts due to TradingView not recognizing the resolution of my screen while creating the lines on the graph. The line should touch both crossing points and draw a straight line in the direction of those points.

#JASMY/USDT#JASMY
Our price is moving downwards on a 4-hour frame and is about to break through to the upside in 3 stages
We have a bounce from the lower border of the channel from the green support area at 0.02200
We have a tendency to stabilize above the Moving Average 100
We have an uptrend on the RSI indicator that is heading up
Entry price is 0.02350
The first target is 0.02600
The second target is 0.03000
The third goal is 0.03300

JASMY Bull-flag in weekly TFJASMY / USDT
many bullish signals are spotted in weekly TF
1- Bullflag pattern
2- bullish divergence
3- moving averages are holding
As long as this pattern is holding priority Looks bullish

jasmycoin (JASMY)working on a new basic script. found a correlation between these lines and the price. or so it seems. the past information always seems to correlate to something. seeing the proof in the present is so much harder than looking at the past.

JASMY (jasmy) Jasmy keeps getting stuck above an unending short squeeze linear pattern. The Pattern keeps shifting as the longer Jasmy is not carrying on through the lines and pass the arms folded pattern the worse the short squeezes become.
