Trading opportunity for JASMYUSDTBased on technical factors there is a Buy position in :
📊 JASMYUSDT
🔵 Buy Now
🪫Stop loss 0.02790
🔋Target 1 0.03300
🔋Target 2 0.03777
🔋Target 3 0.04400
💸RISK : 1%
We hope it is profitable for you ❤️
Please support our activity with your likes👍 and comments📝
Jasmycoin

#JASMYUSDT #4h (Binance Futures) Descending channel breakoutJasmyCoin formed a bull flag and is pulling back to 100EMA support, looks good for bullish continuation especially after that previous hammer.
⚡️⚡️ #JASMY/USDT ⚡️⚡️
Exchanges: Binance Futures
Signal Type: Regular (Long)
Leverage: Isolated (3.0X)
Amount: 6.1%
Current Price:
0.035194
Entry Targets:
1) 0.035153
Take-Profit Targets:
1) 0.046679
Stop Targets:
1) 0.029376
Published By: @Zblaba
CRYPTOCAP:JASMY BINANCE:JASMYUSDT.P #JasmyCoin #IoT jasmy.co.jp
Risk/Reward= 1:2.0
Expected Profit= +98.4%
Possible Loss= -49.3%
Estimated Gaintime= 1 week

JASMY Local Re-DistributionThis is a local re-distribution on Jasmy after the initial rejection from the 2 week supply.
I'm expecting it to continue down from here.
Targets / Ideal re-entry points are: $0.0153 / $0.00794 / $0.00545 / $0.0041 / $0.00324

JASMY (JASMY)In trying to understand how to use this indicator, I think the unconnected lines going down show where there are support lines, and the disconnected lines going up represent support lines for support and resistance type observations. I placed the lines on the graph according to the indicator with green being resistance lines and the red line being support.

JASMY Idea - Update for bullish trendHere's the rewritten text in a friendly tone:
Hey Traders! I noticed something interesting on the JASMYUSDT chart.
The price bumped up against the 30 and 60-moving averages on the 4-hour timeframe, which can sometimes act as a bit of a hurdle. But things are looking positive! There's more trading happening in the crypto market lately, especially with altcoins, and other coins are on the rise too. This overall positive sentiment, along with the technical stuff on the chart, suggests JASMYUSDT could be due for a climb. Just like we're seeing with other cryptocurrencies!
Here's the exciting part: If the price on the 30-minute chart breaks above the recent high and crosses above both the 30 and 60-moving averages in 30-Min and 15-Min charts, that could be a good sign for a buying opportunity.
Targets:
$0.04020 and $0.04200

#JASMY/USDT#JASMY
We have a bearish channel pattern on a 2-day frame, within which the price moves and adheres to its limits well
We have a green support area at 0.01500 after the price touched it and bounced from it
We have a tendency to stabilize above moving average 100
We have a downtrend on the RSI indicator that supports the price higher
Entry price is 0.02000
The first target is 0.02400
The second goal is 0.02660
The third goal is 0.03000

JASMYUSDT Flag Pattern!JASMYUSDT Technical analysis update
JASMY price formed a bull flag pattern on the daily chart. With a breakout accompanied by high volume, we can expect a bullish continuation.
Buy zone : Below $0.0260
Stop loss : $0.0217
Regards
Hexa

JASMY IdeaIf the price does not breaking the bottom of the channel, (due to the end of the fifth wave in the 4-hour chart), then after hitting the bottom of the channel as well as hitting the 30-MA. there is possibility to return to top of the channel.
Pay attention: that the closing of the ascending candlestick inside the chanel, and then, passaging the next ascending candle above the highest price of the closed candle, is a buy signal.

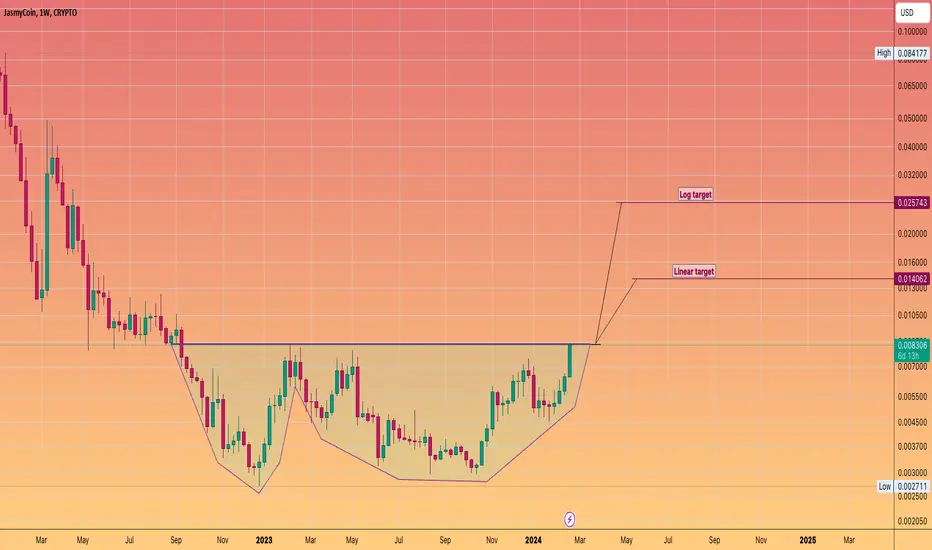
Jasmycoin #JASMY Double Bottom, W pattern on verge of breakout.#Jasmy is mooning today. And is about to clear a key technical level. In what appears to be a W pattern / double bottom. Some analysts are calling for large price targets on this coin in the bull run. And indeed it may go on to reach those dizzying heights that it achieved last Bull Run. My inclination of any Altcoin that has been exposed to a previous crypto cycle, is to temper expectations and generally hope it can reclaim 0.618 fib retracements. With that being said I have not done any fundamental research on this coin. Much like many of the coins I highlight. I just look for good charts and have been hammering the need to accumulate, accumulate, accumulate for over a year now. That work should have been done. i.e. your bags should have been packed. And of the worse mistakes you can do now. Is flip flop, between your altcoins, as you see one moon whilst the other does nothing. This is a sure fire way to screw up this Bull cycle. Only if you have made money on a big cap coin, should u think of rotating. Otherwise stick to what you have.
JASMYUSDTIn exactly 20 days, SEED_DONKEYDAN_MARKET_CAP:JASMY reached the target I had anticipated, resulting in a 50% gain. Congratulations to everyone who benefited! If it maintains stability above the Fib1 resistance, the upward trend is expected to continue. The next target is Fib1.618.

JASMY - Very Strong Hi, This is my new update for Jasmy. One of the strongest coins in this correction from mars is Jasmy, it has only fallen 40% and now it is only down 20% from the top on mars 4th.
Right now we are in descending triangle pattern and we are pressing to break the trendline. We have a major resistance around 0.025-0.027 and I expect once we break the trendline and the resistance, we are going to takeoff +140% to 0.050.
It is also normal if we visit the support level 0.015 again, but if we break the 0.015, things will get very ugly, but as long as we hold the 0.015, I expect the next stop for Jasmy is around 0.050.
Good news is that we are above the 50D and 100D moving averages. The RSI has broken the trendline and the MACD is ready to get bullish momentum.

JASMY Set for Breakout? Analyzing Key Levels and MomentumJasmyCoin (JASMY) has been in a downtrend but has recently started to recover. There are two red trend lines indicating an ascending channel, suggesting a potential continuation of the uptrend if the price stays within this channel.
Support Levels:
0.01250
0.01724 to 0.01720
0.00828
0.00306
Resistance Levels:
0.02379
0.03450
0.05012
Price Movements:
The current price is 0.0221.
- The price recently bounced from around 0.01724 and is now facing resistance at 0.02379
- If it breaks above 0.02379, the next resistance is around 0.03450 and potentially 0.05012
There is a noticeable increase in volume during the price recovery, indicating strong buying interest.
Bullish Scenario:
- If the price breaks and closes above the 0.02379 resistance level, it could target the
0.03450 resistance and potentially reach 0.05012 if the bullish momentum continues.
- The ascending channel suggests that as long as the price stays within this channel, the uptrend is intact.
Bearish Scenario:
- If the price fails to break the 0.02379 resistance and falls below 0.01724, it might test the lower support at 0.01250 and possibly 0.00828.
- The stochastic oscillator's behavior should be monitored for potential bearish crossovers that could signal a downturn.

[JASMYUSDT] - on the verge of breakout!Consolidate a bullish pennant pattern in 3D chart and looks it attempt for huge breakout.
Upper side of bullish pennant and 0.618 fib is gathering together.. breakout meaning a 160% bullish from that point
We Appreciated for supporting us with your like and follow for more updates 🎯

jasmyIn the time of the yellow box, I am waiting for a move. The important points we have are marked. So we will move forward with patience.

JASMYUSDT#Jasmy SEED_DONKEYDAN_MARKET_CAP:JASMY has formed a beautiful picture on the chart as you can see. One of the best indicators, TD Sequential, has confirmed the upward momentum. If it maintains above the downtrend line, it could reach the targets shown in the chart in a short time.

JASMY (JASMY)Arrays, Moving Average and High label makes same view. This kind of looks like an on chart DMI in a way. roughtdraft indicator progress...
the lines are getting are bunched together now.
I see jasmy as the freedom to protect ideas, ideas in business, ideas in one's own personal life, an anti-communist statement of freedom.

JASMY 'LIONS PAW'There are no animals or humans that have six fingers to my knowledge unless by accidental anomaly. For that reason I think it's only natural to see the price of Jasmy going up. On the image it is easy to see the image in the chart. Based on where BTC is headed it wouldn't make sense to see the price drop.

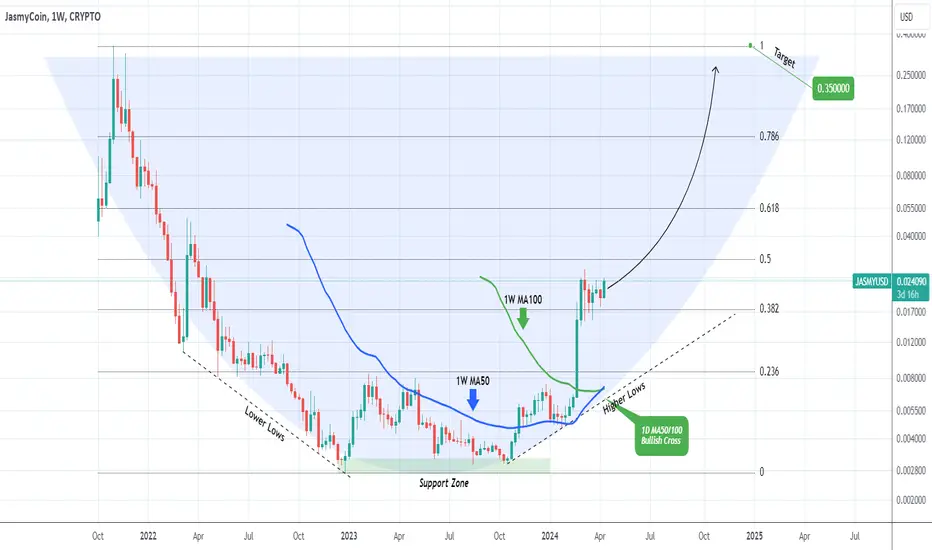
JASMYUSD Giant Cup leading straight to ATH.JasmyCoin (JASMYUSD) is picking up the pace again after 6 weeks of consolidation. The long-term pattern that is emerging is a Cup (potentially we may see a Handle at the top) and this sideways trading the new accumulation before the next Bullish Leg.
Technically it should continue filling up the Fibonacci levels as gaps, with the next being the 0.618 Fib (0.055) and the 0.786 (0.1200) all the way until the All Time High (ATH). As a result our long-term Target is 0.3500.
-------------------------------------------------------------------------------
** Please LIKE 👍, FOLLOW ✅, SHARE 🙌 and COMMENT ✍ if you enjoy this idea! Also share your ideas and charts in the comments section below! This is best way to keep it relevant, support us, keep the content here free and allow the idea to reach as many people as possible. **
-------------------------------------------------------------------------------
💸💸💸💸💸💸
👇 👇 👇 👇 👇 👇
JASMYCOIN (POSSIBLE IDEA)Could this be the direction Jasmy is going? An idea I've come up with--. I can't explain much on the direction of jasmy. The break into the red circle and falling out only to repeat makes sense but once the graph passes the red circle there is no break, which makes sense. I used a previous incline wedge to measure a possible view for the future with a reverse coloring to account for what it would be like. The more Jasmy loses the closer red is of course so using that logic it's a guess on if Jasmy were to move forward and up then there is a small window based on this indicator guess.

JasmyCoin graph drawingDrawing on JasmyCoin graph. I drew a prediction chart based on the idea Jasmy would maintain a price above 0.01 cent and continue the pattern to remain atop the 0.02 cent price based on the understanding of the current chart progress of Bitcoin and momentum found within the greater cryptocurrency ecosystems and from those conclusions tried to produce a graph to show finding the next dip to buy would be harder than it seems because the graph incline degree will be such that dips are going to be harder to see than in a usual general purpose trend where the price action of chart is much flatter over longer periods of time.

JASMY WATCH: SIGNS OF A POTENTIAL UPTREND SHIFT ON THE HORIZONIn our latest technical analysis of the JASMY coin, we've observed several key indicators that suggest a possible shift towards an uptrend in the short-term timeframes. After closely examining price movements and market dynamics, our predictive model is signalling a bullish sentiment on the horizon. As a result, we are entering a strategic point of $0.020, with a stop loss set at $0.018 to manage risk effectively. Our analysis aims for a take-profit level of $0.0235, anticipating a favorable uptick as market conditions align. This potential shift is backed by a comprehensive review of volume analysis, pattern recognition, and momentum indicators, which collectively indicate a growing buying interest and potential for price appreciation. Investors and traders are encouraged to monitor these levels closely, as the anticipated movement presents a promising opportunity for those looking to capitalize on JASMY's evolving market dynamics.

JASMYUSDT 🚀 Inverse Head ShouldersHey guys!
Today I'd like to share a JASMY Coin idea. I've spotted an inverse head and shoulder pattern that has formed. Confirmation to the bullish upside would be a breakout and re-test of the zone followed by entry trigger dropping into the lower timeframes.
Confluences:
We need the breakout of the pattern to the upside to confirm bullish reversal. But having this pattern itself after a huge drop, it's pretty awesome.
We've got Ichimoku Cloud breakout which signals bulls are taking over still make sure you have a plan to be certain with your confirmations.
RSI Bullish divergence signaling the bears have lost power for now.
Targets:
1) 0.0050
2) 0.0055
3) 0.0065
4) 0.0070
Stop loss below the cloud or 2 ATR or below swing low. Manage that according to your trading plan.
Let's see how it plays out!
Kina 🚀

Jasmy daily analysiFor the follower who asked for my charts. here is the jsmy daily chart i hope you like it and understand my chat, apologies on the mic, it will improve with time I'm sure
