#JASMY/USDT GOOD TIME TO BUY JASMY I MARK THE TARGETS#JASMY
The price is moving within a descending channel on the 1-hour frame and is expected to break and continue upward.
We have a trend to stabilize above the 100 moving average once again.
We have a downtrend on the RSI indicator that supports the upward break.
We have a support area at the lower limit of the channel at 0.01213, acting as strong support from which the price can rebound.
We have a major support area in green that pushed the price upward at 0.01178.
Entry price: 0.01264.
First target: 0.01308.
Second target: 0.01367.
Third target: 0.01441.
To manage risk, don't forget stop loss and capital management.
When you reach the first target, save some profits and then change the stop order to an entry order.
For inquiries, please comment.
Thank you.
Jasmylong

#JASMY/USDT#JASMY
The price is moving within a descending channel on the 1-hour frame, adhering well to it, and is heading towards a strong breakout and retest.
We are experiencing a rebound from the lower boundary of the descending channel. This support is at 0.01480.
We are experiencing a downtrend on the RSI indicator, which is about to break and retest, supporting the upward trend.
We are in a trend of consolidation above the 100 moving average.
Entry price: 0.01530
First target: 0.01593
Second target: 0.01650
Third target: 0.01720

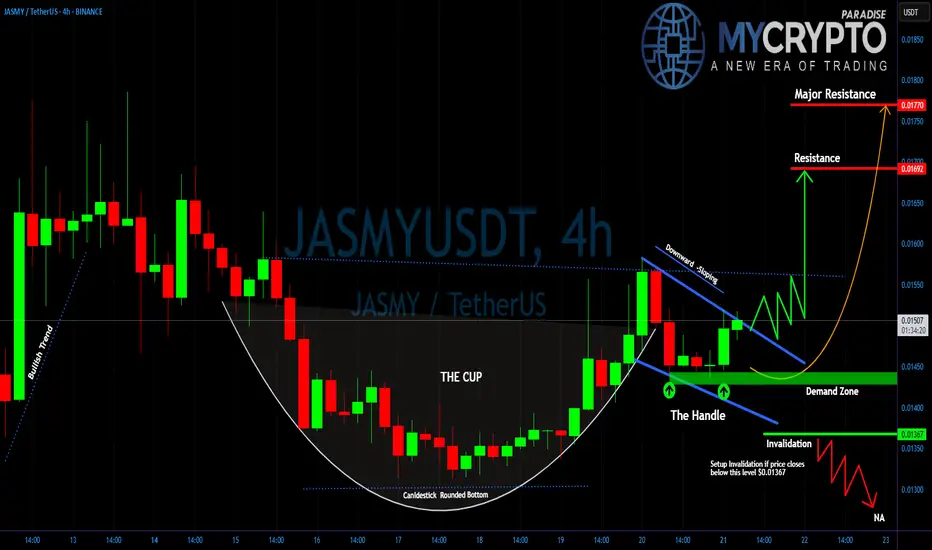
JASMY: Will You Catch the Breakout or Get Caught in the Trap?Yello Paradisers, did you catch the textbook pattern quietly forming on JASMY while most of the market remains distracted? Because what comes next could catch the majority off guard.
💎#JASMYUSDT is currently forming a classic Cup and Handle pattern. After a strong impulsive move, the price retraced in a rounded bottom structure, completing what now looks like the cup. The current consolidation has created the handle a downward-sloping corrective move that’s showing early signs of exhaustion.
💎What adds even more strength to this setup is that the price is now trading above both the 50 EMA and 200 EMA on the 4H timeframe. This signals a solid bullish bias and confirms that the overall momentum remains in favor of the bulls. When the price holds above both moving averages during a consolidation phase, it often indicates that a strong continuation move is brewing.
💎The price is also respecting a well-defined demand zone between 0.01430 and 0.01450. As long as this area holds, the probability of a bullish breakout remains high. A break above the descending handle resistance will be the first true confirmation.
💎If that breakout is supported by volume and sustained price action, we expect a move toward the first resistance at 0.01698. Beyond that, the final target for this pattern lies at the major resistance zone around 0.01785, where significant selling pressure could return. However, discipline is key. If JASMYUSD breaks below 0.01367, the handle structure would be invalidated.
Stay focused, Paradisers. Be the hunter, not the hunted
MyCryptoParadise
iFeel the success🌴
#JASMY/USDT#JASMY
The price is moving within a descending channel on the 1-hour frame, adhering well to it, and is on its way to breaking it strongly upwards and retesting it.
We are seeing a bounce from the lower boundary of the descending channel, this support at 0.1233.
We have a downtrend on the RSI indicator that is about to break and retest, supporting the upward trend.
We are looking for stability above the 100 moving average.
Entry price: 0.01279
First target: 0.01300
Second target: 0.01327
Third target: 0.01360

#JASMY/USDT#JASMY
The price is moving in a descending channel on the 1-hour frame and is adhering to it well and is heading to break it strongly upwards and retest it
We have a bounce from the lower limit of the descending channel, this support is at a price of 0.02046
We have a downtrend on the RSI indicator that is about to break and retest, which supports the rise
We have a trend to stabilize above the moving average 100
Entry price 0.02280
First target 0.02438
Second target 0.02718
Third target 0.02962

#JASMY/USDT Ready to go up#JASMY
The price is moving in a descending channel on the 1-hour frame and is adhering to it well and is heading to break it strongly upwards
We have a bounce from the lower limit of the descending channel, this support is at a price of 0.02380
We have a downtrend on the RSI indicator that is about to be broken, which supports the rise
We have a trend to stabilize above the moving average 100
Entry price 0.02470
First target 0.02670
Second target 0.02955
Third target 0.03210

Jasmy to 1$? More than realGATEIO:JASMYUSDT
Always should analyse coin on exchanges with history! Big difference between chart Jasmy on Binance and GateIO.
When we check weekly tf we can find out more than 400 days Jasmy in accumulation and disbelief zone around -0.618 FIB
Depends of unlock and adding coins in circulation supply, now only 10% coins on market! But also only 48 Mil Market Cap.
So we can find out next sells zone is around 0.25 cents on weekly timeframe (not now) and next big sales will be at psychological target around 1$.
Whales who accumulate coin over than 400 days know what they do!
Hope you enjoyed the content I created, You can support with your likes and comments this idea so more people can watch!
✅Disclaimer: Please be aware of the risks involved in trading. This idea was made for educational purposes only not for financial Investment Purposes.
* Look at my ideas about interesting altcoins in the related section down below ↓
* For more ideas please hit "Like" and "Follow"!

J_A_S-M-Y - Its not Jarvis its JASMYJASMYUSDT - So lets introduce you to the magnet lines! Magnet lines are nothing but are places which suck you to bring at that posiiton to give you a hulk smash. If breaching blackline and if only IFF buyers are heavy you see direct wicks to the orange line, But as mentioned scalps can be done, but im more of a green box fan. Mind i am putting shorts or longs based on my overall prospects I am not giving calls, i am showing directions!

Jasmy Cup and Handle FormationJapan is a heavily regulated country in terms of the cryptocurrency market. Jasmy is a cryptocurrency that is seen as Japan's Bitcoin.
A very clear cup and handle formation is seen in the weekly time frame. Jasmy, which rose after the handle breakout, still appears at the beginning of its rise.
I think Jasmy needs to stay above the HP filter ($0.025) for this rise to continue. As long as it stays above the HP filter, I think Jasmy will come back to the IPO price.

JASMY/USDT Price Analysis: Potential Cup and Handle BreakoutKey Highlights:
Cup and Handle Formation:
The pink curve represents the "cup" part of the pattern, showing a rounded bottom structure. This formation is typically considered a strong signal for a continuation of an upward trend.
Fibonacci Levels:
The red, green, and white horizontal lines represent significant support and resistance levels. These lines resemble Fibonacci retracement levels and indicate where the price might encounter resistance or find support.
Flag/Channel Pattern:
The blue highlighted narrow channel illustrates a consolidation phase, suggesting preparation for a breakout to the upside.
Target Levels:
The blue arrow on the chart indicates an expectation for the price to rise to the 0.09026 level first and potentially continue to the 0.36202 level in a strong bullish move.
The price is currently trading at 0.05321 and seems to have broken through a previous resistance level.
If the price manages to overcome the resistance levels at 0.04258 and 0.09026, this could signal the continuation of the bullish trend.
However, if the price loses the support levels at 0.02585 or 0.01726, there is a risk of entering a bearish trend.
From a trading strategy perspective, it may be worth considering positions above resistance levels or entries near support levels while managing risk effectively.

#JASMY/USDT#JASMY
The price is moving in a descending channel on the 4-hour frame
And it is sticking to it well
We have a bounce from the lower limit of the descending channel and we are now touching this support at a price of 0.018000
We have an upward trend on the RSI indicator that is about to be broken, which supports the rise
We have a trend to stabilize above the moving average 100
Entry price 0.02000
First target 0.02152
Second target 0.02311
Third target 0.02572

Jasmy/ USDT: gearing up for a breakout above trendline resistancJASMY/USDT: Gearing Up for a Breakout Above Trendline Resistance
JASMY/USDT is shaping up for an exciting move 📈 as it approaches a critical trendline resistance zone 📊. The price has been consolidating tightly, creating the perfect setup for a potential breakout 💥. If the breakout happens, we could see a strong bullish trend unfold 🚀. Keep a close eye 👀 on this pair and wait for confirmation before acting.
Key insights:
1. Trendline resistance: JASMY/USDT is nearing a long-standing trendline that has previously acted as a strong barrier. A break above this level could signal the start of a bullish rally.
2. Volume surge: A significant increase in trading volume during the breakout could confirm strong buyer interest 🔥.
3. Bullish signals: Momentum indicators like RSI and MACD are aligning positively ⚡, adding weight to the breakout scenario.
Steps to confirm the breakout:
Look for a clear 4H or daily candle closing above the trendline 📍.
A noticeable spike in volume during the breakout can confirm strong buying activity 📊.
A retest of the broken resistance as a new support zone adds credibility to the move ✅.
Stay cautious of fake breakouts, such as sharp reversals or wicks above the trendline ⚠️.
Potential targets (post-breakout):
Initial resistance:
Next target:
Risk management strategies:
Use stop-loss orders to manage your risk effectively 🔒.
Ensure position sizing aligns with your overall trading strategy 🎯.
This analysis is for educational purposes only and not financial advice. Always conduct your own research (DYOR) 🔍 before making investment decisions.

JASMYUSDT.PShifted Structure to bullish my trigger plan is as simple as it can get we long with a proper retest and aiming for the Buy side liquidity upside.

#JASMY/USDT#JASMY
Our price is moving downwards on a 4-hour frame and is about to break through to the upside in 3 stages
We have a bounce from the lower border of the channel from the green support area at 0.02200
We have a tendency to stabilize above the Moving Average 100
We have an uptrend on the RSI indicator that is heading up
Entry price is 0.02350
The first target is 0.02600
The second target is 0.03000
The third goal is 0.03300

#JASMY/USDT#JASMY
We have a bearish channel pattern on a 2-day frame, within which the price moves and adheres to its limits well
We have a green support area at 0.01500 after the price touched it and bounced from it
We have a tendency to stabilize above moving average 100
We have a downtrend on the RSI indicator that supports the price higher
Entry price is 0.02000
The first target is 0.02400
The second goal is 0.02660
The third goal is 0.03000

JASMYUSDT Flag Pattern!JASMYUSDT Technical analysis update
JASMY price formed a bull flag pattern on the daily chart. With a breakout accompanied by high volume, we can expect a bullish continuation.
Buy zone : Below $0.0260
Stop loss : $0.0217
Regards
Hexa

JASMYUSDTIn exactly 20 days, SEED_DONKEYDAN_MARKET_CAP:JASMY reached the target I had anticipated, resulting in a 50% gain. Congratulations to everyone who benefited! If it maintains stability above the Fib1 resistance, the upward trend is expected to continue. The next target is Fib1.618.

JASMY Set for Breakout? Analyzing Key Levels and MomentumJasmyCoin (JASMY) has been in a downtrend but has recently started to recover. There are two red trend lines indicating an ascending channel, suggesting a potential continuation of the uptrend if the price stays within this channel.
Support Levels:
0.01250
0.01724 to 0.01720
0.00828
0.00306
Resistance Levels:
0.02379
0.03450
0.05012
Price Movements:
The current price is 0.0221.
- The price recently bounced from around 0.01724 and is now facing resistance at 0.02379
- If it breaks above 0.02379, the next resistance is around 0.03450 and potentially 0.05012
There is a noticeable increase in volume during the price recovery, indicating strong buying interest.
Bullish Scenario:
- If the price breaks and closes above the 0.02379 resistance level, it could target the
0.03450 resistance and potentially reach 0.05012 if the bullish momentum continues.
- The ascending channel suggests that as long as the price stays within this channel, the uptrend is intact.
Bearish Scenario:
- If the price fails to break the 0.02379 resistance and falls below 0.01724, it might test the lower support at 0.01250 and possibly 0.00828.
- The stochastic oscillator's behavior should be monitored for potential bearish crossovers that could signal a downturn.

JASMYUSDT#Jasmy SEED_DONKEYDAN_MARKET_CAP:JASMY has formed a beautiful picture on the chart as you can see. One of the best indicators, TD Sequential, has confirmed the upward momentum. If it maintains above the downtrend line, it could reach the targets shown in the chart in a short time.

#JASMY/USDT#JASMY
The price is moving in a triangle on the 4-hour frame and we have a green support area at 0.01850
We have a higher stability of 100% moving forward
Now we have a nice breakout coming up
Our RSI indicator has a trend that is about to break to the upside
Entry price is 0.0815
The first target is 0.02125
the goal. The second is 0.0253
The third goal is 0.02634

JASMY Investment Analysis Hi Everyone
I thought I shared this with you before but I didn't
so here is my analysis and the update for JASMY Coin
Good luck everyone

Another leap for JASMYThe reaction with the demand zone has been done well, now we have to wait for the pullback phase to support
You can make your purchase as soon as you react to this support in the time trigger
Don't forget to like

jasmy coin :) Jasmy getting it in! bullish currently and rising but today with Bitcoin undecided it'll most likely be a very slow rise but it's good to see regardless after some previous drama ... good for them keep rising :)
