JASMY IdeaIf the price does not breaking the bottom of the channel, (due to the end of the fifth wave in the 4-hour chart), then after hitting the bottom of the channel as well as hitting the 30-MA. there is possibility to return to top of the channel.
Pay attention: that the closing of the ascending candlestick inside the chanel, and then, passaging the next ascending candle above the highest price of the closed candle, is a buy signal.
JASMYUSD

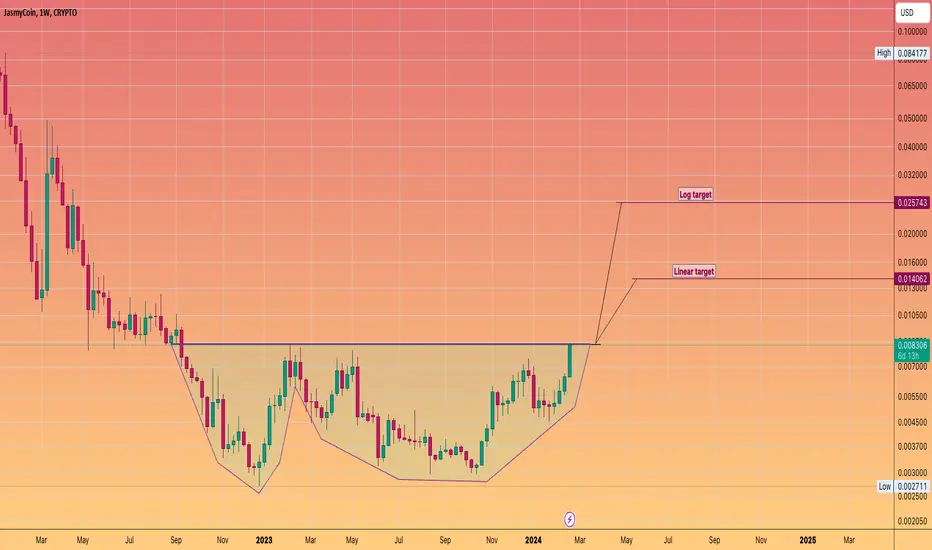
Jasmycoin #JASMY Double Bottom, W pattern on verge of breakout.#Jasmy is mooning today. And is about to clear a key technical level. In what appears to be a W pattern / double bottom. Some analysts are calling for large price targets on this coin in the bull run. And indeed it may go on to reach those dizzying heights that it achieved last Bull Run. My inclination of any Altcoin that has been exposed to a previous crypto cycle, is to temper expectations and generally hope it can reclaim 0.618 fib retracements. With that being said I have not done any fundamental research on this coin. Much like many of the coins I highlight. I just look for good charts and have been hammering the need to accumulate, accumulate, accumulate for over a year now. That work should have been done. i.e. your bags should have been packed. And of the worse mistakes you can do now. Is flip flop, between your altcoins, as you see one moon whilst the other does nothing. This is a sure fire way to screw up this Bull cycle. Only if you have made money on a big cap coin, should u think of rotating. Otherwise stick to what you have.
JASMYUSDTIn exactly 20 days, SEED_DONKEYDAN_MARKET_CAP:JASMY reached the target I had anticipated, resulting in a 50% gain. Congratulations to everyone who benefited! If it maintains stability above the Fib1 resistance, the upward trend is expected to continue. The next target is Fib1.618.

JASMY - Very Strong Hi, This is my new update for Jasmy. One of the strongest coins in this correction from mars is Jasmy, it has only fallen 40% and now it is only down 20% from the top on mars 4th.
Right now we are in descending triangle pattern and we are pressing to break the trendline. We have a major resistance around 0.025-0.027 and I expect once we break the trendline and the resistance, we are going to takeoff +140% to 0.050.
It is also normal if we visit the support level 0.015 again, but if we break the 0.015, things will get very ugly, but as long as we hold the 0.015, I expect the next stop for Jasmy is around 0.050.
Good news is that we are above the 50D and 100D moving averages. The RSI has broken the trendline and the MACD is ready to get bullish momentum.

JASMY BULLISH SETUPJASMY is consolidating for more than 100 days and is now ready explode hardly. A bullish momentum can lead 70 - 80% growth. Low leverage long position or spot call is recommended.

[JASMYUSDT] - on the verge of breakout!Consolidate a bullish pennant pattern in 3D chart and looks it attempt for huge breakout.
Upper side of bullish pennant and 0.618 fib is gathering together.. breakout meaning a 160% bullish from that point
We Appreciated for supporting us with your like and follow for more updates 🎯

JASMY can 545% in a few weeks, buy now!Technical analysis
JASMY is breaking out of the symmetrical range after 520 days. It has been a long time, and this coin can make a 545% profit in a few weeks or days. It's best to buy the coin right now. Sometimes pumps are very fast and steep. I am expecting a strong Elliott Wave impulse wave to happen in the immediate short term.
Let me know what you think about my analysis, and please hit boost and follow for more ideas. Trading is not hard if you have a good coach! Thank you, and I wish you successful trades.
Fundamental analysis
What Is JasmyCoin (JASMY)?
JasmyCoin (JASMY) is a cryptocurrency project of a Tokyo-based Internet of Things (IoT) provider Jasmy Corporation. As a system, the Internet of Things includes mechanical and digital elements endowed with an identifier and the ability to transmit data. The IoT company Jasmy specializes in buying/selling data, and the Jasmy platform connects two categories: service providers and data users.
The Jasmy platform was built to restore and protect the sovereignty of individual data by combining IoT technology with blockchain technology and giving users full control over their personal information. The main goal of the project is to establish a secure environment on the platform where users can exchange data in a trustless manner between IoT devices (computers, cars, phones) and decentralized protocols.
The mission of Jasmy developers is to create an environment by shaping an infrastructure where users can easily, safely and smoothly use data. As a result, Jasmy aims to provide its users with a powerful infrastructure, an intuitive interface and a secure environment for storing and sharing data. In the Jasmy space, information can be transformed into personal assets.
Jasmy decentralizes the workflow with edge computing and storing data on IPFS (InterPlanetary File System). The philosophy of the project is based on the democratization of data using a decentralized model, where data is securely protected and owned by an owner, and service providers get the opportunity to promote their services/business using data (owned by users).
Let me know what you think about my analysis, and please hit boost and follow for more ideas. Trading is not hard if you have a good coach! Thank you, and I wish you successful trades.

JASMY ANALYSISRisk warning:
This coin is included in the high-risk symbols of Binance and may be removed from Binance at any moment, usually the currencies that are removed from Binance have a heavy drop.
JASMY has created a large and time-consuming base, and then JASMY has left this base with a sharp move.
We have a big IFC move on the chart and there is also no pullback to the BASE range.
It is expected that a pullback to the base will be done with high volatility, and then the main and upward rally will be created.
The targets are clear on the picture.
This analysis will be violated if the weekly candle closes below 0.00440.
We are looking for buy/long positions in the green range.
For risk management, please don't forget stop loss and capital management
When we reach the first target, save some profit and then change the stop to entry
Comment if you have any questions
Thank You

JASMYUSDT#Jasmy SEED_DONKEYDAN_MARKET_CAP:JASMY has formed a beautiful picture on the chart as you can see. One of the best indicators, TD Sequential, has confirmed the upward momentum. If it maintains above the downtrend line, it could reach the targets shown in the chart in a short time.

JASMY LOOKS BEARISH From where we entered "start" on the chart, it seems that JASMY has entered a triangle pattern.
In wave E, the last wave of this triangle can be completed and we can see a drop.
We specified the targets on the chart, the final target is the green line (TP).
Closing a daily candle above the invalidation level will violate the analysis
invalidation level : 0.022833
For risk management, please don't forget stop loss and capital management
When we reach the first target, save some profit and then change the stop to entry
Comment if you have any questions
Thank You

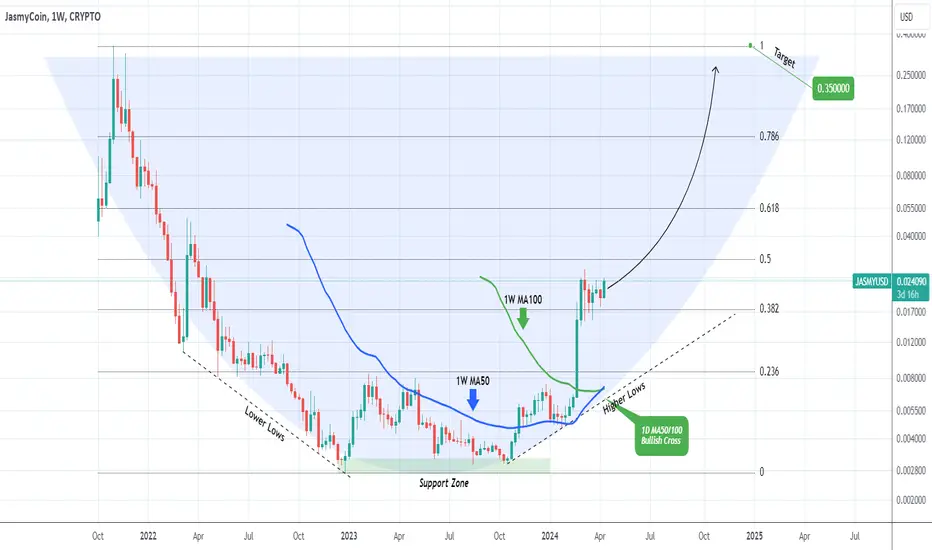
JASMYUSD Giant Cup leading straight to ATH.JasmyCoin (JASMYUSD) is picking up the pace again after 6 weeks of consolidation. The long-term pattern that is emerging is a Cup (potentially we may see a Handle at the top) and this sideways trading the new accumulation before the next Bullish Leg.
Technically it should continue filling up the Fibonacci levels as gaps, with the next being the 0.618 Fib (0.055) and the 0.786 (0.1200) all the way until the All Time High (ATH). As a result our long-term Target is 0.3500.
-------------------------------------------------------------------------------
** Please LIKE 👍, FOLLOW ✅, SHARE 🙌 and COMMENT ✍ if you enjoy this idea! Also share your ideas and charts in the comments section below! This is best way to keep it relevant, support us, keep the content here free and allow the idea to reach as many people as possible. **
-------------------------------------------------------------------------------
💸💸💸💸💸💸
👇 👇 👇 👇 👇 👇
✅TRADE REVIEW: $JASMYUSD- Opening a position.
- Very risky so I have positioned sized accordingly
- Very tight stop as well
I want to see this GO right away and have no patience
It is a lower quality name in an uncertain market.
I see above average volume moving up.
Consturctive pattern.
If you are aware of the High Tight Flag (or PowerPlay) concept in stocks, I use this analogy when I trade crypto. The HTF requires a +100% move up (powerful) and less than 20% correction - indicating stong buyers piling into the stocks. I extrapolate this logic into the more volatile crypto names as I would like to see less than 20% retracement of the gain. To explain further, JASMYUSD has soared +450% since Feb2024. I would take 20% of 450% and allow this stock to correct up to 90% to be a valid base. Currently it has corrected only 40% and is staring to move up with great volume patterns. Hence why I have been willing to risk capital into this TRADE.

#JASMY/USDT#JASMY
The price is moving in a triangle on the 4-hour frame and we have a green support area at 0.01850
We have a higher stability of 100% moving forward
Now we have a nice breakout coming up
Our RSI indicator has a trend that is about to break to the upside
Entry price is 0.0815
The first target is 0.02125
the goal. The second is 0.0253
The third goal is 0.02634

Breakthrough in Play?JASMY is currently trading at $0.02150, capturing the attention of traders with a notable last day increase of over 15%. This surge in price is underscored by a substantial trading volume, suggesting strong market participation in this movement.
The technical indicators exhibit mixed signals: The Bollinger Bands indicate that the price is nearing the upper band, which can act as a resistance level. A breakout above this band could suggest continuation of the upward trend, but as the price approaches this upper band, traders should be cautious of potential pullbacks.
The MACD shows a bullish trend, with the histogram in positive territory and the MACD line above the signal line, indicating current momentum may carry forward. However, traders should look for continued positive histograms to confirm the persistence of this trend.
The RSI, while not in overbought territory, leans towards the higher end, suggesting that there may be some potential for upward movement before the market considers the asset overbought. Yet, caution is warranted as it approaches the 70 level, which is often interpreted as a sign that a pullback could be forthcoming.
The Stochastic oscillator (%K and %D lines) are not in the overbought zone either, but they are trending upward, which typically supports the bullish sentiment.
The chart annotations highlight a breakout with a need for confirmation. This means that while JASMY has pushed past a resistance level, traders should seek further bullish signs to confirm the breakout's sustainability, such as higher highs and higher lows, as well as support levels holding strong in case of a retracement.
In summary, JASMY shows promising bullish signs, but it faces a critical test as it encounters strong resistance levels. Traders should monitor these levels and look for confirmation before drawing conclusions about the continuation of the trend.

JASMYexpecting something like this from JASMY.
Right now we are in w4 of 3 soon to start wave 5 of 3.

JASMY → still running!hello guys...
as you can see this coin break an ascending channel and touched the next level!
the last move was a sharp one and we can expect the next upward movement start from the blue area!
the next target is 0.028399
___________________________
💻📞☎️ always do your research.
💌📫📃 If you have any questions, you can write them in the comments below, and I will answer them.
📊📌❤️And please don't forget to support this idea with your likes and comment

JASMY-USDT / 15 M / TECHNICAL ANALYSIS "HELLO TRADERS, I HAVE DETERMINED THE FORMATION TARGET ON THE CHART."
Like and comment if you find value in our analysis.
Feel free to post your ideas and questions at the comments section.
Good luck

JASMY Investment Analysis Hi Everyone
I thought I shared this with you before but I didn't
so here is my analysis and the update for JASMY Coin
Good luck everyone

JASMYUSDT Looks Good For BuyJASMYUSDT Technical analysis update
JASMY price breaking its resistance level on the daily chart after a 500-day consolidation period.
and price formed a W pattern in the day chart.
Buy zone : Below $0.0085
Stop loss : $0.0070
Regards
Hexa

JASMY LOOKS BULLISH (1D)According to JASMY, a bullish triangle has been completed, and the last wave of the triangle, i.e. wave e, has also been completed.
Now we have another good range for rebuy which we have marked on the chart.
If the price pullback on this range, we will look for buy/long positions in this area.
Closing a daily candle below the invalidation level will violate the analysis.
For risk management, please don't forget stop loss and capital management
When we reach the first target, save some profit and then change the stop to entry
Comment if you have any questions
Thank You

JASMY LONG SETUPHi, dear traders. how are you ? Today we have a viewpoint to BUY/LONG the JASMY symbol.
For risk management, please don't forget stop loss and capital management
When we reach the first target, save some profit and then change the stop to entry
Comment if you have any questions
Thank You

JASMY LOOKS BEARISH (4H)A bearish triangle appears to be ending on the JASMY chart.
We have two good supply ranges to start a bear move. In our opinion, JASMY now has the potential to start its bearish movement from supply 2.
We have specified the target on the chart. We also specified the invalidation level. Closing a daily candle above this level will violate the analysis
For risk management, please don't forget stop loss and capital management
When we reach the first target, save some profit and then change the stop to entry
Comment if you have any questions
Thank You

JASMY LOOKS BULLISHJASMY has an ascending structure. A liquidity pool is formed in the lower areas. If it reaches the green range, we will enter the position . It is expected to start another upward movement by collecting these pools
The targets are marked on the picture or risk management, please don't forget stop loss and capital management
When we reach the first target, save some profit and then change the stop to entry
Closing 1 daily candle below the green range will violate the analysis
