JNJ approaching support, potential for a bounce!
JNJ is expected to drop to 1st support at 129.46 where it could potentially react off and up to 1st resistance at 129.67.
Trading CFDs on margin carries high risk.
Losses can exceed the initial investment so please ensure you fully
understand the risks.
JNJ

JNJ potential reversal!
JNJ expected to rise up to 1st resistance at 133.41 where it could potentially react off and drop down to 1st support at 126.99.
Trading CFDs on margin carries high risk.
Losses can exceed the initial investment so please ensure you fully
understand the risks.

Get High Returns: Long PsycheMedicscompany with a few decades of history, niche product/ market, remains fairly innovative
debt vs. cash +cash flow is net positive. low share count float
Buyout Target

J&J vs opioids (Johnson is winning)Fundamental analysis
In one of the first state opioid cases, an Oklahoma judge ruled against Johnson & Johnson, awarding the state $572 million, well below the over $17 billion the state was seeking in damages.
Meaning... out of the 17 billion, they lost only 3.36%, and they expect to appeal the case, probably lowering this amount.
Technical analysis
On a technical analysis, I still think the risk reward ratio is too small to enter a position now. But technicals are good (not great). So I am keeping this on my watchlist.

Johnson & Johnson updateRight shoulder worked well, now at a key weekly 200SMA. Further trade actions remain to be seen depending if we manage to close below the SMA. Move stops from shorts to capture profit. Overall still looks like a massive H&S setting up to break.
Good Luck!

JNJ, Johnson & Johnson - Potential Upward BreakoutNYSE:JNJ
Do you know Johnson & Johnson? Top company in the Healthcare sector that is forming a zone of accumulation with potential upward breakage on this rising triangle and if so we would be interested in re-entering Long on this asset that we still have in our portfolio in the long term.
Why Technical Analysis? Ask Peter Brandt...

DIRTY JUDGES & POLITICIANS. LAWSUITS SHOULD BE THROWN OUT!IT IS SIMPLY OUTRAGEOUS TO HOLD ANY PHARMACEUTICAL COMPANY LIABLE FOR SCRIPTS DOCTORS WROTE AND SCRIPTS THAT DRUG STORES / PHARMACIES FILLED BECAUSE OF THE DOCTORS NEGLIGENCE!
WHY DON'T WE SEE CVS, WALGREENS AND WALMART LISTED AS DEFENDANTS? THEY KEPT FILLING SCRIPTS...DIDN'T ANY RED FLAGS FLASH ON THE SCREEN..?
IN FACT, WHY DON'T WE SEE THE SALES REPS FOR THE PHARMACEUTICAL COMPANIES NAMED AS DEFENDANTS? THEY VISIT DOCTORS DAILY PUSHING THE DRUGS TO THEM!
DOCTORS DO NOT HAVE TO WRITE SCRIPTS FOR PATIENTS BUT THEY DO AND THEY KNOW THE SIDE EFFECTS OF WHAT THEY ARE PRESCRIBING BECAUSE THE SALES REPS TELL THEM.
WHY NOT SUE THE DOCTORS? THE DOCTORS, MANY, IF NOT ALL, ARE NOT INSURED NOR ARE THEY CASH RICH...ONE SMALL LAWSUIT WILL BANKRUPT THE ENTIRE INDUSTRY OF DOCTORS!
THE CORRUPT STATES GO AFTER THE EASY MONEY BECAUSE THEY KNOW IN THE END, IT'S NOTHING BUT A SCAM. IT TURNS OUT TO BE A HUGE PR FIGHT TO RUIN BIG PHARMA SO THE PHARMACEUTICAL COMPANIES ARE AFRAID OF THEIR REPUTATIONS BEING RUINED & THEY CAVE IN AND SETTLE LIKE HENS IN A HEN HOUSE BUT THERE'S NOBODY LEFT TO COUNT THE CHICKENS!
AS FOR THE STATES TRYING TO USE A LAW SIMILAR TO...READ ON...
N. A STATUTE (DRAM SHOP ACT) OR CASE LAW IN 38 STATES WHICH MAKES A BUSINESS WHICH SELLS ALCOHOLIC DRINKS OR A HOST WHO SERVES LIQUOR TO A DRINKER WHO IS OBVIOUSLY INTOXICATED OR CLOSE TO IT, STRICTLY LIABLE TO ANYONE INJURED BY THE DRUNKEN PATRON OR GUEST. (DO YOU EVER SEE BIG LIQUOR COMPANIES SUED FOR DRUNK DRIVING FATALITIES..? NO, BECAUSE THEY CANNOT WIN!)
THIS IN ITSELF IS OUTRAGEOUS AND SHOULD NOT STAND IN A LAWFUL COURT OF LAW!
THE CASES / LAWSUITS AGAINST THE BIG PHARMACEUTICALS ARE VOID OF FACT AND EVIDENCE! THE PHARMACEUTICAL COMPANIES DON'T EVEN KNOW THE VICTIMS!
WE FEEL BAD FOR THE FAMILIES THAT LOST LOVED ONES BUT TO GO AFTER THE PHARMACEUTICAL COMPANIES FOR SOMETHING A DRUG DEALER SOLD, A SCRIPT A DOCTOR WROTE OR A PHARMACY FILLED, IS SIMPLY CONTEMPTIBLE AND DISGUSTING!
USE THE WEAKNESS TO LOAD UP / PICK ON DIPS, BIG NAME PHARMACEUTICAL STOCKS INVOLVED WITH THIS OUTRAGEOUS UNLAWFUL MESS!
DON'T GO ALL IN UNTIL THIS MESS IS OVER! BUY THE DIPS...KEEP LOWERING YOUR COST BASIS WHEN A GOOD DIP HAPPENS.
DISCLAIMER
This website and our posts are for general information only. No information, forward looking statements, or estimations presented herein represent any final determination on investment performance. While the information presented in this website and our posts has been researched and is thought to be reasonable and accurate, any investment is speculative in nature. StockKid, and/or our agents cannot and do not guarantee any rate of return or investment timeline based on the information presented herein.
By reading and reviewing the information contained in this website and our posts, the user acknowledges and agrees that StockKid, and/or our agents do not assume and hereby disclaim any liability to any party for any loss or damage caused by the use of the information contained herein, or errors or omissions in the information contained in this website or our posts, to make any investment decision, whether such errors or omissions result from negligence, accident or any other cause.
Investors are required to conduct their own investigations, analysis, due diligence, draw their own conclusions, and make their own decisions. Any areas concerning taxes or specific legal or technical questions should be referred to lawyers, accountants, consultants, brokers, or other professionals licensed, qualified or authorized to render such advice.
In no event shall StockKid, and/or our agents be liable to any party for any direct, indirect, special, incidental, or consequential damages of any kind whatsoever arising out of the use of this website, our posts or any information contained herein. StockKid, and/or our agents specifically disclaim any guarantees, including, but not limited to, stated or implied potential profits, rates of return, or investment timelines discussed or referred to herein.

JOHNSON & JOHNSON 1D IS IN A RANGE & BEARISG FLAGBearish Flag is a form of range pattern
Ranges, Descending Triangles, Triangles, & Ascending Triangle are repeatable trading chart patterns.
Triangles and ranges are consolidation chart patterns that can breakout either direction.
Ascending and descending chart patterns will have a directional bias depending on the previous incoming trend.
Each chart pattern will have defining trendlines of the support/resistance levels creating the pattern.
What ever time frame you are trading this chart pattern, wait for a candle close outside of the trendline in the direction of the breakout candle. (Our time frame preference is the Daily chart ).
Add volume indicator - Volume is the amount of $ that went into a particular candle or in Forex the # of trades that took place.
Add ATR indicator - Volatility is the amount of price movement that occurred. Use the ATR to measure the price movement.
When you see descending volume bars and descending atr line (which indicates volatility ) this shows
a dis-interest in traders to invest in this pair creating consolidation which creates the chart pattern.
Trade Management after there is a breakout candle close.
1 - Position size (compare volume bar to volume ma line).
a - Breakout candle must be 100% of average volume for a full position size.
b - If 75% of average volume then ½ position size.
2 - Enter two trades.
3 - SL for both trades will be 1.5 x ATR.
4 - 1st trade TP will be 1 x ATR.
5 - No TP on 2nd trade – letting profit run and adjusting SL to follow price.
6 - When 1st TP hit – move 2nd trade SL to breakeven.
7 - Adjust the 2nd trade SL to follow price.
*8 - When breakout candle is more than 1 ATR from breakout candle open.
a - Enter 1st trade at candle close with ½ position size.
b - Enter 2nd trade with a pending limit order that is 1 ATR of breakout candle open.
c – Price should pullback to that pending limit order for 2nd trade.
d – If Price returns back into chart pattern close trade before SL is hit.

JNJ potential movesIf it forms a head and shoulder that is bearish, if it makes a new high find a good price on way down as the new high is bullish

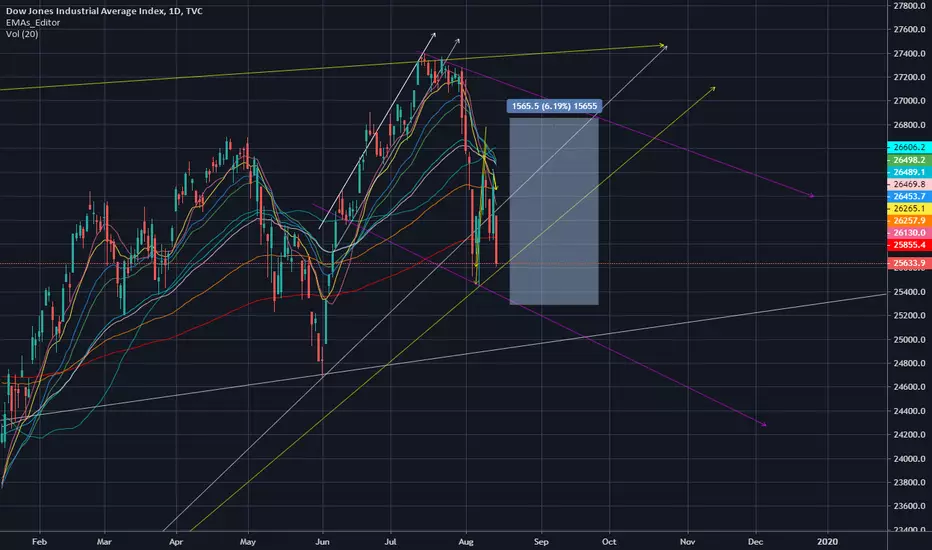
DJI Trading Range? DJI
Just my chart view.
I like $JNJ here as a staples/safety play. It has some room to catch up to $PG
JNJ 200MA TradeJNJ has bounced off the 200MA. The last two moves pushed slightly through it, hence my entry at 137 for another touch, with a stop of c.1% (135.50) below the MA and parallel channel line, and a modest target of 143, the Sep 18 high, giving a 4:1 trade.
The 2018 price/action below the MA shows this stock does take that indicator into account. Note also a fairly good match to the previous climb.

JNJ Sideways and declineJNJ debit spread 130/120 Put spread 2.53 debit Max profit is 7.47 exp September 20th.
I have a pretty long debit spread on JNJ its a high reward low risk trade.
I think it may continue lower slightly and hit my target which in this case will be $5 on the spread.
If I lose and it rises and stays above 135 etc. I will close the trade on August 30th for a loss and salvage anything that I can.
This is a journal entry and not trading advice.
Double bottom breakdown and sideways movement is my prediction since we're in a bull market it may move higher.

"Joe's earning season preview" EP02 : Let's Rock'n roll!The earning season already take places!
Let's check out the major names that will have their earning report this week with me yo!
Mon: C
Tue: GS, JPM, JNJ,WFC,UAL, IBKR
Wed: ABT, BAC, NFLX
Thur: MSFT, MS, UNH
and I got only 20 minutes so I didn't record down Friday names like AXP, BLK, and SLB!
Let's see how they go this week yo!


THE WEEK AHEAD: IBM, JNJ, NFLX EARNINGS; GDXJ, GLD, SLV, GDXEARNINGS
IBM (54/26; Thursday), JNJ (56/23; Tuesday before market open), and NFLX (35/41; Wednesday after market close) announce earnings next week. Unfortunately, all of them have less than ideal metrics for a volatility contraction play (>70% rank/>50% implied), so I'm likely to pass on all of them. That being said:
Pictured here is an IBM 130/135/150/155 iron condor in the August cycle paying 1.53, break evens at 133.47/151.53, and delta/theta metrics of -2.47/2.80. The rank/implied metrics aren't ideal here (<70%/<50%), which is probably why it's also paying less than my idea one-third the width of the wings in credit. I would pass on it if you can't get filled for 1.67 or greater ... .
BROAD MARKET
TLT (31/11)
QQQ (8/17)
IWM (7/15)
SPY (6/12)
EEM (3/16)
EFA (5/10)
Short-term, broad market premium selling is about as crappy as it can get here. Your options are to (a) wait for a pop in volatility; or (b) sell something farther out in time where the expiry implied is higher. I will probably opt for the latter if we don't get an uptick in volatility by July opex, since waiting can be unproductive, particularly if low volatility has infected the entire market and it becomes a "protracted thing."
SECTOR EXCHANGE-TRADED FUNDS
Premium selling opportunities are in gold and the miners for yet another week ... .
Top 5 By Rank: GDXJ (73/34), GLD (72/15), SLV (70/20), GDX (45/28), and TLT (31/11). Metrically, the most "ideal" play is in GDXJ (exchange-traded fund ideals: >50% rank/>35% background), although we're getting somewhat short in duration for another play in the August cycle. There isn't a September expiry available yet (there will probably be one after July expires), so it might be worth a look at GDXJ next week should volatility hang in there for a September play.
IRA TRADES
Not doing a ton here beyond managing my covered calls post-opex. Stuff on my shopping list (XLU, XLP, HYG) has all ground higher along with the rest of the market, so I just have to patient for another one of those December style "sell everything" dips or a major uptick in volatility in those instruments.* Although I have "not a penny more" short puts on in HYG, both XLP and XLU are out of range of that kind of play, it seems, unless I want to go far out in time and get paid very little ... .
* -- XLU (10/14), XLP (29/11), HYG (13/6).

Potential Buy for JNJ Great potential dip buy opportunity for Johnson and Johnson. Wait for confirmation of higher highs and and higher lows before taking trade. Once it has reversed into an uptrend trend, trade can yield a potential 5-8% return.

Shorting JNJ sharesOn the daily chart, the instrument has started a new bearish trend as the price is moving under the Alligator indicator with AO below the zero line after divergence in the correction. I expect the price to continue the downfall if we break the recently formed sell fractal. My TP and SL levels are marked on the chart.


JNJ: Stuck in a trading range, buybacks are supporting the stockA weekly chart reveals the long-term trading range in which JNJ has been stuck. This Dow component ran up due to buybacks around the start of this year. But the trend and volume-based indicators show a lack of quiet accumulation by Dark Pools. The stock slid down ahead of its earnings release today and gapped up slightly on the report, but there has been considerable profit-taking today as well. So JNJ remains bound in a narrower range just below the trading range highs, where it could languish for some time.


JNJ LOngBouncing off the channel and trying to defend the 100 ema #technicalanalysis #chartpatterns #Gann #JNJ

JNJ - Weekly Review Feb 25 - Mar 01Weekly Outlook chart is in the related ideas. JNJ ran up on the first day of the week. Couldn't hit daily profit target and sold off after hitting the upper trend line of the channel, pulled back the next couple of days and then made a move up and hit both daily and weekly profit targets before selling off and then finally on Friday it broke and closed above the targets finding resistance on the monthly resistance.

$JNJ - Weekly Outlook Feb 25 - Mar 01$JNJ is in a up trending channel and pushing against the upper trend line of the channel. I am seeing resistance area at 137.80 - 138.30. It bounced off daily support nicely and headed straight up. I feel confident it will hit the first profit target 137.80 early next week. This is where you should be taking profits if you are in JNJ. If JNJ runs next week, second profit target 139.55 is also possible.
I got into JNJ when I saw it successfully bounced off support and I will exit my position when it hits 137.80 which could be Monday or Tuesday (unless for any reason market sells off at the start of the week). For a longer-term JNJ perspective, Mar 04 looks to be the date when FDA is expected to give its approval on the JNJ's new depression drug. Once approved, JNJ can see a decent pump.
US-China trade news can make it go in either direction. Deadline of Mar 01 is next week. Next week is news critical. Markets will make moves depending on what kind of trade-related news we get.
If you would like me to analyse a stock ticker, please feel free to mention in the comments.
News article for JNJ's new depression drug: www.businessinsider.com
