PT still 157 JNJ is next. Entered this at .59. Down 8$. Should have a nice run up during the week for running. The good thing is that the call is for 7/24 so theta won't crush us. PT is 157. Closed above the resistance and looks like it's ready to break out of its down trend. Will sell for profit Wednesday. Don’t want to hold through earnings.
JNJ


JNJ 157 PTJNJ has earnings this week. Resistance is at 144.65. Going to watch it break. Broke out of its channel. It's moving sideways, so going to need the Monday candle to determine where we are going. Will most likely buy the 150 call for July 24th to give me a some time for movement as well as keep theta from smacking me. Play smart please

JNJ descending channelJohnson's and Johnson's is in a descending channel for more than two months . watch the resistance and support once there is a breakout it might lead to a strong trend upward or downward depending which line will break resistance or support !

JNJ Long Set-upJNJ
ENTRY = 618 Reaction @ 138 or a break above and a hodl of the 200ema on Daily @ 142
1st Target = 786@ 146
HODL Target = 157+
________________________________________________
This content is for informational and educational purposes only. This is not in any way, shape or form financial or trading advice.
Good luck, happy trading and stay chill,
2degreez

JNJ, Do you see a flag?I'be been following this stock since I entered around May.
For me, the last bear candle confirmed a bull flag pattern.
Is this ok? Let's make it possible together.
Best!

MARKET OVERVIEW 👨👩👧👦 | $SPY + $APPL + $JNJ + $JPM + $T📊📊📊Let's take a look at the S&P, Apple, Johnson and Johnson, and AT&T. Today we are looking to see if we can find the direction of the market going into the week by analyzing some top S&P holdings that are indicative of different key sectors.
The idea is to look at two bullish sector charts Apple (tech) and Johnson and Johnson (healthcare), and two bearish charts JP. Morgan (financials) and AT&T (communications), to see if we can find the direction of the market.
While our money is on more upside eventually (especially with Apple making an All-Time High (ATH), zero interest rates, and stimulus outweighing temporary slow recovery concerns), we want to know if the bears of the market pull us down or the bulls can sustain continued uptrend going into the week.
This write up took a long time so please Hit that 👍 button to show support for the content and help us grow 🐣
---
S&P 500 Index
Support S&P:
We have found a reaction on the S1 major price pivot point at the S/R flip. This is of course the ideal spot for the bulls to find support. If that last wick was the only test of this level we end up getting, all the better for the bulls.
If we do need to test lower levels, then the S2 untested bullish orderblock right below us provides another chance at retaining a bullish market structure.
If neither of these hold, the bulls have one last chance at the uptrend with the S3 orderblock cluster and previous range lows. A grind down to this level like we see with AT&T seems like one possible pathway there.
Resistance S&P:
The main resistance we will be looking at with most of these charts is seen in the S&P's R1 orderblock cluster at the previous swing high.
Regardless of where we find support, this resistance will be the main point of contention.
---
Apple
Support APPL:
Apple is by far the most bullish asset here. It is also the top holding of the S&P. The major support for Apple is the S1 orderblock and S/R flip cluster at the previous All-Time High. For the rest of the market to retain a bullish structure, S1 holding is key.
If S1 can't hold, the S2 orderblock and gap-fill is the next best hope for the bulls. The bulls don't want to see any weakness for Apple, so holding these levels and making new highs is key.
Resistance APPL:
Apple resembles the S&P, and that is logical because it is the biggest S&P holding. Rejection at R1 for Apple means no new ATH. Breaking R1 means a new ATH. How Apple reacts matters for the market. We see this one being broken eventually, but it has to happen sooner rather than later to lift the rest of the market up and avoid a "slow recovery."
---
Johnson & Johnson
Support JNJ:
The S1 orderblock and gap-fill on JNJ is about to be tested and is the ideal support. Finding support here means another point for the S&P bulls because we get JNJ working for us and not against us.
If S1 can't hold, we have S2 not too far away, this plays into the S&P's S2 holding as well. A dip this low isn't ideal, but the bullish market structure isn't broken if S2 holds.
Resistance JNJ:
JNJ has been correcting longer than most of the stocks on this chart. Of course, it also has a more bullish overall structure than our JPM and T bearish charts. For JNJ though, the longer correction means more levels of resistance, both the R1 S/R and orderblock and R2 S/R stand in the way for JNJ. This makes it a little harder to rely on than Apple from a pure TA perspective.
---
J.P. Morgan
Support JPM:
Big banks have their pros and cons right now, but for the market to reflect those pros S1 holding is ideal. JPM could be off to the races, or it could be making a drawn-out bottom formation.
A retest of S2 gives weight to that long drawn out bottom, therefore the big bank and S&P bulls want S1 to hold so we can maintain momentum.
Resistance JPM:
The primary resistance for J.P. Morgan is the R1 orderblock at the prior swing high. The recent market structure is similar to Apple and the S&P as a whole, it is only the previous structure that signals that JPM is a weaker asset currently. Some good JPM fundamentals could help the S&P here.
---
AT&T
Support T:
AT&T is the most bearish S&P holding we are charting. It lost its major support and is onto the S2 S/R and orderblock cluster. If this one doesn't hold, giving us a higher low, then we are simply retesting the COVID lows. If major holdings start breaking down to new lows, its a bad look for the market. The best way to avoid making new lows is not to retest old lows and instead to make lower highs. This is what the bulls want from T.
Resistance T:
Even though this is the most bearish chart, there isn't a ton of noteworthy resistance, which is a good thing. R1 is the main resistance for T. This range is notable as it was a previous resistance as well, T has this in common with the S&P... which helps confirm R1 being an important level to breach for the bulls.
---
Summary:
The S&P rallying from here or consolidating above S1 would be ideal for the bulls. For this, we need the more bullish S&P holdings like APPL and JNJ to hold their respective support levels and then rally while weaker holdings like JPM and AT&T avoid too much further correction.
If some of the weaker holdings can find support at their current ranges, or perhaps even at the next range down while the more bullish holdings stay their ground, then we could still be looking for S1 and S2 to hold for the S&P.
However, if the market tries to go bear, then we would more be looking big tech like Apple to hold up the rest of the market like Atlas while we eye S3 for support for the S&P.
It seems unlikely that we make new lows, and so we are looking for support to hold overall, but a trip down to S3 certainly will have an overall market recovery mimicking the slower recovery noted by the FED and this scenario likely results in retests of the bottom for some of the weaker S&P holdings.
Will the S&P pull an Apple and aim for new All-Time Highs, will it correct for a bit like JNJ perhaps taking us to S3, or are we going to get a JPM and T style upset? That is the question.
Resources:
www.zacks.com + www.nytimes.com

The Baby Powder Gives You Cancer! 😯 (JNJ)📈 Failed to breach through the highs, but the fight ain't over yet!
Downward channel identified. Seeing a lot of rejection at this channel top as we approach a critical level of support at 143.47.
You want to long when the downward black Resistance gets cracked. Otherwise short 143.47 break and see if the bottom channel support holds.
Critical to use the ema dots and the Crossover strategy at that 143.47 level for a more aggressive long if held.
Could be double top or could be cup and handle. 🤷♂️
Play the channel.
Best of luck! 🎲
🥇MLT | MAJOR LEAGUE TRADER

Johnson & Johnson (JNJ) short.All description on the chart.
Please, don't forget to like and follow.
Thank you.

JNJ Flag Triangle ABCD Trendline PatternGood combination of bullish pattern. Look like its breaking out toward 153.7. Daily - 155. Daily still look good but weekly chart seems pretty risky.

JNJ.. keep watchingJNJ in resistance level for the 6th time. Will be another supply zone or will it break-out? if breaks 149, will be bullish.. keep watching

Johnson & Johnson Corrective Wave May End Soon!After the motive wave on JNJ, the stock is now going through some corrections. Now that the stock price is close to the lower part of the bullish wedge, any rejection with a strong bullish candlestick could cause the price to re-test its upper part...
N.B
- Let emotions and sentiments work for you
-ALWAYS Use Proper Risk Management In Your Trades

Johnson & Johnson Technical AnalysisWait Before buying - check if the support level will not be broken before buying, otherwise hold
Fundamental Analysis
Johnson & Johnson (NYSE:JNJ) began researching vaccine candidates in January, as soon as the COVID-19 sequence became available.
A Phase 1 clinical trial of the novel coronavirus vaccine is planned for September, with data regarding safety and efficacy available by the end of the year. If all goes accordingly, the vaccine could be ready “for emergency use” in early 2021.
As part of this commitment, Johnson & Johnson will scale up its manufacturing capacity in the U.S. and other countries in order to enable the supply of more than 1 billion doses of the vaccine when it is ready.

Johnson & Johnson Trade Idea #JNJThere's an old saying that goes by "Sell in May, and go away until Labor Day"
As #JNJ continues to make lower lows, by bias is shifting towards the bearish outlook.
I know sometimes it's tough deciding when to close positions and lock-in profit because you fear you might miss out on the right opportunity to re-enter the trade. If that's the concern, what I suggest is to continue to manually trail a pending "Buy Limit" order above the highs of each candle. As the price continues to fall, continue to manually adjust the trailing pending buy limit. This way once price action makes that higher high, our trading platform will automatically execute our buy position from the pending buy limit order.
If anyone has any questions, feel free to leave them in the comment section below.
Trade Safe - Trade Well
Warm Regards,
Michael Harding

Will this be a great VBIV buy in?I've been actively trading the recent VBIV bull run, and I still expect the bull run to continue from now until year's end. However, the stock is up over 100% in a very short time, and this may be the correction to this rapid movement.
I'm not actively trading this idea yet, but I will update the idea if I decide to short.
Remember folks, just ideas!

JNJ - even essential companies are going to slow down!Along with Tech stocks, essential companies like JNJ are experiencing resistance. This isn't the cleanest pattern nor my typical level for the stop of this pattern, however given the surrounding environment of other stick in this sector - I like this risk/reward for the first target.

Gild Bullish trend-line PlayGilead Sciences , Inc., a research-based biopharmaceutical company, discovers, develops, and commercializes medicines in the areas of unmet medical needs in the United States, Europe, and internationally. The company's products include Biktarvy, Descovy, Odefsey, Genvoya, Stribild, Complera/Eviplera, Atripla, and Truvada for the treatment of human immunodeficiency virus (HIV) infection; and Vosevi, Vemlidy, Epclusa, Harvoni, and Viread products for treating liver diseases.
Entry $77.50 area
Target $2 trailing stoploss
I been trading this stock for over a year now and once it form it's base, it usually hold itself very well in it's pattern.
we could've easily scalped this stock multiple time this month for easy gain if you just buy the dip at the trend line with a tight stoploss.

JNJ holding the daily 30WMA and coming out of the triangle patteJNJ holding the daily 30WMA and coming out of the triangle pattern very wel


JNJ: Bearish Breakdown Analysis 4H (Apr. 26)X FORCE GLOBAL ANALYSIS:
Johnson & Johnson has shown great momentum in its small rally over the past few weeks. However, technicals demonstrate signs of prices having temporarily topped out.
Technical Analysis
- The first thing we spot is a textbook bearish divergence.
- Prices form higher highs, while the Relative Strength Index (RSI) forms lower highs
- The Moving Average Convergence Divergence (MACD) has formed a death cross, with increasing bearish histograms
- We have broken down from the ascending parallel channel, and the support has now become resisance
- Prices have been testing the upper resistance of the Bollinger bands, and a test of the lower support is highly likely
- We have two price gaps on the 4H chart, waiting to get potentially filled
- The volume is decreasing as bearish tensions increase
What We Believe
Although JNJ is a fundamentally sound stock, and still great for the long run, short term technicals demonstrate a potential downside.
Trade Safe.

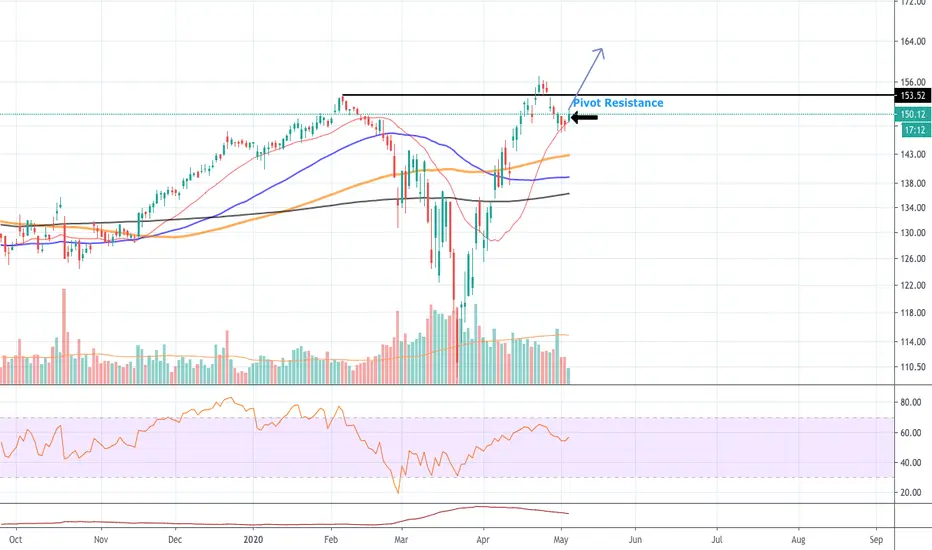
4.24.2020 JNJ Bearish Weekly Divergence + under resistanceUnder resistance trend
Good play to short with a stop above high.
-NFA

JNJ resistance areaJNJ could go touch a new all time high, but for the moment we are in a long term daily resistance area, I'm not short but at short term if you have JNJ shares I recommend to sell them. Next JNJ signal will be published on this account
