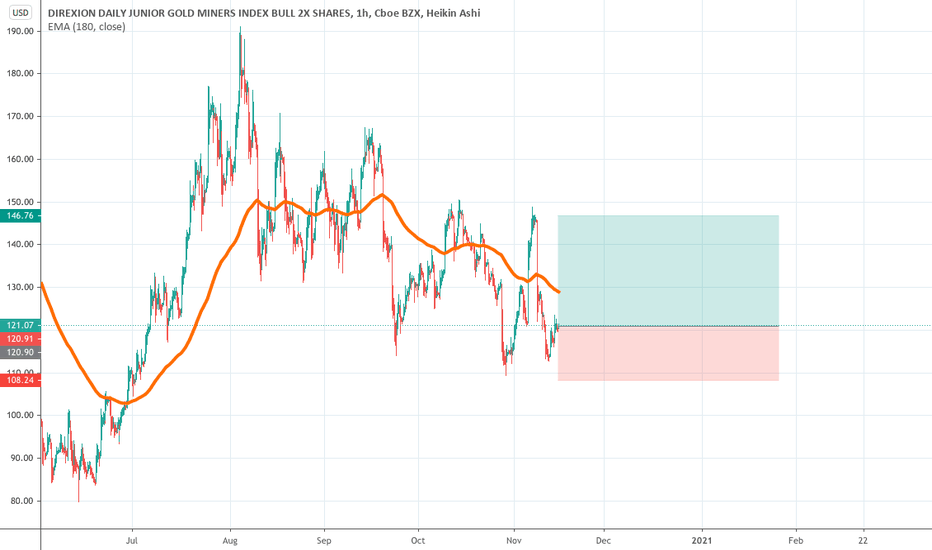
JNUG
Goldaholics AnonymousGold is zooming.
Why?
The DXY.
As we can see on the monthly DXY chart, the developing pattern parallels history.
1. It bounced off the 200 EMA
2. It broke trend, retested, and failed
3. It collapsed
The RSI and MACD are weak
What happened to Gold last time DXY collapsed?
Trading Signals
Buy Signal: Weekly RSI lows
Sell Signal: Weekly RSI highs
See previous posts for fibonacci extension targets.
Long MGC futures Feb(G)2021
Trading is risky and should not be attempted, ever.
GDX I'VE BEEN WAITING FOR THIS$nugt $dust $gdxj $jnug $jdst $slv $gld
Renko is not playable in published ideas so I'll update this chart. My last post got little attention and I've been warning people about a sudden drop in gold, silver, miners. We're setting up a new buying opportunity but how low does it go? I would like to see GDX between 28-32. Hold fast.
Will the miners offer one more dip?I am wildly bullish on the miners and precious metals over the longer term but I suspect another corrective leg down. GDX has been forming a giant ascending wedge from 2013-2020 and just broke out of that pattern this year. The drop in March was just a small piece of that puzzle that flushed a lot of new & experienced traders out of the trade. I pointed out several times that it was potentially an extremely good buying opportunity. That turned out to be true and the miners have been one of my best trades this year. I'm not an expert on Elliott Wave Theory but I'm seeing what looks like 5 waves up that completed in August. Perhaps now price is still stuck in some type of correction before a much larger move takes place. Take note of the red flag on my lower indicator. There's clearly a trend there and price has not dropped enough to complete another touch. There's no rule that says it must but it's just something to watch. Be patient. Be smart. Do YOUR OWN homework. Follow price. Ignore emotion... and get ready!
Wedge breakoutGold needed to cross below daily 50ma in order to go higher. Also, this appears to be the beginning of the breakout from the wedge. It looks like a whipsaw. I expect gold has a short term bottom here and will be up over the next 5 days. I don't think we are starting the next leg up over 2K. We need to wait about 4 weeks for that. I don't know how bullish of a breakout this will be. I've put 3 possible price targets...
Widen Your GazeProviding an update to our previous trade setup for Gold that outlined a potential Bearish Head and Shoulders setting off a fractal chain reaction of selling pressure. That scenario has played out as we predicted and we expect selling pressure to remain intact for the near term. We expect the bearish momentum to continue until we reach previous highs around the 1920's.
Never trade a pattern before it has completed and aways hedge your positions as appropriate.
GOLD REVERSAL WITH FRACTAL H&SHere is a multi-timeframe fractal analysis for Gold priced in USD. Looks can be deceiving but it appears a head and shoulders pattern has formed signaling a short term price reversal in the yellow metal. This pattern has potential to set off a chain reaction of bearish chart patterns and downward price movement. Use stop loss as appropriate as these are irrational markets and volitility could spike at any moment.
To validate, looking at the DXY, the chart seems to show the opposite with a double bottom reversal pattern beginning bullish series of movements.
Good Luck Traders!
GOLD ascending triangle$gld $gdx $nugt $dust $jdst $jnug $gdxj $slv $sil
I'm bullish on gold no matter what technical patterns are at play. This is an interesting pattern I've not spotted until the last few months. Looks like a legitimate ascending triangle and measured breakout. Will it break above and never look back or will it correct and land on top to test the triangle? Doesn't matter to me. Either you hold it or you don't.


